Supernova Remnants in the Magellanic Clouds IV: X-ray Emission from the Largest SNR in the LMC
Abstract
We present the first X-ray detection of SNR 045070.9, the largest known supernova remnant (SNR) in the Large Magellanic Cloud. To study the physical conditions of this SNR, we have obtained XMM-Newton X-ray observations, optical images and high-dispersion spectra, and radio continuum maps. Optical images of SNR 045070.9 show a large, irregular elliptical shell with bright filaments along the eastern and western rims and within the shell interior. The interior filaments have higher [S II]/H ratios and form an apparent inner shell morphology. The X-ray emission region is smaller than the full extent of the optical shell, with the brightest X-ray emission found within the small interior shell and on the western rim of the large shell. The expansion velocity of the small shell is 220 km s-1, while the large shell is 120 km s-1.
The radio image shows central brightening and a fairly flat radio spectral index over the SNR. However, no point X-ray or radio source corresponding to a pulsar is detected and the X-ray emission is predominantly thermal. Therefore, these phenomena can be most reasonably explained in terms of the advanced age of the large SNR. Using hydrodynamic models combined with a nonequilibrium ionization model for thermal X-ray emission, we derived a lower limit on the SNR age of about 45,000 yr, well into the later stages of SNR evolution. Despite this, the temperature and density derived from spectral fits to the X-ray emission indicate that the remnant is still overpressured, and thus that the development is largely driven by hot gas in the SNR interior.
1 Introduction
Supernova remnants (SNRs) are the main contributors to the hot ionized component of the interstellar medium; however, the physical conditions and amounts of the hot gas in SNRs at late evolutionary stages are not well known. Theoretical models of hot gas in SNRs of ages 105–106 yr (e.g., Slavin & Cox, 1992, 1993; Shelton, 1999) cannot be compared easily to observations because few evolved SNRs are known and they are expected to be faint and difficult to observe.
SNR 045070.9 (Mathewson et al., 1985) is the largest known remnant in the Large Magellanic Cloud (LMC). Its optical extent of 6547 corresponds to 9870 pc at the LMC distance of 50 kpc (Feast, 1999). This SNR is not near any known OB association or bright H II region, and the surface density of field OB stars is low in its vicinity (Chu & Kennicutt, 1988); thus, it is unlikely to be a case of a SNR brightening a superbubble through an internal collision with the walls of the shell of the superbubble (Chu & Mac Low, 1990).
While larger SNR candidates in the LMC have been identified at X-ray wavelengths (e.g., Chu et al., 2000; Lowry et al., 2004), such candidates are in a tenuous medium, so that no optical or radio counterparts can be detected to confirm their physical nature. SNR 045070.9, on the other hand, has a [S II]/H ratio of 0.7 and a radio spectral index estimated at 0.2 (), which clearly confirm its identity as an SNR (Mathewson et al., 1985; Clarke, Little, & Mills, 1976). The X-ray emission from SNR 045070.9 has never been detected; no pointed Einstein or ROSAT observations of this remnant were ever made. While the ROSAT All-Sky Survey did cover this region, no emission from the SNR was detected.
To study the physical conditions of this large and evolved SNR, we have obtained and analyzed XMM-Newton X-ray observations, optical images and high-dispersion spectra, and additional radio continuum maps. In this paper, §2 describes these observations, §3 presents the results of our analysis, and §4 discusses the implications of our findings.
2 Observations
X-ray observations of the hot gas in SNR 045070.9 were made by XMM-Newton in 2001 November (Observation IDs 89210601 and 89210801). Unfortunately, the European Photon Imaging Camera (EPIC) PN camera was not turned on in the first observation, and only the Reflection Grating Spectrometer was used in the second. Only the EPIC MOS data from the first observation were useful; the exposure time was 62.5 ks.
We received the pipeline-processed data from the XMM-Newton Science Operations Centre (SOC). Initial reduction and analyses were carried out using the Science Analysis Software (SAS) package provided by the SOC. We filtered out data with high background or poor event grades, leaving 48.8 ks of good exposure time for each of the two EPIC MOS detectors. Images and spectra were then extracted from the filtered event files. The EPIC MOS images were combined, using the experimental SAS task “merge”, to increase the signal-to-noise ratio. The intrinsic on-axis point-spread function (PSF) of the telescopes associated with the MOS detectors are 43 and 44 at 1.5 keV; our images are adaptively smoothed, further reducing the resolution in order to bin photons to a signal-to-noise ratio of 6 (SAS asmooth task). Source-free regions surrounding the SNR were used to produce background spectra, which were scaled and subtracted from the SNR spectra. Further spatial and spectral analysis was done using the FTOOLS and XSPEC software. Spectra were binned to a minimum of 20 counts per bin to improve statistics. The spectra of the two EPIC MOS detectors were fitted jointly to produce the spectral parameters.
To map the dense swept-up shell of SNR 045070.9, we used the H (6561) + [N II] (6548,6583), [S II] (6716,6731), and red continuum ( = 6850Å, = 95Å) images taken with the Curtis Schmidt Telescope at Cerro Tololo Inter-American Observatory (CTIO) as part of the Magellanic Cloud Emission-Line Survey (MCELS, Smith et al., 1999). The exposure times were 300s, 600s and 300s, respectively. The images have ″ resolution. All images were flux-calibrated. Contribution from the [N II] lines is present in the H filter image, but due to the low [N II]/H ratios observed for older SNRs in the LMC (0.2–0.3; Dodorico & Sabbadin, 1976) this contribution is expected to be small. The red continuum image was scaled and subtracted from the H and [S II] images to remove the stellar emission. The [S II] and H images were clipped at and divided to make an [S II]/H ratio map.
To examine the dynamic properties of this SNR, high-dispersion long-slit spectroscopic observations of the H and [N II] 6548, 6583 lines were obtained with the echelle spectrograph on the 4m Blanco Telescope at CTIO on 2000 December 6. The detailed observing configuration can be found in the paper by Chu et al. (2003). Briefly, the data array samples ′ along the slit with a pixel size of 026, and covers Å along the dispersion axis with a pixel size of 0.082 Å. A 164 slit width was used and the resulting instrumental profile has a full width at half maximum (FWHM) of km s-1 at the H line. The echelle observation was made with an E-W oriented slit for an exposure time of 1200 s.
Finally, to study the synchrotron radiation from SNR 045070.9 we use radio images at 8640 and 4800 MHz made with the Australia Telescope Compact Array (ATCA) as part of a survey of the entire LMC (Dickel & McIntyre, 2003). These are combinations of several short-integration samples and not as sensitive or complete as would be gotten from a full aperture-synthesis observation of the SNR alone. The 4800 MHz data have a half power beam width (HPBW) of 33″, while the 8640 MHz data have a HPBW of 20″; we convolved the latter to match the 33″ HPBW of the former. A detailed description of the ATCA continuum survey of the LMC will be published by Dickel et al. (2004).
3 Results
3.1 Morphology
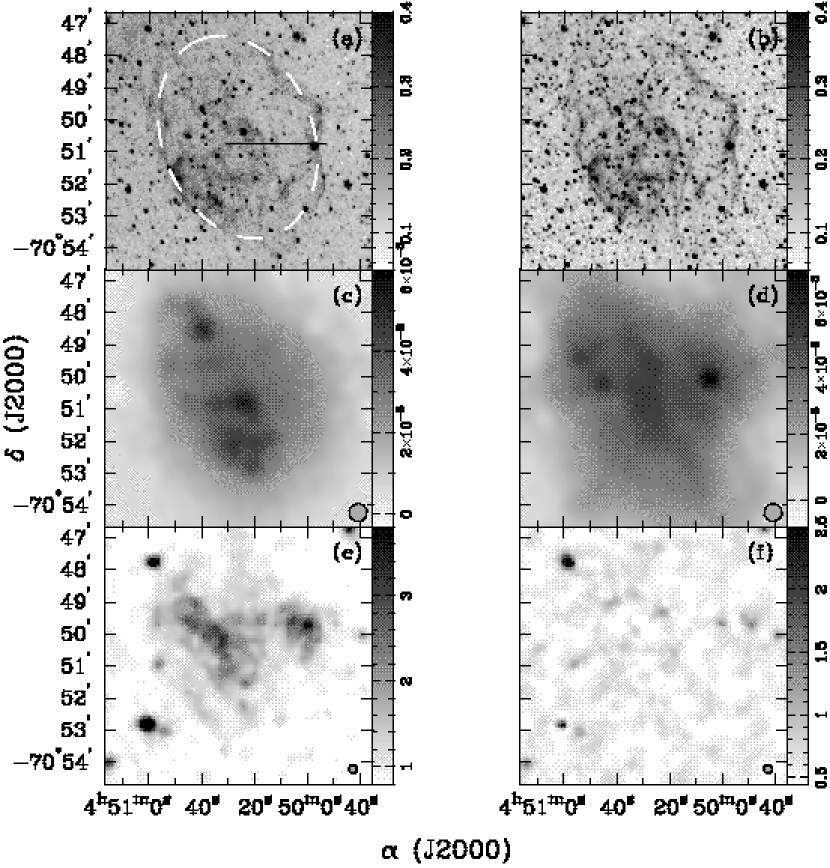
The MCELS images show the H emission from SNR 045070.9 to be clearly shell-like, if irregular, against a diffuse background, much as reported by Mathewson et al. (1985). The shell appears slightly more limb-brightened along the eastern and western sides. Some filamentary emission also appears interior to this shell (at least in projection). In [S II], the shell appears more brightly against the diffuse background and the interior filaments are the brightest section of the SNR (Fig. 1a,b).
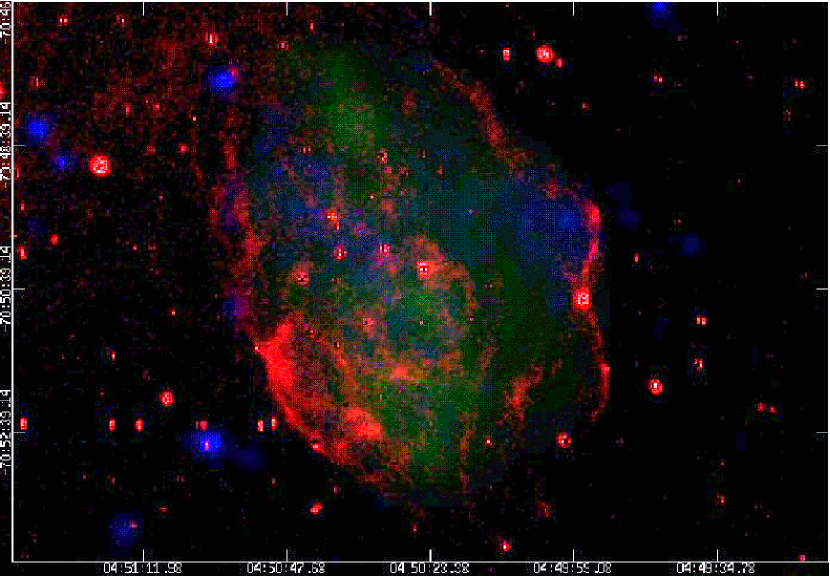
SNR 045070.9 was clearly detected in the individual XMM-Newton EPIC MOS images. The emission covered a roughly elliptical area with major and minor axes of 60 and 46. In the merged image (Fig. 1e), faint emission is slightly more visible above the background level, including an arc along most of the eastern side of the SNR, corresponding well to the shell seen in optical images. Toward the northern and southwestern ends of the SNR, however, the X-ray emission still does not reach the full optical extent. Throughout the X-ray emitting region, the surface brightness increases toward the SNR center, with the exception of a bright spot at a protrusion on the western side of the SNR. The X-ray morphology falls between the “centrally brightened” and “diffuse face” categories used in the classifications of Williams et al. (1999). Rho & Petre (1998) define a category of SNRs, which show centrally-filled X-ray emission combined with a radio shell, as “mixed morphology.” Here, we expand that definition to include SNRs with centrally-filled thermal X-ray emission in a shell remnant observed at any wavelength, which would describe SNR 045070.9 (Fig. 2).
Surprisingly, the radio images do not show shell-like emission. In the 4800 MHz image, diffuse radio emission can be seen over the face of the entire remnant, with possible bright patches along the major axis of the SNR. The outline of the noisy 8640 MHz image more closely resembles the X-ray distribution, with broad peaks corresponding to the X-ray maxima in the center and along the western limb. A centrally filled radio morphology can indicate the presence of a pulsar, but no point source is detected in either radio or X-ray observations.
3.2 Physical Structure
3.2.1 Hot Interior
The XMM-Newton EPIC collected 5684 source counts with MOS1 and 5763 source
counts with MOS2 for SNR 045070.9 over the total selected good-time intervals of
48.8 ks. The majority of the X-ray emission from the SNR’s interior is
below 2 keV, and is consistent with emission from a thermal plasma. Other
models, such as a simple power-law, can be ruled out at the 90% confidence
level. Given the advanced evolutionary stage of the SNR, we expect its
age to be sufficiently close to the ionization timescale to neglect the
effects of nonequilibrium ionization; this fact and the low X-ray count
rate led us to choose a simple equilibrium-ionization plasma model.
A MeKaL111Details and references for the MeKaL thermal plasma
model can be found at
http://heasarc.gsfc.nasa.gov/docs/xanadu/xspec/manual/node39.html
model fit gave parameters as follows: absorption column density of
cm-2, plasma temperature
keV, abundances of times solar values,
and a normalization factor222Normalization factor
, where
is the electron density, is the volume, and is the
distance, all in cgs units.
of = cm-5. Errors given are representative
of the range of values at the 90% confidence level, and were determined
by varying the free parameters together using the error command
in xspec. Although technically the error of the normalization
is interdependent with those of the other parameters, we have given only
the uncorrelated component, as this parameter is varied during the fitting
process of error. The quoted errors are statistical,
and do not include systematic contributions from, e.g., the possible
presence of more than one temperature component. While the fit is
statistically acceptable (reduced for 337 degrees of freedom),
the error bars for the energy bins allow considerable latitude for such
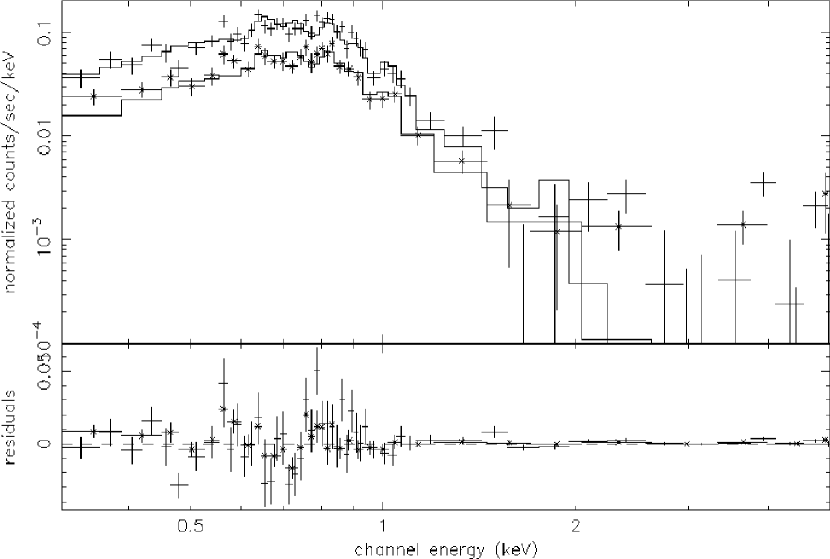
fits. The best-fit spectrum for the merged event file was very similar to
that for the individual MOS spectra (Fig. 3). Based on this
model fit, we obtain an absorbed flux of 1.7
erg cm-2 s-1, or an unabsorbed flux of 3.9
erg cm-2 s-1, over the 0.2 to 10 keV range. At a distance of
50 kpc, this equates to a luminosity of 1.2 erg s-1.
As a check on our fitted value of , we determined the amount of Galactic toward SNR 045070.9 from the work of Dickey & Lockman (1990), which gave an average value of 9.0 1020 cm-2. To this, we added the estimate of Rohlfs et al. (1984) for the internal column density of the LMC along the closest line of sight to SNR 045070.9, 7.4 1020 cm-2. Although the measurement of for the LMC includes material behind SNR 045070.9 as well as in front of it, it does not include contributions from other molecular or ionized gas. The two sources of error tend to offset one another, so we treat these factors as negligible in our estimation. The resulting estimate of total = 1.6 1021 cm-2 is within the 90% error range of our fitted value.
The normalization factor of the MeKaL model can be used to determine the density of the hot gas. We calculate the volume of the hot gas by measuring the optical and X-ray extent of the SNR, treating each as an ellipsoid with a height equal to the average of the semimajor and semiminor axes that describe its extent on the sky. We assume that the hot gas occupies any area not filled by the cool shell, and vice versa. We measure a linear difference between the optical and X-ray extent of about 2 pc, implying a shell thickness of approximately that width; the volume of hot gas comes to 8 cm3. Within this X-ray emitting volume, we assume a volume filling factor of 1, to reflect the centrally filled X-ray morphology of the remnant. We further assume a distance of 50 kpc for the SNR, and that hydrogen and helium are fully ionized (). Then, using the normalization given above, we find a density in the hot gas of cm-3. This low density is unsurprising, as the smaller extent of the X-ray emission, compared to the optical, suggests that most of the radiation is coming from the cavity evacuated during the earlier SNR expansion. Using these numbers for the hot gas volume and density, we find a total mass of hot gas of 8 2 g, or 400 100 M☉. Quoted errors are simply propagation of the random errors in the fitted quantities.
These estimates of volume and density can be used to calculate the thermal energy and thermal pressure in this hot gas, from and , respectively. In both cases we use the value of the temperature derived from spectral fits, 0.28 keV. This yields values of = 3.2 0.9 erg and = 2.7 0.7 dyne cm-2.
3.2.2 Cool Shell
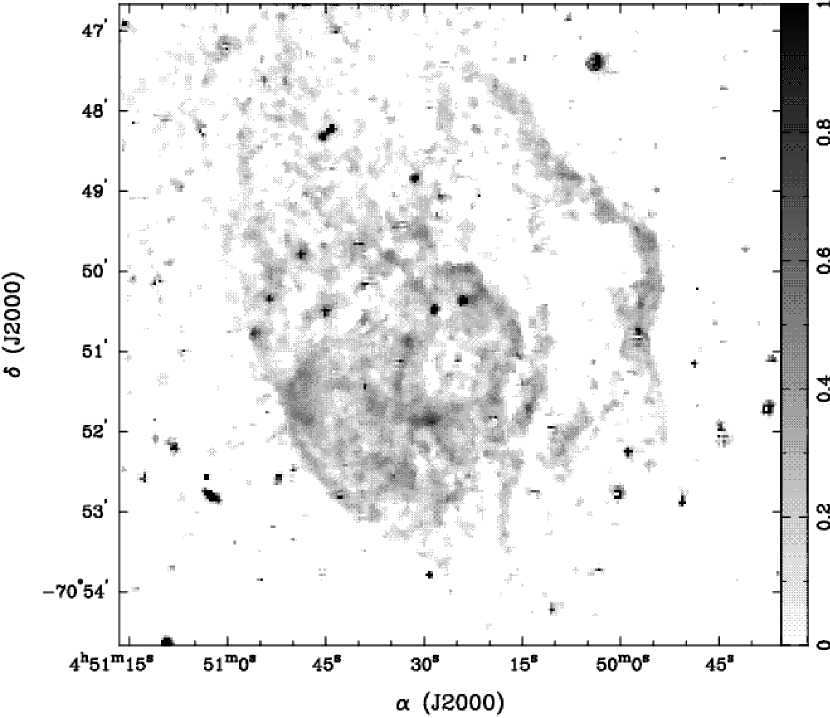
The shell of cool material behind the shock is mostly visible at optical wavelengths, with recently cooled shocked gas delineated by areas of higher [S II]/H ratios. As shown in Figure 4, the [S II]/H ratios in many optical filaments are relatively low for an SNR, only exceeding 0.6 in a few patches, most of which are located in a roughly circular region in the remnant’s interior. This inner region corresponds well, spatially, to the small area of clearly nonthermal emission seen in radio (§3.2.3). It also corresponds well to a region of clear red-shifted expansion seen in echelle spectroscopy as described below.
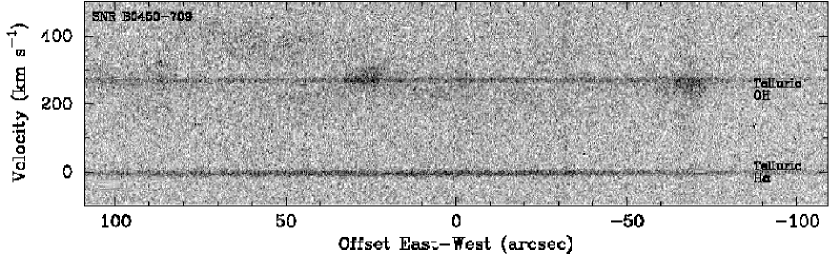
The optical echelle data show several lines in the H spectral region. The Doppler-shifted nebular H emission toward the SNR includes both a velocity component constant along the slit, representing the background interstellar gas and adopted as the SNR’s systemic velocity, and multiple regions of emission deviating from this systemic velocity, showing motions within the expanding gas. Also detected are the narrow geocoronal H (6562.85 Å) and telluric OH 6-1 P2(3.5) 6568.779 lines (Osterbrock et al., 1996), both of which are constant along the slit (Fig. 5).
Emission at the systemic velocity of SNR 045070.9 is faint and unfortunately overlaps with that from the telluric OH line, making this velocity more difficult to discern with high accuracy. However, a plot of the velocity profile in one of the regions of brighter SNR emission, in which the data are summed over 25″ along the slit, appears to show two components, one at 6568.6 Å and the other the telluric OH line at 6568.7 Å. We identify the former as the Doppler-shifted component representing the systemic velocity of the SNR, which would imply a heliocentric velocity of 271 3 km s-1. Accordingly, the shifts in velocity of expanding material from the SNR shell () are measured from this estimated systemic velocity.
While there is some resemblance to the classic bow-shaped pattern of a rapidly expanding shell, the distribution of the velocities is uneven, with multiple occurrences of convergence toward, and deviation from, the systemic velocity. Of particular interest is the fact that there appears to be a section across the SNR’s face which shows a distinct expansion pattern in red-shifted emission, with a fainter counterpart at blue-shifted velocities. Spatially, this velocity pattern lies along the circular region of enhanced [S II]/H emission and nonthermal radio emission, centered at R.A. 04h50m23s and 90″ in diameter. Elsewhere along the slit, the SNR shows maximum velocities of = 120 5 km s-1 and = 52 5 km s-1. However, in the region of the distinct expansion pattern, maximum velocities are = 130 10 km s-1 and = 220 10 km s-1. These calculations should of course be approached with caution, as for an expanding shell, it is expected that the maximum expansion velocities will be measured at the center of the remnant’s face, where the velocity component along the line-of-sight is greatest. It is the abrupt transition from somewhat chaotic low-velocity distribution to a clear expansion pattern toward the center that makes this region notable.
The filaments measured from the flux-calibrated MCELS H images have an average surface brightness of 2.0 0.5 erg cm-2 s-1 arcsec-2, which gives an emission measure of 104 23 cm-6 pc at a presumed temperature of 104 K. For comparison, the background H emission at the 2 level is 8.8 erg cm-2 s-1 arcsec-2, or an emission measure of 46 cm-6 pc. As the emission measure is proportional to , we can calculate a density from the longest line-of-sight through the shell. We estimate a radius of 42 pc and a shell thickness of 8 2″ (2 0.5 pc) in excellent agreement with the difference between optical and X-ray extent found above. Using (where is the shell thickness), we calculate = 25.6 pc and therefore an average shell density of 2.0 1.0 cm-3. This figure should be treated with caution, as it is based on a spherical shell (as is manifestly not the case here), and as the estimate of shell thickness is close to the resolution of the image (2″ 2″ pixels). Our estimated density is an average throughout the SNR shell, and is broadly typical of such average densities found in other LMC SNR shells (e.g., Morse et al., 1996); individual filament and clump densities may be considerably higher.
As a cross-check on our figures above, we calculate the density based on the H luminosity over the entire SNR, rather than from the surface brightness of individual filaments along the limb. This luminosity, , is related to the emission coefficient according to
where is the emitting volume. We assume a temperature of =104 K, for which = 2.4 10-25 erg s-1 cm3 (Osterbrock, 1989). We also assume the emitting gas consists of singly ionized hydrogen and helium with a number ratio of H:He = 10:1. Over the face of the remnant, we measure 4 2 erg s-1. Recalling our estimate for the cool gas volume as an ellipsoidal shell of 2 pc thickness, we calculate a volume for this region of 1 cm3, or an approximate fractional volume of 0.1 for the shell with respect to the entire SNR volume. This estimate yields a density of 1.4 1.0 cm-3, in good agreement with the value found above. Note that this value is dependent on the filling factor of H-emitting gas within the shell, and increases as the inverse square root of that factor.
A density of 2.0 cm-3 as calculated above, along with our estimate of the shell volume, implies a mass of 3.6 1.8 g, or 1800 900 M☉, in the shell. If we add this mass to that of the hot gas, and subtract 20 M☉ for the progenitor, we find a mean value for the density in the pre-SN ISM over this volume of 0.3 cm-3. For comparison, if we assume our measured shell density represents a factor of four compression behind the shock, the ISM density would be 0.5 cm-3, consistent within the errors and assumptions.
Using this mass and the maximum expansion velocity (220 km s-1) found from echelle observations, we can use to derive a kinetic energy of 9 4 erg. If instead we assume that the 220 km s-1 velocity is associated with a separate shell, and use the maximum velocity measured in the outer filaments (120 km s-1) to represent the expansion velocity of the SNR, we obtain a kinetic energy of 3 1 erg. Likewise, we can calculate the thermal pressure in the cool shell from , using our calculated density and an estimated shell temperature of 104 K; we find a value of 2.8 1.4 dyne cm-2. As this is still an order of magnitude less than the value derived for the hot gas, we suggest that this SNR may still be pressure-driven, in agreement with the current understanding of the expansion of older remnants (e.g., Bandiera & Petruk, 2004, and references therein). This remnant is among the few old SNRs whose cavity and shell pressures can be determined sufficiently for comparison with model predictions. This is a significant finding, therefore, as it helps to confirm observationally the analytic and numerical finding that interior pressure is a significant factor in the expansion of SNRs to late ages.
3.2.3 Radio Emission
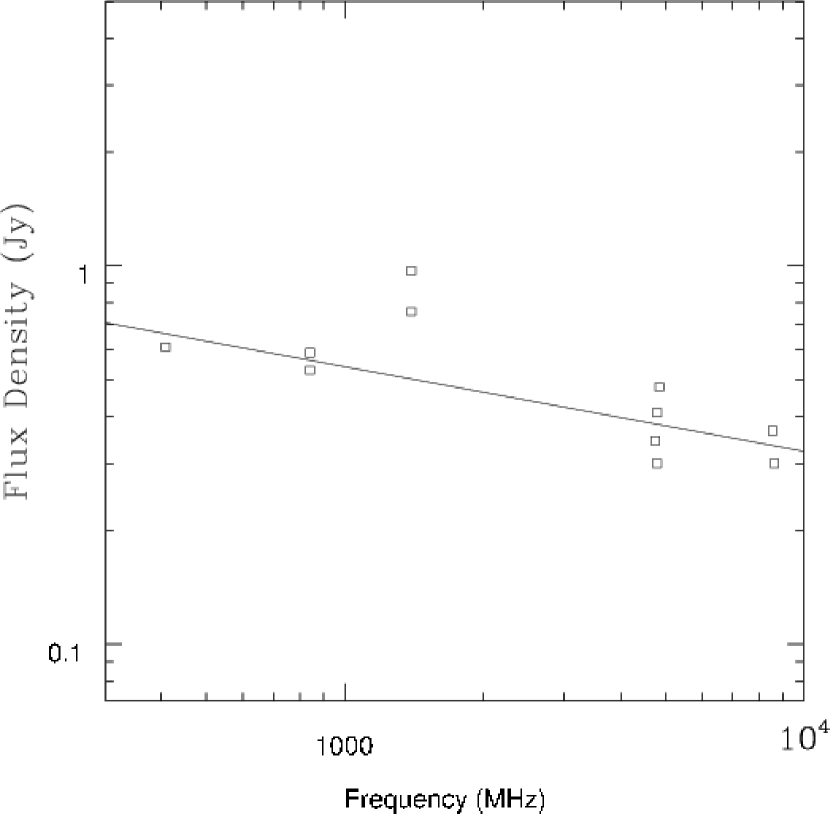
The radio spectrum of SNR 045070.9 is relatively flat; only the central 6-cm peak (which also corresponds to the bright [S II]/H region in the optical) can be confidently described as nonthermal, although the best-fit spectrum for the entire remnant is steeper than that of thermal radiation. We combined our flux density values with those of previous radio observations at various frequencies (McGee, Brooks, & Batchelor, 1972; Clarke, Little, & Mills, 1976; Mathewson et al., 1985; Filipovic et al., 1995; Bock, Large, & Sadler, 1999) and used a linear regression fit (log frequency vs. log flux density) to obtain a spectral index for the SNR of 0.21 (Table 1, Fig. 6). Note that 1480 MHz data are included in the plot, but not used in the fit, as these data have insufficient resolution to exclude emission from another nearby bright source to the southwest. The spectral index for the SNR as a whole is unusually flat compared to the synchrotron spectrum expected for shell SNRs, typically 0.5333Trushkin, S. A. 1999, http://cats.sao.ru/snr_spectra.html; but radio spectral indices are known to flatten with shell age (Cowsik & Sarkar, 1984). We detect several spots of polarized emission at the 3 level only around the periphery of the remnant at 4.8 GHz, but they indicate approximately 30 – 50 % polarization and so are probably unreliable.
To demonstrate that the radio emission is in fact dominantly nonthermal, we compare the emission in H to its equivalent in the radio. If the radio emission were entirely thermal, the expected 6 cm flux density could be calculated from the ratio of the radio emission coefficient to the H emission coefficient. Following the derivation in Caplan & Deharveng (1986), we find
where is in erg cm-2 s-1 Jy-1, is in K, and is in Hz. Taking , K, and MHz thus gives erg cm-2 s-1 Jy-1. This ratio is directly related to the ratio of the H and radio fluxes:
We presume that, given the small extinctions involved, we can reasonably approximate = . The visual extinction can be calculated from the absorption column density obtained from the X-ray fits, using the LMC value of 2 1022 atoms cm-2 mag-1 from Koornneef (1982) to obtain mag. Using the column density value calculated from H I observations (Dickey & Lockman, 1990; Rohlfs et al., 1984) gives a slightly higher mag. In either case, the contribution of reddening in the visible band is negligible. Using the H flux given above, and correcting for the difference between the 6 cm beam size and the H pixel size, we find an expected mJy beam-1 if thermal emission is the sole source of the observed 6 cm flux. Given that the actual measured surface brightness ranges from 1 to 5 mJy beam-1 over the face of the remnant, we conclude that a substantial fraction of the radio emission is nonthermal.
The emission at radio wavelengths within SNRs is usually generated at the outer edge of the expanding shock (and, when applicable, the reverse shock), where accelerated relativistic electrons encounter compressed magnetic fields and thus generate synchrotron emission. Hence, one usually expects a shell-like distribution of nonthermal radio emission, in contrast to the distributed, relatively flat-spectral-index emission we observe in SNR 045070.9. In older remnants, the radio morphology tends to match the optical because the emission is generated in the compression of cooler filaments (Duin & van der Laan, 1974). However, this object may be old enough that some of the emission has diffused toward the center and much of the bright radio emission corresponds to the central object seen in bright [S II]/H filaments.
4 Discussion
Given the aspherical morphology and large extent of this SNR, it is difficult to calculate its probable age. If one takes an average radius of 42 pc, and estimates an expansion velocity of 220 km s-1 using the maximum expansion seen from the echelle data, one can use the relation for a rough estimate. Assuming point-blast expansion (Sedov, 1959, =0.4) gives an estimated age of 75,000 yr. However, it is quite possible that a remnant of this size, unless the external ISM is very tenuous, is well into the radiative, momentum-conserving phase. Bandiera & Petruk (2004) have developed an analytic solution for a momentum-conserving SNR for which interior thermal pressure is still a significant factor. In their picture, (there called ) will gradually fall from the value derived in numerical calculations () to the asymptotic value of . Using the former value and the parameters above yields an age of 62,000 yr, while the latter value gives 53,000 yr. The optical and X-ray properties described above are consistent with a SNR in this age range.
Slavin & Cox (1992) and Shelton (1999) predict that, as a remnant ages, the expansion velocity slows to the point where X-rays are no longer generated by the shock front. The remaining X-ray emission is from the hot interior of the SNR, where material had been shocked to high temperatures by the previous phases of more rapid SNR expansion. Thus, the dominant source for the remaining X-ray emission is from “fossil radiation” due to this hot interior, and the SNR appears centrally filled in X-rays. This has been extended as a partial explanation for “mixed morphology” SNRs, although other physical processes, such as thermal conduction or evaporation of dense cloudlets, must be invoked to explain the high surface brightness of this extremely tenuous gas (Rho & Petre, 1998). This “hot bubble” is expected to shrink with respect to the full extent of the SNR as it ages, due to the cooling of the gas near the surface of the “hot bubble”. The extension of X-ray emission in SNR 045070.9 to the western edge of the optical shell, and the echelle-derived expansion velocity, suggests that in some regions, the shock front is still capable of producing soft X-rays. However, the centrally filled morphology and the overall smaller extent of the X-ray emitting region than the radio/optical SNR may indicate that not only has fossil radiation begun to predominate, but cooling of the “hot bubble” in some areas may be well underway. Alternately, the regions of low X-ray emission may simply be too faint for detection above noise levels, even with this long XMM-Newton exposure.
To test whether this picture of SNR 045070.9 was consistent with our observations, we compared our findings with spectra simulated from nonequilibrium ionization (NEI) hydrocode for a SNR in a relatively low-density region with significant ambient nonthermal pressure. A detailed description of the SNR model is given by Shelton (1999). The particular simulation used here assumed an explosion energy of 1051 erg, ambient density of 0.1 cm-3, and an effective ambient magnetic field of 5 G. We followed the SNR development up to an age of 3 106 yr, showing the evolution of the soft (0.1-2.2 keV) X-ray spectrum over this period. We applied a multiplicative model for photoelectric absorption to this range of model spectra, and fit them to our XMM-Newton data.
The model fits did not provide a unique solution, but rather showed several local minima in the fits within a fairly restricted region of parameter space. The values of reduced (1.4 for 110 degrees of freedom) for these minima are statistically significant only at very low confidence levels, but are at least reasonable given the amount of noise in the data. These “best fits” were obtained for ages of 45,000 yr through 95,000 yr, with column densities of 2-4 1021 cm-2, somewhat higher than the absorption found for a simple plasma model. This range of ages, though broad, is consistent with the range of kinematically-derived ages, providing an independent consistency check to our age derivations above.
To estimate the effects of the ambient density on the model results, we also compared our data to modeled spectra for a remnant in an ambient ISM of 0.01 cm-3 (“SNR C” from Shelton, 1999). Unsurprisingly, the best fits occurred at the high end of the age range (95,000 yr), and also required higher absorption column densities of 5 1021 cm-2. This is consistent with our expectation that a remnant within a lower ambient density medium would evolve and cool more slowly than its counterpart in a denser ISM. The fact that the kinematically derived ages are more consistent with the models for a 0.1 cm-3 ISM than for a 0.01 cm-3 ISM provides some additional support of the range of ambient densities (0.3-0.5 cm-3) calculated above for the medium around SNR 045070.9.
These estimates for the advanced age of this SNR also provide a framework for the interpretation of the radio morphology. At this age, the shock strength may be low enough that relativistic particles are no longer accelerated at the outer edges of the SNR and so the radio synchrotron emission is distributed more evenly over the remnant. We can then attribute the lack of a clear shell to the fact that the SNR has passed into a late-evolutionary stage, and therefore is subject to volume emissivity enhancements as in IC 443 (Duin & van der Laan, 1974), following the distribution of cool neutral material. This gas is expected to occupy (at a small volume filling factor) a wide region behind the shock, which would lead to a more distributed radio surface brightness. In addition, if SNR 045070.9 is expanding into a clumpy ISM as suggested by the irregular morphology, the distribution of such material - and thus the enhancement to radio emission - may be further spread out across the remnant, leading to a “patchy” radio surface brightness as seen in SNR 045070.9.
The lack of a steeper spectral index for the radio emission, one of the classic signatures of SNRs, is puzzling. The relativistic particles responsible for most of the radio synchrotron emission have lifetimes ranging from 105 to 107 yr, so even if there were no new acceleration of such particles, we would still expect the existing supply of relativistic electrons to exhibit significant nonthermal radio emission with a spectral index closer to 0.5. For example, SNR 045070.9 shares certain characteristics with the Galactic SNR W28. Rho & Borkowski (2002) found that, as with SNR 045070.9, the X-ray emission from W28 is unevenly distributed, elliptical on the sky, and centrally brightened. Much of W28 appears to be in the radiative stage, with expansion velocities 100 km s-1. However, W28 still has a spectral index of 0.4 (Kassim, 1992), steeper than that seen in SNR 045070.9, although it also possesses a “flat spectrum core”. The latter, however, is commonly thought to result from a pulsar-wind nebula (PWN) contribution, which is unlikely in the case of SNR 045070.9. It would be quite unusual for a remnant of SNR 045070.9’s age to contain a PWN, and the extent of the emission (diameter 70 pc) would make it over twice as large as the largest currently known Crab-type SNR (Gaensler, Dickel, & Green, 2000). Furthermore, no regions of hard ( 3 keV) X-ray emission are seen within SNR 045070.9, which argues against the presence of any region of nonthermal X-ray emission as would be expected from a PWN. It is possible that the lack of a well-determined nonthermal radio emission spectrum is simply a function of the faintness of the SNR emission with respect to the background, making it difficult to accurately determine the spectral index.
Our study of the X-ray emission from SNR 045070.9, in conjunction with radio and optical data, provides a relatively consistent overall scenario for this SNR, but one which leaves open several possibilities concerning the development of the interior substructure. Our estimates of the physical parameters of the SNR (hot gas, shell, and ambient densities; thermal pressures; thermal and kinetic energies) are consistent with the picture of a large, old shell in a late stage of SNR evolution, with its development largely a factor of shell momentum and interior pressure. However, the distributed radio emission is not a commonly seen phenomenon, and therefore leaves open the question of whether this too is a natural consequence of late-stage SNR expansion.
The detection of significant X-ray emission over the face of this SNR has also provided us with a rare opportunity to directly test models of late-stage SNR development against the data. Although our preliminary analysis allows wide latitude for error, we are certainly able to show that one such set of models is consistent with the data for reasonable choices of physical parameters. Future work drawing on the sensitivity of instruments such as those on XMM-Newton will enable the discovery, analysis, and rigorous comparison with models for the highly underrepresented population of well-evolved remnants such as SNR 045070.9.
References
- Bandiera & Petruk (2004) Bandiera, R., & Petruk, O. 2004, A&A, in press, astro-ph/0402598
- Bock, Large, & Sadler (1999) Bock, D. C.-J., Large, M. I., & Sadler, E. M. 1999, AJ, 117, 1578
- Caplan & Deharveng (1986) Caplan, J. & Deharveng, L. 1986, A&A, 155, 297
- Chu et al. (2003) Chu, Y.-H., Chen, C.-H. R., Danforth, C., Dunne, B. C., Gruendl, R. A., Nazé, Y., Oey, M. S., & Points, S. D. 2003, AJ, 125, 2098
- Chu & Kennicutt (1988) Chu, Y.-H., & Kennicutt, R. C. Jr. 1988, AJ, 96, 1874
- Chu et al. (2000) Chu, Y.-H., Kim, S., Points, S. D., Petre, R. & Snowden, S. L. 2000, AJ, 119, 2242
- Chu & Mac Low (1990) Chu, Y.-H., & Mac Low, M. M. 1990, ApJ, 365, 510
- Clarke, Little, & Mills (1976) Clarke, J. N., Little, A. G., & Mills, B. Y. 1976, AuJPA, 40, 1
- Cowsik & Sarkar (1984) Cowsik, R. & Sarkar, S. 1984, MNRAS, 207, 745
- Dickel & McIntyre (2003) Dickel, J. R., & McIntyre, V. 2003, BAAS, 202, 4001
- Dickel et al. (2004) Dickel, J. R., McIntyre, V., Gruendl, R. A., & Milne, D. K. 2004, AJ, to be submitted
- Dickey & Lockman (1990) Dickey, J. M., & Lockman, F. J. 1990, ARAA, 28, 215
- Dodorico & Sabbadin (1976) Dodorico, S. & Sabbadin, F. 1976, A&A, 53, 44
- Duin & van der Laan (1974) Duin, R. M., & van der Laan, H. 1975, A&A, 40, 111
- Feast (1999) Feast, M. 1999, IAUS, 190, 542
- Filipovic et al. (1995) Filipovic, M. D., Haynes, R. F., White, G. L., Jones, P. A., Klein, U., & Wielebinski, R. 1995, A&AS, 111, 311
- Gaensler, Dickel, & Green (2000) Gaensler, B. M., Dickel, J. R., & Green, A. J. 2000, ApJ, 542, 380
- Kassim (1992) Kassim, N. E. 1992, AJ, 103, 943
- Koornneef (1982) Koornneef, J. 1982, A&A, 107, 247
- Lazendic, Dickel, & Jones (2003) Lazendic, J. S., Dickel, J. R., & Jones, P. A. 2003, ApJ, 596, 287
- Lowry et al. (2004) Lowry, J. D., Chu, Y.-H., Guerrero, M. A., Gruendl, R. A., Snowden, S. L., & Smith, R. C. 2004, AJ, 127, 125
- Mathewson et al. (1985) Mathewson, D. S., Ford, V. L., Tuohy, I. R., Mills, B. Y., Turtle, A. J., & Helfand, D. J. 1985, ApJS, 58, 197
- McGee, Brooks, & Batchelor (1972) McGee, R. X., Brooks, J. W., & Batchelor, R. A. 1972, AuJPh, 25, 581
- Morse et al. (1996) Morse, J. A., Blair, W. P., Dopita, M. A., Hughes, J. P., Kirshner, R. P., Long, K. S., Raymond, J. C., Sutherland, R. S., & Winkler, P. F. 1996, AJ, 112, 509
- Osterbrock et al. (1996) Osterbrock, D. E., Fulbright, J. P., Martel, A. R., Keane, M. J., Trager, S. C., & Basri, G. 1996, PASP, 108, 277
- Osterbrock (1989) Osterbrock, D. E. 1989, Astrophysics of Gaseous Nebulae and AGN (California: University Science Books)
- Rho & Petre (1998) Rho, J., & Petre, R. 1998, ApJL, 503, 167
- Rho & Borkowski (2002) Rho, J., & Borkowski, K. J. 2002, ApJ, 575, 201
- Rohlfs et al. (1984) Rohlfs, K., Kreitschmann, J., Feitzinger, J. V., & Siegman, B. C. 1984, A&A, 137, 343
- Sedov (1959) Sedov, L. I. 1959, Similarity and Dimensional Methods in Mechanics (New York: Academic)
- Shelton (1999) Shelton, R. 1999, ApJ, 521, 217
- Slavin & Cox (1992) Slavin, J. D., & Cox, D. P. 1992, ApJ, 392, 131
- Slavin & Cox (1993) Slavin, J. D., & Cox, D. P. 1993, ApJ, 417, 187
- Smith et al. (1999) Smith, R. C., & The MCELS Team 1999, IAU Symp. 190: New Views of the Magellanic Clouds, 190, 28
- Williams et al. (1999) Williams, R. M., Chu, Y.-H. Dickel, J. R., Petre, R., Smith, R. C., & Tavarez, M. 1999, ApJS, 123, 467
| Freq | Flux | Err | Telescope | Citation |
|---|---|---|---|---|
| (MHz) | (Jy) | (Jy) | ||
| 4800 | 0.41 | 0.15 | Parkes | McGee, Brooks, & Batchelor (1972) |
| 408 | 0.61 | 0.04 | Molonglo Cross | Clarke, Little, & Mills (1976) |
| 843 | 0.530 | MOST | Mathewson et al. (1985) | |
| 4750 | 0.345 | 0.04 | Parkes | Filipovic et al. (1995) |
| 4850 | 0.479 | 0.05 | Parkes | Filipovic et al. (1995) |
| 8550 | 0.367 | 0.06 | Parkes | Filipovic et al. (1995) |
| 8640 | 0.3 | 0.1 | ATCA | this work |
| 4800 | 0.3 | 0.1 | ATCA | this work |
| 843 | 0.590 | MOST | Bock, Large, & Sadler (1999) | |
| 1400 | 0.97 | Parkes | McGee, Brooks, & Batchelor (1972) | |
| 1400 | 0.758 | 0.13 | Parkes | Filipovic et al. (1995) |