The Formation of Bulges and Black Holes:
lessons from a census of active galaxies in the SDSS
Guinevere Kauffmann1 and Timothy M. Heckman2
1Max-Planck Institut für Astrophysik, D-85748 Garching, Germany
2Department of Physics and Astronomy, Johns Hopkins University, Baltimore, MD 21218
We examine the relationship between galaxies, supermassive black holes and AGN using a sample of 23,000 narrow-emission-line (“Type 2”) AGN drawn from a sample of 123,000 galaxies from the Sloan Digital Sky Survey. We have studied how AGN host properties compare to those of normal galaxies and how they depend on the luminosity of the active nucleus. We find that AGN reside in in massive galaxies and have distributions of sizes and concentrations that are similar to those of the early-type galaxies in our sample. The host galaxies of low-luminosity AGN have stellar populations similar to normal early-types. The hosts of high-luminosity AGN have much younger mean stellar ages and a significant fraction have experienced recent starbursts. High-luminosity AGN are also found in lower density environments. We then use the stellar velocity dispersions of the AGN hosts to estimate black hole masses and their [OIII]5007 emission line luminosities to estimate black hole accretion rates. We find that the volume averaged ratio of star formation to black hole accretion is for the bulge-dominated galaxies in our sample. This is remarkably similar to the observed ratio of stellar mass to black hole mass in nearby bulges. Most of the present-day black hole growth is occurring in black holes with masses less than . Our estimated accretion rates imply that low mass black holes are growing on a timescale that is comparable to the age of the Universe Around 50% this growth takes place in AGN that are radiating within a factor of five of the Eddington luminosity. Such systems are rare, making up only 0.2 % of the low mass black hole population at the present day. The rest of growth occurs in lower luminosity AGN. The growth timescale increases by more than an order of magnitude for the most massive black holes in our sample. We conclude that the evolution of the AGN luminosity function documented in recent optical and X-ray surveys is driven by a decrease in the characteristic mass scale of actively accreting black holes.
1 Introduction
Over the past few years there have been remarkable developments in our understanding of active galactic nuclei (AGN) and their role in galaxy formation and evolution. There is now compelling evidence (Herrnstein et al. 1999; Genzel et al. 2000) for the existence of the supermassive black holes that were long hypothesized as the power-source for active galactic nuclei (Salpeter 1964; Lynden-Bell 1969). The local mass density in these black holes is sufficient to have powered the known AGN population if plausible values for the radiative efficiency of the accreting material are assumed (Yu & Tremaine 2002). The tight correlation between the mass of the black hole and the velocity dispersion and mass of the galactic bulge within which it resides (Ferrarese & Merritt 2000; Gebhardt et al. 2000; Marconi & Hunt 2003) is compelling evidence for a strong connection between the formation of the black hole and its host galaxy (e.g. Cattaneo et al. 1999; Kauffmann & Haehnelt 2000; Granato et al. 2001). Finally, deep surveys with a generation of powerful X-ray observatories have established that the AGN population exhibits so-called “cosmic down-sizing”: the space density of AGN with low x-ray luminosities peaks at lower redshift than that of AGN with high x-ray luminosities (Steffen et al 2003; Ueda et al. 2003). These results indicate that a substantial amount of the total black hole growth has occured more recently than would have been deduced based on optical surveys of powerful quasars (Boyle et al. 2000; Fan et al. 2001).
The co-evolution of galaxies and black holes can be directly investigated through deep optical or x-ray surveys spanning a broad range in redshift. In our work, we have taken a complementary approach and we have used the Sloan Digital Sky Survey (SDSS) to examine the relationship between galaxies, supermassive black holes and AGN in the present-day Universe. Most of the results presented in this review have been published in a series of papers by Kauffmann et al. (2003a,b,c;2004) and by Heckman et al (2004).
2 Our SDSS Sample
Up to now, studies of AGN host galaxies have been limited by small sample size. In order to carry out detailed statistical analyses of host galaxy properties, one requires complete magnitude-limited samples of galaxies with spectra of high enough quality to identify AGN based on the characteristics of their emission lines.
The Sloan Digital Sky Survey (York et al. 2000; Stoughton et al. 2002) is using a dedicated 2.5-meter wide-field telescope at the Apache Point Observatory to conduct an imaging and spectroscopic survey of about a quarter of the extragalactic sky. The imaging is conducted in the , , , , and bands (Fukugita et al. 1996; Gunn et al. 1998; Hogg et al. 2001; Smith et. al. 2002), and spectra are obtained with a pair of multi-fiber spectrographs. When the current survey is complete, spectra will have been obtained for nearly 600,000 galaxies and 100,000 QSOs selected uniformly from the imaging data. Details on the spectroscopic target selection for the “main” galaxy sample and QSO sample can be found in Strauss et al. (2002) and Richards et al. (2002). Details about the tiling algorithm and the astrometry can be found in Blanton et al (2003a) and Pier et al (2003), respectively. The results shown here are based on spectra of 122,000 galaxies with contained in the the SDSS Data Release One (DR1; Abazaijan et al 2003). These data were made publicly available in 2003.
The spectra are obtained through 3 arcsec diameter fibers. At the median redshift of the main galaxy sample ( 0.1), the projected aperture diameter is 5.5 kpc and typically contains 20 to 40% of the total galaxy light. The SDSS spectra are thus closer to global than to nuclear spectra. At the median redshift the spectra cover the rest-frame wavelength range from 3500 to 8500 Å with a spectral resolution 2000 ( 65 km/s). They are spectrophotometrically calibrated through observations of F stars in each 3-degree field (Tremonti et al, in preparation). By design, the spectra are well-suited to the determination of the principal properties of the stars and ionized gas in galaxies. The absorption line indicators (primarily the 4000 Å break strength and the H index) and the emission line fluxes analyzed here are calculated using a special-purpose code described in detail in Tremonti et al.
The rich stellar absorption-line spectrum of a typical SDSS galaxy provides unique information about its stellar content and dynamics. However, it makes the measurement of weak nebular emission-lines quite difficult. To deal with this, we have performed a careful subtraction of the stellar absorption-line spectrum before measuring the nebular emission-lines. This is accomplished by fitting the emission-line-free regions of the spectrum with a model galaxy spectrum computed using the new population synthesis code of Bruzual & Charlot (2003, hereafter BC2003), which incorporates a high resolution (3 Å FWHM) stellar library.
We have used the amplitude of the 4000 Å break (the narrow version of the index defined in Balogh et al. 1999) and the strength of the H absorption line (the Lick index of Worthey & Ottaviani 1997) as diagnostics of the stellar populations of the host galaxies. Both indices are corrected for the observed contributions of the emission-lines in their bandpasses. Using a library of 32,000 model star formation histories, we have used the measured and indices to obtain a maximum likelihood estimate of the -band mass-to-light ratio for each galaxy. By comparing the colour predicted by the best-fit model to the observed colour of the galaxy, we also estimate the attenuation of the starlight due to dust. The reader is referred to Kauffmann et al (2003a) for more details.
The SDSS imaging data provide the basic structural parameters that are used in this analysis. We use the -band as our fiducial filter because it is the least sensitive to the effects of dust attenutaion. The -band absolute magnitude, combined with our estimated values of M/L and dust attenuation yield the stellar mass (). The half-light radius in the -band and the stellar mass yield the effective stellar surface mass-density (). As a proxy for Hubble type we use the SDSS “concentration” parameter , which is defined as the ratio of the radii enclosing 90% and 50% of the galaxy light in the band (see Stoughton et al. 2002). Strateva et al. (2001) find that galaxies with 2.6 are mostly early-type galaxies, whereas spirals and irregulars have 2.0 2.6.
3 Bimodality in the Physical Properties of Galaxies
Before we discuss the properties of the galaxies that host AGN, it is useful to review the observed relations between ”normal” galaxies in the local Universe. It is now more than 75 years since Hubble introduced his now-standard classification scheme for galaxies (Hubble 1926). Hubble realized very early on that galaxies exhibit striking regularity in their properties. In the simplest form, Hubble’s scheme recognizes three basic galaxy types: ellipticals, spirals and irregulars. These can be arranged in a linear sequence along which many properties vary coherently.
The advent of large redshift surveys of galaxies has enabled us not only to study the correlations between different galaxy properties, but also to quantify the distribution of galaxies in a multi-dimensional space of physical parameters. It has become clear that the galaxy population is strongly bimodal. This is seen in the distribution of galaxies as a function of colour; Strateva et al (2001) and Blanton et al (2003b) show that the colour distribution of galaxies has two pronounced peaks. The clustering properties of galaxies that fall into these two peaks are also very different. Red galaxies are more strongly clustered than blue galaxies and their two point correlation function is significantly steeper on small scales (Zehavi et al 2002; Madgwick et al 2003).
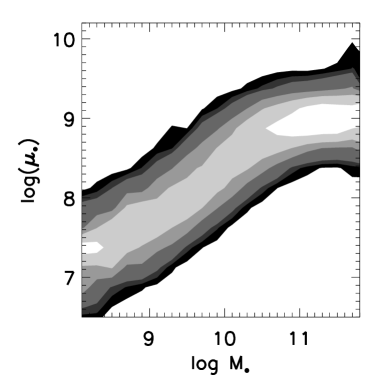
In Kauffmann et al (2003b), we studied the relations between the stellar masses, sizes, internal structure, and star formation histories of galaxies. We showed that the galaxy population as a whole divides into two distinct “families”. Below a characteristic stellar mass of , galaxies have low surface densities and concentrations typical of disk systems. The median surface mass density of low mass galaxies scales with mass as . At larger masses, the scaling of with becomes weaker and eventually saturates at at a value of around kpc-2 (Fig. 1).
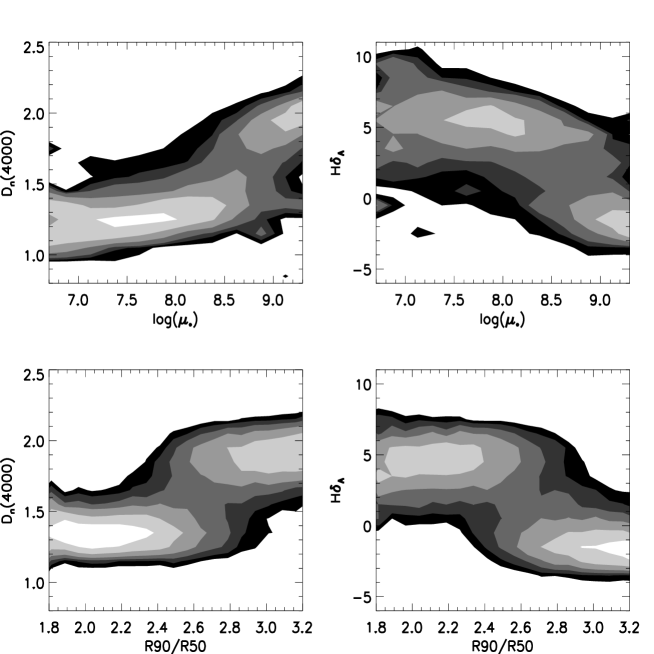
We also presented the conditional density distributions of two stellar age indicators, the 4000 Å break strength Dn(4000) and the H index as functions of stellar mass, stellar surface density and concentration. Faint low mass galaxies with low concentrations and surface mass densities have young stellar populations, ongoing star formation and blue colours. Bright galaxies with high stellar masses, high concentrations and high surface densities have old stellar populations, little ongoing star formation and red colours. A transition from “young” to “old” takes place at a characteristic stellar mass of , a stellar surface density of kpc-2 and a concentration index of 2.6 (Fig. 2).
4 Identifying and Classifying AGN in the SDSS
According to the standard “unified” model (e.g. Antonucci 1993), AGN can be broadly classified into two categories depending on whether the central black hole and its associated continuum and broad emission-line region is viewed directly (a “type 1” AGN) or is obscured by a dusty circumnuclear medium (a “type 2” AGN). In type 1 AGN the optical continuum is dominated by non-thermal emission, making it a challenge to study the host galaxy and its stellar population. We have therefore excluded the type 1 AGN from our initial sample.
Baldwin, Phillips & Terlevich (1981, hereafter BPT) demonstrated that it was possible to distinguish type 2 AGNs from normal star-forming galaxies by considering the intensity ratios of two pairs of relatively strong emission lines, and this technique was refined by Veilleux & Osterbrock (1987). It has become standard practice to classify objects according to their position on the so-called BPT diagrams. Fig. 3 shows an example of such a diagram for all the emission-line galaxies in our sample. We have plotted the ratio [OIII]5007/H versus the ratio [NII]6583/H for all galaxies where all four lines were detected with .
Fig. 3 shows that there are two well-separated sequences of emission line galaxies. Based on these data, we have chosen to define the demarcation between starburst galaxies and AGN as follows: A galaxy is defined to be an AGN if
| (1) |
This curve is represented by a dashed line in Fig.3.
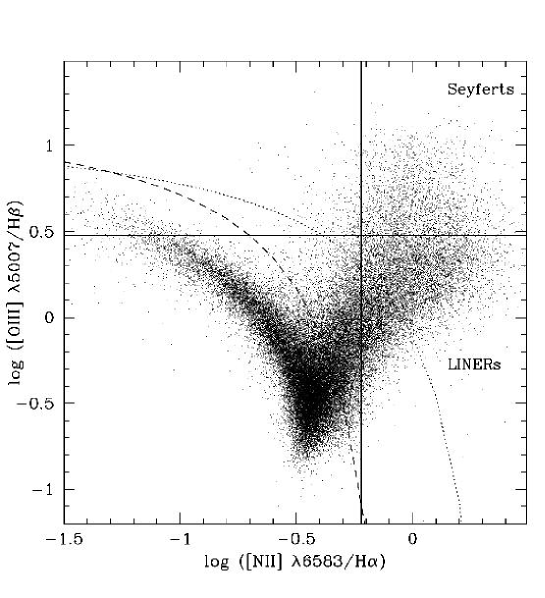
Narrow-line (type 2) AGN are traditionally divided into 3 general classes: type 2 Seyferts, LINERs, and the so-called “transition” objects. In traditional classification schemes (see for example Ho, Filippenko & Sargent 1997), Seyfert galaxies are identified as those objects with high values of both [OIII]/H () and of other ratios involving lower ionization lines, such as [NII]/H, [SII]/H and [OI]/H. LINERs, on the other hand, have lower values of [OIII]/H (), but high values of ratios involving the lower ionization lines.
A contribution to the emission-line spectrum by both star-formation and an AGN is almost inevitable in many of the SDSS galaxies, given the relatively large projected aperture size of the fibers (5.5 kpc diameter at ). This is much larger than the 200 pc apertures used in the survey of nearby galaxy nuclei by Ho, Filippenko & Sargent (1997). It is therefore not surprising that the majority of AGN in our sample fall into the “transition” class, and have line ratios intermediate between those of star-forming galaxies and those of LINERs or Seyferts.
We therefore prefer an AGN classification system that is less sensitive to aperture, while still reflecting the difference in intrinsic nuclear luminosity between Seyfert galaxies and LINERs. In our analysis, we focus on the luminosity of the [OIII]5007 line as a tracer of AGN activity. (Note that we correct the [OIII] luminosity for extinction using the Balmer decrement.) Although this line can be excited by massive stars as well as an AGN, it is known to be relatively weak in metal-rich, star-forming galaxies. The virtue of classifying galaxies by [OIII] luminosity is that this then allows us to study the large number of transition galaxies with spectra intermediate between pure star-forming systems and pure LINERs/Seyferts. We stress that any attempt to characterize the stellar population in AGN hosts must include the transition objects that comprise the majority of the AGN in Fig. 3. Excluding these would bias the sample against host galaxies with significant amounts of on-going star-formation.
5 The Masses and Structural Properties of AGN Host Galaxies
5.1 AGN are predominantly in massive galaxies
The AGN in our sample are drawn from an -band limited spectroscopic survey of galaxies. Galaxies of different luminosities can be seen to different distances before dropping out due to the selection limits of the survey. The volume within which a galaxy can be seen and will be included in the sample goes as the distance limit cubed, which results in the samples being dominated by intrinsically bright galaxies. In our work, we correct for this effect by giving each galaxy or AGN a weight equal to the inverse of its maximum visibility volume determined from the apparent magnitude limit of the survey.
Our sample of emission-line galaxies includes 55,747 objects where the four emission lines, H, [NII], [OIII] and H, are all detected with . In total, forty percent of these galaxies are classified as AGN, but this number is strongly dependent on host mass and to a lesser extent, on morphological type. As can be seen, AGN are preferentially found in more massive and more concentrated galaxies. The dependence of AGN fraction on mass is very striking. Even though 70-80% of galaxies with stellar masses less than have detectable emission lines, only a few percent are classified as AGN. In contrast, more than 80% of emission line galaxies with are AGN.
It should be noted that AGN detection rates are subject to strong selection effects. Ho et al (1997) find that 43% of the galaxies in their survey can be regarded as active and nearly all their galaxies have detectable emission lines. In our sample, the nuclear spectrum will be diluted by the light from surrounding host galaxy and our derived AGN fractions in massive galaxies are a strong function of distance. For nearby galaxies, the AGN fraction reaches 50%, a value very similar to the fraction that Ho et al found for the galaxies in their sample. On the other hand, the AGN fraction in low mass galaxies does not rise above a few percent, even for nearby galaxies. There are 6586 galaxies in our sample with stellar masses in the range , so this result has high statistical significance.
We find that for [OIII] luminosities greater than , the AGN fraction no longer depends on distance. We will henceforth refer to AGN as “strong” or “weak” using L[OIII] = as a dividing line. The fraction of strong AGN in galaxies with masses in the range is . There are fewer strong AGN in both lower mass and higher mass galaxies (see Kauffmann et al (2003c)).
5.2 Structural properties resemble those of normal early-type galaxies
Most previous studies of the global morphologies of type 2 AGN hosts have concentrated on Hubble type. It should be noted that the standard morphological classification scheme defined by Hubble mixes elements that depend on the structure of a galaxy (disk-to-bulge ratio, concentration, surface density) with elements related to its recent star formation history (dust-lanes, spiral arm strength). Because it is impractical to classify hundreds of thousands of galaxies by eye, studies of galaxy morphology in the SDSS have focused on simple structural parameters that can be measured automatically for very large numbers of objects. In section 2, we defined two such parameters: the concentration index and the stellar surface mass density .
In Fig. 4, we compare the surface mass density distributions of AGN hosts to those of ordinary early-type and late-type galaxies. We show results for four different ranges in . We have separated early-type galaxies from late-types at a index of 2.6. As shown in Fig. 2, this is where there is a pronounced ”jump” from a population of galaxies with predominantly young stellar populations to a population with mainly old stars. Fig. 4 shows that the surface density distributions of AGN host galaxies strongly resemble those of early-type galaxies of the same stellar mass.

6 The AGN-Starburst Connection
6.1 Diagnostics of Young Stars
For young massive stars, the strongest spectral features with the greatest diagnostic power lie in the vacuum ultraviolet regime between the Lyman break and 2000 Å (e.g. Leitherer et al. 1999; de Mello et al. 2000). These include the strong stellar wind lines of the OVI, NV, SiIV, and CIV resonance transitions and a host of weaker stellar photospheric lines. Most of the photospheric lines arise from highly-excited states and their stellar origin is unambiguous. While resonance absorption lines may have an interstellar origin, the characteristic widths of the stellar wind profiles make them robust indicators of the presence of massive stars. Unfortunately, observations in this spectral regime are difficult. Only a handful of local type 2 Seyferts and LINERs have nuclear UV fluxes that are high enough to enable a spectroscopic investigation. While this small sample may not be representative, the available data firmly establish the presence of a dominant population of young stars (Heckman et al. 1997; González Delgado et al. 1998; Maoz et al.1998; Colina & Arribas 1999).
While the optical spectral window is far more accessible, the available diagnostic features of massive stars are weaker and less easy to interpret. Old stars are cool and have many strong spectral features in the optical due to molecules and low-ionization metallic species. Hot young stars have relatively featureless optical spectra. Thus, the spectroscopic impact of the presence of young stars is mostly an indirect one: as they contribute an increasing fraction of the light (as the luminosity-weighted mean stellar age decreases) most of the strongest spectral features in the optical weaken. This effect is easy to measure. Unfortunately, the effect of adding “featureless” nonstellar continuum from an AGN and young starlight will be similar in this regard.
The strongest optical absorption lines from young stars are the Balmer lines. These reach peak strength in early A-type stars, and so they are most sensitive to a stellar population with an age of 100 Myr to 1 Gyr (e.g. González Delgado et al. 1998). Thus, the Balmer lines do not uniquely trace the youngest stellar population. On the plus side, they can be used to characterize past bursts of star formation (e.g Dressler & Gunn 1983; Kauffmann et al 2003a).
In the near-IR, red supergiants will contribute significantly to the light from young stellar populations. The spectral features produced by red supergiants are qualitatively similar to those produced by red giants that dominate the near-IR light in an old stellar population. A robust method to determine whether old giants or young supergiants dominate is to measure the M/L ratio in the near-IR using the stellar velocity dispersion. So far this technique has been applied to only a small sample, but the results are tantalizing (Oliva et al. 1999; Schinnerer et al. 2003). Another way of diagnosing the presence of young stars is to make use of spectral information in both the optical and the near-IR. In an old stellar population, cool stars dominate and so the associated metallic and molecular spectral features are strong in both bands. In contrast, the optical (near-IR) continuum in a young stellar population will be dominated by hot main sequence stars (cool supergiants). The metallic/molecular lines are therefore weak in the optical and strong in the near-IR. This combination of properties provided some of the first direct evidence for a young stellar population in AGN (Terlevich et al. 1990; Nelson & Whittle 1999).
6.2 Young Stars in Active Galactic Nuclei: background
Spectroscopy of the nearest AGN affords the opportunity to study the starburst-AGN connection on small physical scales ( a few pc). The drawback is that the nearest AGN have low-luminosities, and we might expect that the amount of star formation associated with black-hole fueling would scale in some way with AGN power. To get a complete picture it is thus important to examine both the nearest AGN and more powerful AGN.
The earliest investigation of the stellar population for a moderately large sample of the nearest AGN was by Heckman (1980a,b), who discussed 30 LINERs found in a survey of a sample of 90 optically-bright galaxies. The typical projected radius of the spectroscopic aperture was 200 pc. The spectra covered the range from 3500 to 5300 Å. LINERs were primarily found in galaxies of early Hubble type (E through Sb). Based on the strengths of the stellar metallic lines and the Balmer lines, the nuclear continuum was dominated by old stars in about 3/4 of the LINERs, while a contribution of younger stars was clearly present in the remainder. Typical luminosities of the [OIII]5007 and H NLR emission lines were to .
Ho, Filippenko, & Sargent (2003) recently examined the nuclear (typical radius pc) stellar population in a complete sample of 500 bright, nearby galaxies (of which 43% contain an AGN). The larger sample size and improved treatment of the emission lines allowed Ho et al. to study statistically-significant samples of low-luminosity LINERs, type 2 Seyferts, and Transition nuclei and to span a larger range in AGN luminosity ( to ). The disadvantage of these spectra is that they did not extend shortward of 4230 Å and so they missed the H and higher-order Balmer lines that most effectively probe young stars. Nevertheless, their results are qualitatively consistent with Heckman (1980a,b). Cid Fernandes et al. (2004) have analyzed the near-UV spectra of 51 low luminosity AGN from the Ho, Filippenko, & Sargent (2003) sample. The found that strong Balmer absorption lines are present in about half of the Transition nuclei but in only about 10% of the LINERs. A similar result was obtained by González Delgado et al. (2004) for 28 AGN from the same sample, but using HST to probe the stellar population within radii of tens of pc from the black hole. These results are consistent with the idea that in the Transition nuclei both young stars and an AGN contribute to the ionization of the emission-line gas.
It was recognized very early-on (e.g. Koski 1978) that the optical spectra of powerful type 2 Seyfert nuclei could not be explained purely by an old stellar population. An additional “featureless continuum” that typically produced 10% to 50% of the optical continuum was present. Until relatively recently, it was tacitly assumed that this component was light from the AGN (plausibly light from the hidden type 1 Seyfert nucleus that had been reflected into our line-of-sight by free electrons and/or dust). However, a detailed spectropolarimetric investigation by Tran (1995) and related arguments by Cid Fernandes & Terlevich (1995) and Heckman et al. (1995) showed that young stars were the majority contributors. These results have been confirmed by several major optical spectroscopic investigations of moderately large samples of type 2 Seyfert nuclei (Schmitt, Storchi-Bergmann, & Cid Fernandes 1999; González Delgado, Heckman, & Leitherer 2001; Cid Fernandes et al. 2001; Joguet et al. 2001). The principal conclusion is that a young ( Gyr) stellar population is clearly present in about half of the Seyfert 2 nuclei. Cid Fernandes et al. (2001) found that the fraction of nuclei with young stars is 60% when . They also found that the “young” Seyfert 2 nuclei were hosted by galaxies with much larger far-IR luminosities than the “old” nuclei, suggesting that the global star formation rate was higher.
6.3 Results from SDSS
One of the great advantages of studying the properties of AGN in the SDSS is that one can compare the results for AGN hosts with those derived for “normal” galaxies in a very precise way. In Fig. 4, we showed that AGN occupy host galaxies with structural properties similar to ordinary early-type galaxies. The properties of the stellar populations of normal galaxies are known to correlate strongly with morphological type. Early-type galaxies have old stellar populations and very little gas and dust, whereas there is usually plenty of ongoing star formation in late-type galaxies. In Fig. 5, we compare the Dn(4000) distributions of AGN hosts with ‘normal’ early-type () and late-type () galaxies. This plot reaches a rather different conclusion to Fig. 4: the Dn(4000) distributions of weak AGN resemble those of early-type galaxies, but that strong AGN have stellar ages similar to those of late-type galaxies. One interpretation of these results is that powerful AGN reside in early-type galaxies that are undergoing or have recently undergone a transient star-forming event (starburst). The magnitude of this event might plausibly scale with AGN luminosity, so that its effects on the stellar population and structural parameters are most pronounced in the hosts of strong AGN. If this hypothesis is correct, then we ought to see evidence that the star formation timescales in high luminosity AGN are short.
Strong H absorption arises in galaxies that experienced a burst of star formation that ended Gyr ago. As discussed in Kauffmann et al (2003a), the location of galaxies in the Dn(4000)/H plane is a powerful diagnostic of whether they have been forming stars continuously or in bursts over the past 1-2 Gyr. Galaxies with continuous star formation histories occupy a very narrow strip in this plane. A recent burst is required in order to obtain significant displacement away from this locus. In Fig. 6 we plot the fraction of AGN with H values that are displaced by more than 3 above the locus of continuous models as a a function of [OIII] luminosity. This fraction increases from several percent for the weakest AGN to nearly a quarter for the strongest. The corresponding value of for the sample of normal massive galaxies is only 0.07. For normal massive galaxies with ‘young’ stellar populations (Dn(4000)), .


As discussed above, most previous studies of the stellar populations of type 2 AGN hosts have focused on the nuclear regions of the host galaxies. We obtain qualitatively similar trends in mean stellar age as a function of AGN luminosity to these previous studies, but we find that a higher fraction of AGN with [OIII] luminosities greater than contain young stellar populations. One might thus speculate that there might be systematic radial gradients in the stellar populations of the host galaxies of these systems. We have tested this by splitting our sample into different bins in normalized distance . We then find that there are rather strong radial gradients in mean stellar age and that the youngest stars appear to be located well outside the nuclei of the host galaxies.
7 Towards a Physical Interpretation
In the previous section, we showed that there is a strong correlation of age-sensitive stellar absorption indices with AGN luminosity. Only AGN with the weakest [OIII] emission have stellar ages in the range that is normal for early-type galaxies (Dn(4000) and H 1) (Fig. 7) Our results are tantalizing in that they show that AGN activity and star formation are closely linked in galaxies. In this section we attempt to take our analysis one step further and study the relation between star formation and accretion onto black holes in a more quantitative way.

In order to do this, we need to be able to transform from observed quantities such as 4000 Å break strength, galaxy mass or velocity dispersion, and [OIII] luminosity to physical quantities, such as star formation rate, black hole mass and black hole accretion rate. We have made the following assumptions:
-
1.
We have used the luminosity of the [OIII]5007 emission line to derive an estimate of the AGN luminosity, assuming that the bolometric correction for the [OIII] luminosity is the same as that determined for Type 1 AGN. This approach is motivated by the unified model for AGN, and has been empirically validated in the literature. (Note that we do not correct the [OIII] line for extinction when we derive the bolometric correction. We will use the notation to differentiate this “raw” [OIII] luminosity from the extinction-corrected [OIII] luminosity, which we denote L[OIII].) We have used the extensive SDSS samples of type 1 Seyfert nuclei and low-redshift quasars described in Zakamska et al. (2003) and Kauffmann et al (2003c) to derive an average ratio 320 (where is the monochromatic continuum luminosity at 5000 Å rest-frame). We obtain a very similar result using a lower redshift sample of type 1 Seyfert nuclei ( 0.03) compiled by Dahari & De Robertis (1988). The mean type 1 AGN spectral energy distribution in Marconi et al. (2004) then yields corresponding bolometric corrections 3500.
-
2.
We have calculated black hole accretion rates for an assumed radiative efficiency of 10%.
-
3.
We have used the stellar velocity dispersion measured within the central (typically 3 to 10 kpc) region to estimate the black hole mass, using the relation of Tremaine et al. (2002). We only derive black hole masses for bulge-dominated galaxies with kpc-2.
-
4.
We have used the methodology described in Brinchmann et al (2004) to derive star formation rates for the galaxies and AGN in our sample. In the region sampled by the spectroscopic fiber, star formation rates for non-AGN are estimated using extinction-corrected Balmer emission lines. Star formation rates for AGN are derived using the tight correlation between and specific star-formation rate that is observed for normal galaxies. The correction from SFR inside the fibre to total star formation rates is made using the and colors of the galaxies in the region outside the fiber. We remind reader that the projected fiber diameter ranges from a few to ten kpc and typically encloses 20 to 50% of the light.
-
5.
We have considered only Type 2 (narrow line) AGN in which the intense radiation from the central accretion disk is completely obscured along our line-of-sight. The effect of the missing Type 1 AGN is relatively small (factor of 2) for our overall global assessments.
7.1 Which Black Holes are Growing?
Because powerful AGN are rare and the timescale over which black holes accrete most of their mass is likely to be considerably shorter than the timescale over which the surrounding galaxy forms its stars, it is more meaningful to work with volume-averaged quantities than to present results for individual AGN.
In Fig. 8 , we plot the ratio of the integrated luminosity in AGN to the integrated black hole mass as a function of . This figure shows that most of the present-day accretion is occurring onto black holes with few . Above this mass, the integrated per unit drops dramatically. If we convert into a mass accretion rate using the relations described above, we find that low mass black holes ( few ) have a growth time of Gyr, or around 2-3 times the age of the Universe. For more massive black holes (), the growth timescales quickly increase to orders of magnitude larger than the Hubble time. This indicates that massive black holes must have formed at significantly higher redshifts are they are currently experiencing very little additional growth.
As well as looking at the integrated accretion onto black holes of given mass, it is also interesting to study the distribution of accretion rates in these systems. This is shown in Fig. 9. We normalize the accretion rate by dividing by the Eddington rate for each object. The left panel shows the cumulative fraction of black holes that are accreting above a given rate. Results are shown for different ranges in black hole mass, with mass increasing from the solid curve on the right () to the dotted curve on the left () by a factor of 3 in each case. Fig. 9 shows that the accretion rate functions cut off fairly neatly at . This gives us confidence that our conversions from to accretion rate and from to black hole mass are yielding reasonable answers. There are more low mass black holes than high mass black holes with very large accretion rates near the Eddington limit. Roughly 0.5 percent of black holes with are accreting above a tenth Eddington of the Eddington limit. For black holes with , the fraction accreting above a tenth Eddington has dropped to .
The right panel shows the cumulative fraction of the accreted mass as a function of . Results are shown for low mass black holes with (solid) and for high mass black holes with (dashed). As can be seen, most of the black hole growth is occurring in the most luminous AGN. For low mass black holes, 50 % of the growth occurs in AGN that are within a factor of 5 of the Eddington luminosity. For high mass black holes, half of the present-day growth occurs in AGN that are radiating above % Eddington. Yu & Tremaine (2002) have shown that the mass density in black holes estimated from integrating the luminosity function of quasars over all cosmic epochs agrees rather well with the total mass density in black holes in galaxies at the present day. Their analysis did not include low-luminosity or type 2 AGN and it has thus been something of a puzzle why these two estimates of black hole mass density should agree so well. Our analysis demonstrates that although low-luminosity AGN are numerous, their contribution to the growth of black holes is not dominant.


7.2 Where are Black Holes Growing?
In Fig. 10, we plot the fraction of the integrated luminosity from AGN as a function of stellar mass , stellar surface mass density , concentration index and 4000 Å break strength Dn(4000). Fig. 10 shows that most of the present-day accretion is taking place in galaxies with young stellar ages (Dn(4000)), intermediate stellar masses ( -few ), high surface mass densities ( kpc-2), and intermediate concentrations (). It is quite remarkable that the emission peaks just beyond the the transition values of , and where galaxies appear to undergo a rapid change from young, star-forming and disk-dominated to old, quiescent and bulge-dominated (see Figures 1 and 2).

7.3 Bulge building: the relation between star formation and accretion onto black holes
We have shown that low mass black holes are currently “forming” on a timescale that is comparable to the age of the Universe. If the very tight relation between black hole mass and bulge mass is to be understood, it follows that the host bulges of these systems must also be “forming” at a comparable rate.
In Fig. 11, we plot the ratio of the volume-averaged star formation rate in galaxies to the volume-averaged accretion rate onto black holes traced by in AGN. The thick black line shows what is obtained if one only considers the SFR inside the SDSS fiber aperture. The thin black line shows the result using our estimates of total SFR. We have chosen to plot SFR/ as a function of black hole mass and surface mass density . From Fig. 11 it is clear that black hole growth is closely linked to star formation in the bulge. At low values of characteristic of disk-dominated galaxies, the ratio of SFR/ rises steeply. This is because very few of these galaxies host AGN, but there is plenty of star formation taking place in galaxy disks. At values of above kpc -2 , SFR/ remains roughly constant. Moreover, it has a value , which is in excellent agreement with the empirically-derived relation between black hole mass and bulge mass (Marconi & Hunt 2003). Given the uncertainties in the bolometric correction, in the conversion from to black hole accretion rate and in the estmate of SFR in our AGN, we find it remarkable that SFR/ comes out within a factor of a few of the value that is expected from the – relation.

8 Discussion
Our results demonstrate that the volume-averaged growth of black holes through accretion and the volume-averaged growth of galaxy bulges through star formation remain coupled at the present time. It is therefore likely that the processes that established the tight correlation between bulge mass and black hole mass in present-day galaxies are still operating in low redshift AGN.
We have also demonstrated that the growth time of low mass black holes () derived from the ratio of the mass density in black holes to the present-day black hole accretion rate is short (several Hubble times). By contrast, massive black holes have very long growth times. On average, they are accreting at a rate that is several orders-of-magnitude lower than their past averaged one. This population evidently formed early on and has evolved little since then.
Our results thus lead to a picture in which both star formation and black hole growth in galaxies has been steadily moving to lower and lower mass scales since a redshift of 2. Deep surveys that probe the evolution of the AGN and galaxy populations (Cowie et al 1996; Ueda et al. 2003; Steffen et al 2003) have provided direct evidence for this process, which was first dubbed “cosmic downsizing” by Cowie et al. With the superb statistics provided by the SDSS we have been able to document the consequences of downsizing at the present epoch.
It is particularly intriguing that the majority of black hole growth is occurring in galaxies lying just above the values of galaxy mass, density, and concentration where the galaxy population abruptly transitions from low density, disk-dominated systems with ample ongoing star formation to dense, bulge-dominated systems with little on-going star-formation. This may imply that AGN today occur in a in a narrow “habitable zone” with a precipice to the low mass side (no black holes) and an on-coming famine at higher masses (no cold interstellar gas for fuel).
Kauffmann et al. (2004) have speculated that the observed trends in galaxy properties as a function of density can help us understand how galaxies evolve as a function of cosmic time. According to the standard cosmological paradigm , structure in the present-day Universe formed through a process of hierarchical clustering, with small structures merging to form progressively larger ones. The theory predicts that density fluctuations on galaxy scales collapsed earlier in regions that are currently overdense. Galaxies in high density regions of the Universe such as galaxy clusters are thus more ‘evolved’ than galaxies in low density regions or voids.
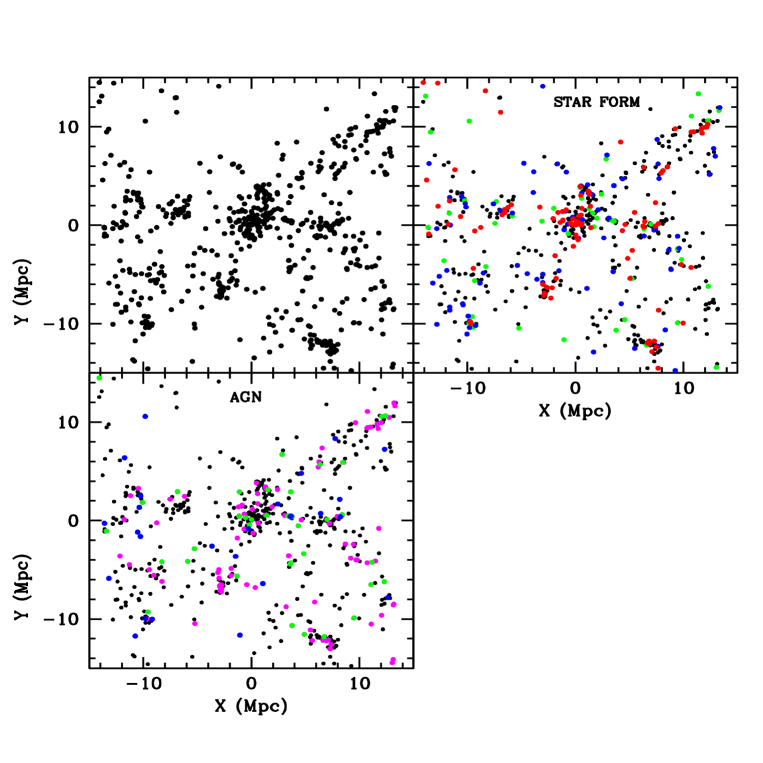
Fig. 12 shows an example of a rich system of galaxy groups at z=0.05 as surveyed by the Sloan Digital Sky Survey. We have placed the origin of our x-and y–axes at the centre of the largest group in the field, which has a velocity dispersion of km s-1. We plot a ‘slice’ that includes all galaxies with within 500 km s-1 of the brightest galaxy in the group. The structures shown in Fig. 12 occupy a relatively thin sheet that is aligned perpendicular to the line-of-sight. As can be seen, the densest structures in the sheet appear to be arranged along filaments that extend over scales of several tens of Mpc.
The top left panel in Fig. 12 shows the distribution of all the galaxies in the slice with spectroscopic redshifts. In the top right panel we have colour-coded galaxies with according to their measured 4000 Å break strengths. Red indicates galaxies with Dn(4000), green is for galaxies with Dn(4000), and blue is for galaxies with Dn(4000). As can be seen, the mean stellar ages of galaxies are very strongly correlated with local density. In the bottom panel we have colour-coded galaxies with detected AGN according to their measured [OIII] line luminosities. The qualitative picture is very similar. AGN with high values of L[OIII] are found predominantly in low-density regions, while low-luminosity AGN are also found in denser groups. Note that no AGN are found near the very center of the most massive group in the field.
These results again suggest that the cosmic evolution of star formation and of AGN activity in the Universe are inextricably linked. What remains to be understood is whether the AGN are responsible for active star formation passing from massive galaxies at high redshifts to low mass galaxies at the present day, or whether AGN have simply responded to changes in their host galaxies and have no ultimate control over their evolution.
Funding for the creation and distribution of the SDSS Archive has been provided by the Alfred P. Sloan Foundation, the Participating Institutions, the National Aeronautics and Space Administration, the National Science Foundation, the U.S. Department of Energy, the Japanese Monbukagakusho, and the Max Planck Society. The SDSS Web site is http://www.sdss.org/.
The SDSS is managed by the Astrophysical Research Consortium (ARC) for the Participating Institutions. The Participating Institutions are The University of Chicago, Fermilab, the Institute for Advanced Study, the Japan Participation Group, The Johns Hopkins University, Los Alamos National Laboratory, the Max-Planck-Institute for Astronomy (MPIA), the Max-Planck-Institute for Astrophysics (MPA), New Mexico State University, University of Pittsburgh, Princeton University, the United States Naval Observatory, and the University of Washington.
References
Abazaijan, K. et al, 2003, AJ, 126, 2081
Antonucci, R. 1993, ARA&A,31, 473
Baldwin, J., Phillips, M. & Terlevich, R. 1981, PASP, 93, 5
Balogh, M., Morris, S., Yee, H., Carlberg, R., & Ellingson, E. 1999, ApJ, 527, 54
Blanton, M.R. et al, 2003a, ApJ, 594, 186
Blanton, M.R., Lupton, R.H., Maley, F.M., Young, N., Zehavi, I., Loveday, J. 2003b, AJ, 125, 2276
Boyle, B.J., Shanks, T., Croom, S.M., Smith, R.J., Miller, L., Loaring, N. & Heymans, C., 2000, MNRAS, 317, 1014 308, 77
Brinchmann, J., Charlot, S., White, S.D.M., Tremonti, C., Kauffmann, G., Heckman, T.M., Brinkmann, J., 2003, MNRAS, submitted (astro-ph/0311060)
Bruzual, G., Charlot, S., 2003, MNRAS, 344, 1000
Budavari, T., et al, 2003, ApJ, 595, 59
Cattaneo, A., Haehnelt, M. & Ress, M.J. 1999, MNRAS, 308, 77
Cid Fernandes, R. & Terlevich, R. 1995, MNRAS, 272, 423
Cid Fernandes, R., Heckman, T., Schmitt, H., González Delgado, R., & Storchi-Bergmann, T. 2001, ApJ, 558, 81
Cid Fernandes, R., González-Delgado, R., Schmitt, H., Storchi-Bergmann, T., Martins, L.P., Perez, E., Heckman, T.M., Leitherer, C., Schaerer, D., 2004, ApJ, in press (astro-ph/0401416)
Colina, L., & Arribas, S. 1999, ApJ, 514, 637
Cowie, L.L., Songaila, A., Hu, E.M. and Cohem, J.G. 1996, AJ, 112, 839
Dahari,O. & Robertis, M.M. 1988, ApJ, 331, 727
de Mello, D., Leitherer, C., & Heckman, T. 2000, ApJ, 530, 251
Dressler, A., & Gunn, J. 1983, ApJ, 270, 7
Elvis, M. et al. 1994, ApJS , 95, 1
Fan, X. et al. 2001, AJ, 121, 31
Ferrarese, L. & Merritt,D. 2000, ApJ, 539, L9
Fukugita, M., Ichikawa, T., Gunn, J.E., Doi, M., Shimasaku, K., Schneider, D.P. 1996, AJ, 111, 1748
Gebhardt, K. et al 2000, ApJ , 543, L5
Genzel, R., Pichon, C., Eckart, A., Gerhard, O.E., & Ott, T. 2000, MNRAS, 317, 348
González Delgado, R., Heckman, T., Leitherer, C., Meurer, G., Krolik, J., Wilson, A., Kinney, A., & Koratkar, A. 1998, ApJ, 505, 174
González Delgado, R., Heckman, T., & Leitherer, C. 2001, ApJ, 546, 845
González Delgado, R., Cid Fernandez, R., Perez, E., Martins, L.P., Storchi-Bergmann, T., Schmitt, H., Heckman, T.M., Leitherer, C., 2004, ApJ, in press (astro-ph/0401414)
Granato, G.L., Silva, L., Monaco, P., Panuzzo, P., Salucci, P., De Zotti, G. & Danese, L 2001, MNRAS, 324, 757
Gunn, J., Carr, M., Rockosi, C., Sekiguchi, M., Berry, K., Elms, B., de Haas, E., Ivezić, Z. et al. 1998, ApJ, 116, 3040
Heckman, T.M. 1980a, A&A , 87, 142
Heckman, T.M. 1980b, A&A , 87, 152
Heckman, T.M. et al. 1995, ApJ, 452, 549
Heckman, T.M., González Delgado, R., Leitherer, C., Meurer, G., Krolik, J., Wilson, A., Koratkar, A., & Kinney, A. 1997, ApJ, 482, 114
Heckman, T.M., Kauffmann, G., Brichmann, J., Charlot, S., Tremonti, C., White, S.D.M., 2004, in preparation
Herrnstein,J.R., Moran, J.M.,Greenhill, L.J., Diamond, P.J., Inoue, M., Nakai, N., Miyoshi, M., Henkel, C., & Riess, A. 1999, Nature,400, 539
Hogg, D., Finkbeiner, D., Schlegel, D., & Gunn, J. 2001, AJ, 122, 2129
Ho, L.C., Philippenko, A.V. & Sargent, W.L.W. 1997, ApJS, 112, 315
Ho, L., Fillipenko, A., & Sargent, W. 2003, ApJ, 583, 159
Hubble, E.P., 1926, ApJ, 64, 321
Joguet, B., Kunth, D., Melnick, J., Terlevich, R., & Terlevich, E. 2001, A&A, 380, 19
Koski, A. 1978, ApJ, 223, 56
Kauffmann, G. & Haehenelt, M.G. 2000, MNRAS, 311,576
Kauffmann, G. et al, 2003a, MNRAS, 341, 33 (Paper I)
Kauffmann, G. et al, 2003b, MNRAS, 341, 54 (Paper II)
Kauffmann, G. et al 2003c, MNRAS, 346, 1055
Kauffmann, G. et al, 2004, MNRAS, submitted (astro-ph/0402030)
Kewley, L., Dopita, M., Sutherland, R., Heisler, C. & Trevena, J. 2001, ApJ, 556, 121
Leitherer, C. et al. 1999, ApJS, 123, 3
Lynden-Bell, D. 1969, MNRAS, 143, 167
Madgwick, D.S. et al, 2003, MNRAS, 344, 847
Maoz, D., Koratkar, A., Shields, J., Ho, L., Filippenko, A., & Sternberg, A. 1998, AJ, 116, 55
Marconi, A. & Hunt, L.K., 2003, ApJ, 589, L21
Marconi, A., Risaliti, G., Gilli, R., Hunt, L., Maiolino, R. & Salvati, M. 2004, MNRAS, in press (astro-ph/0311619
Nelson, C. & Whittle, M. 1999, AdSpR, 23, 891
Oliva, E., Origlia, L. Maiolino, R., & Moorwood, A. 1999, A&A , 350, 9
Pier, J.R., Munn, J.A., Hindsley, R.B., Hennessy, G.S., Kent, S.M., Lupton, R.H., Ivezić, Z., 2003, AJ, 125, 1559
Richards, G. et al. 2002, AJ, 123, 2945
Salpeter, E. 1964, ApJ, 140, 796
Schinnerer, E., Colbert, E., Armus, L., Scoville, N., & Heckman, T. 2003, Coevolution of Black Holes and Galaxies, ed. L. C. Ho (Pasadena: Carnegie Observatories, http://www.ociw.edu/ociw/symposia/series/symposium1/proceedings.html
Schmitt, H., Storchi-Bergmann, T., & Cid Fernandes, R. 1999, MNRAS, 303, 173
Smith, J.A., et al 2002, AJ, 123, 2121
Shimasaku, K. et al, 2001, AJ, 122, 1238
Steffen, A.T., Barger, A.J., Cowie, L.L., Mushotsky, R.F. & Yang, Y. 2003, ApJ, 596, L23
Stoughton, C. et al, 2002, AJ, 123, 485
Strateva, I. et al, 2001, AJ, 122, 1861
Strauss, M., et al 2002, AJ, 124, 1810
Terlevich, E., Díaz, A., & Terlevich, R. 1990, MNRAS, 242, 271
Tran, H. 1995, ApJ, 440, 597
Tremaine, S. et al. 2002, ApJ, 574, 740
Ueda,Y., Masayuki, A., Ohta, K. & Miyaji, T. 2003, ApJ, 598, 886
Veilleux, S. & Osterbrock, D. 1987, ApJS, 63, 295
Worthey, G. & Ottaviani, D.L., 1997, ApJS, 111,377
York D.G. et al, 2000, AJ, 120, 1579
Yu, Q. & Tremaine, S. 2002, ApJ, 335, 965
Zakamska, N. et al. 2003, AJ, 126, 2125
Zehavi, I. et al., 2002, ApJ, 571, 172