Waiting in the Wings: Reflected X-ray Emission from the Homunculus Nebula
Abstract
We report the first detection of X-ray emission associated with the Homunculus Nebula which surrounds the supermassive star Carinae. The emission is characterized by a temperature in excess of 100 MK, and is consistent with scattering of the time-delayed X-ray flux associated with the star. The nebular emission is bright in the northwestern lobe and near the central regions of the Homunculus, and fainter in the southeastern lobe. We also report the detection of an unusually broad Fe K fluorescent line, which may indicate fluorescent scattering off the wind of a companion star or some other high velocity outflow. The X-ray Homunculus is the nearest member of the small class of Galactic X-ray reflection nebulae, and the only one in which both the emitting and reflecting sources are distinguishable.
1 Introduction
The Homunculus (Gaviola, 1950) is a young, hollow, expanding bipolar nebula surrounding the extremely luminous and massive star Carinae. It is believed to have a total mass of 2–12 (Smith, Gehrz & Krautter, 1998; Smith et al., 2003a) and was ejected from the star during the “Great Eruption” of Carinae in the 1840 s. At about 100 (Davidson & Humphreys, 1982) Carinae is one of the most massive stars known. It possesses an enormous stellar wind, characterized by a mass loss rate of approximately yr-1, and a wind velocity of about 500 km s-1 (Hillier et al., 2001). Carinae is a strong source of hard X-rays (Seward et al., 1979) and it undergoes a deep X-ray minimum every 5.53 years (Ishibashi et al., 1999; Corcoran et al., 2001) that lasts for about 3 months. It has been suggested (Corcoran et al., 1997; Pittard et al., 1998; Ishibashi et al., 1999; Corcoran et al., 2000) that the variable X-ray emission is produced by the collision of Carinae’s wind with a less dense, faster moving wind from an otherwise hidden companion (though alternative single-star models have been suggested, Davidson 1999). Carinae began its most recent X-ray minimum on June 29, 2003 (Corcoran, 2003) and lasted through September 3, 2003.
A new observation by the CHANDRA X-ray Observatory during Carinae’s recent X-ray intensity minimum has for the first time identified X-ray emission from the Homunculus nebula itself. This emission is at least a factor of four fainter than the direct stellar emission detected during the minimum, and about a factor of 100 fainter than the direct stellar emission outside of the minimum. The emission associated with the Homunculus was not seen previously by CHANDRA or other X-ray observatories since it is hidden by the wings of the instrumentally broadened central source outside of the X-ray minimum. In this paper we report the spectral, spatial and temporal properties of the X-rays from the Homunculus. A more detailed discussion of these data regarding the X-ray emission from Carinae and its surroundings during the X-ray eclipse interval will be presented elsewhere (Corcoran et al.. 2004a, in preparation).
This paper is organized as follows. The observations are presented in §2. The X-ray and optical imaging of Carinae and its surroundings are compared in §3. In §4 we analyze the X-ray spectrum of the Homunculus, and interpret this emission in §5. We discuss spatial and temporal variations of the emission in §6, and present our conclusions in §7.
2 Observations
To help characterize the nature of the X-ray minimum, we planned five observations with the CHANDRA X-ray Observatory before, during and after this event as part of a large, multi-wavelength observing campaign during the summer of 2003. The CHANDRA observations used the Advanced CCD Imaging Spectrometer (ACIS) spectroscopic array (Garmire et al., 2003) plus the High Energy Transmission Gratings (Markert et al., 1994). One observation was obtained on July 20, 2003 (CHANDRA sequence number 200216) when contemporaneous monitoring with the RXTE satellite observatory showed Carinae to be in the middle of its X-ray eclipse111http://lheawww.gsfc.nasa.gov/users/corcoran/eta_car/etacar_rxte_lightcurve/.. The total exposure time was 90,275 seconds. We re-extracted good “Level 2” events from the “Level 1” events file using the CHANDRA Interactive Analysis of Observations (CIAO) software package and the processing steps recommended by the CHANDRA X-ray Center222http://cxc.harvard.edu/ciao/threads/data.html. We included corrections for charge transfer inefficiency (CTI) and destreaking. The effective resolution of the screened photon events file was increased using the algorithm of Tsunemi et al. (2001)333http://cxc.harvard.edu/cont-soft/software/subpixel_resolution.1.4.html.
A followup director’s discretionary time observation with ACIS was obtained on August 28, 2003 (sequence number 200237) in order to confirm the detection of X-ray emission from the Homunculus and to look for changes in the extended emission which might have occurred as the central source brightened. This observation was obtained with Carinae placed on the ACIS S3 chip, though to minimize the exposure time required the gratings were not used. In order to mitigate effects from pileup of the central source we used a sub-array during the observation. The total exposure time of this observation was 18,796 seconds. As above, we re-extracted the level 2 photon events and corrected for CTI, destreaking and improved the spatial resolution using the algorithm of Tsunemi et al. (2001).
3 X-ray and Optical Imaging
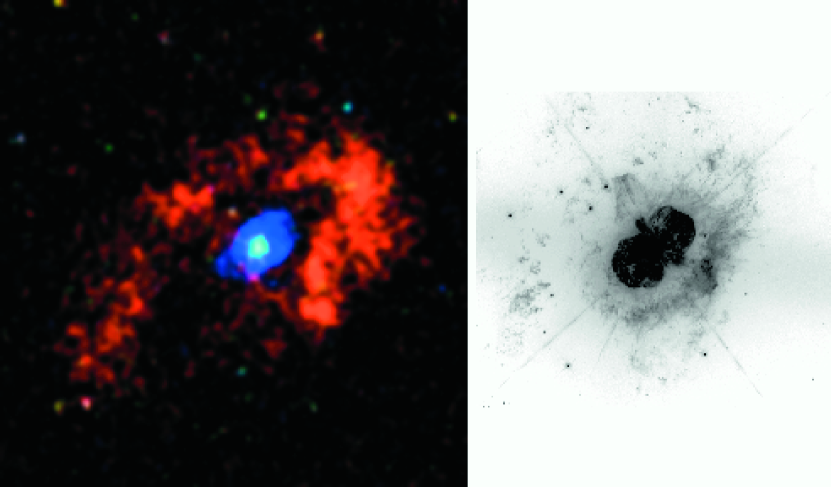
Figure 1 shows the zeroth-order X-ray image of Carinae obtained by the ACIS-S3 CCD. The color coding of the image represents emission from gas at different temperatures: red corresponds to the temperature range 2–15 million degrees (0.2–1.5 keV), green 15–30 million degrees (1.5–3.0 keV), and blue 30–100 million degrees (3–10 keV). Carinae is visible as a blue-white source at the center of the image. As seen previously (Seward et al., 2001), an incomplete elliptical ring or shell of soft X-ray emission (which appears red in figure 1) nearly surrounds Carinae at a distance of about 2.2 light years from the star. An elongated patch of bluish (hard X-ray) emission about in length (about 0.6 light years) is clearly visible in Figure 1 between the star and the outer red shell . This hard emission was probably detected in earlier ACIS observations (Seward et al., 2001; Weis, Corcoran, Bomans, & Davidson, 2004), as a halo of scattered X-rays surrounding the central stellar source; however contamination by X-rays from the bright, heavily piled up central source did not allow this halo to be clearly identified. Figure 1 also shows an HST/WFPC2 image of the nebulae surrounding Carinae, at the same scale and orientation as the X-ray image. Carinae is not visible in the image, which is scaled in intensity to highlight the nebulosities. The hard “blue” emission in the X-ray image and the optical image of the Homunculus show marked similarities in size, shape and orientation.
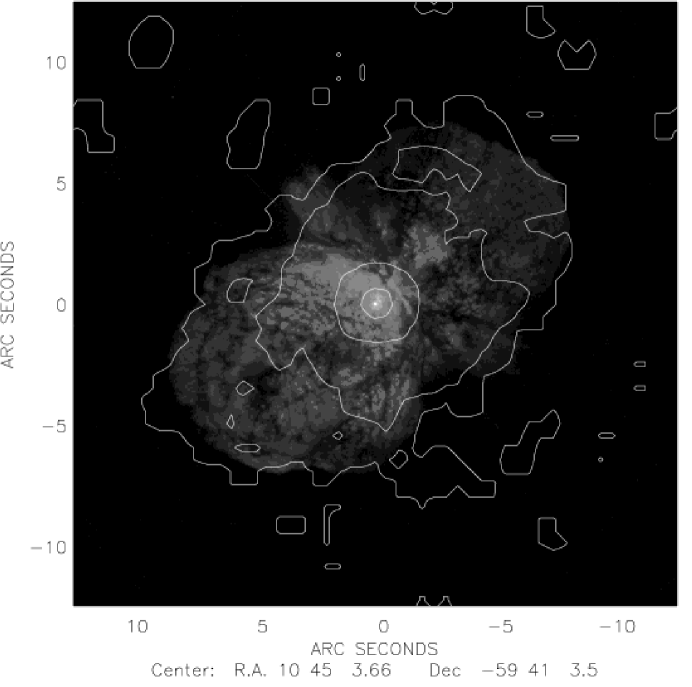
Figure 2 shows an overlay of the 3–8 keV band X-ray contours on an HST image obtained by the Advanced Camera for Surveys (Ford et al., 2003) as part of the HST Carinae “Treasury Project”444http://etacar.umn.edu/. The isophots of the hard emission clearly follow the shape of the Homunculus, and there is very little hard X-ray emission beyond the Homunculus. Figure 3 shows the spatial variation of X-ray surface brightness through the Homunculus for 3 impact parameters, one through the central star and others between 3 and 4 arcseconds on either side of the star. The X-ray brightness is not uniform: the northwest lobe, and regions near the star are apparently brighter than the southeast lobe.
4 X-ray Spectroscopy of the Homunculus
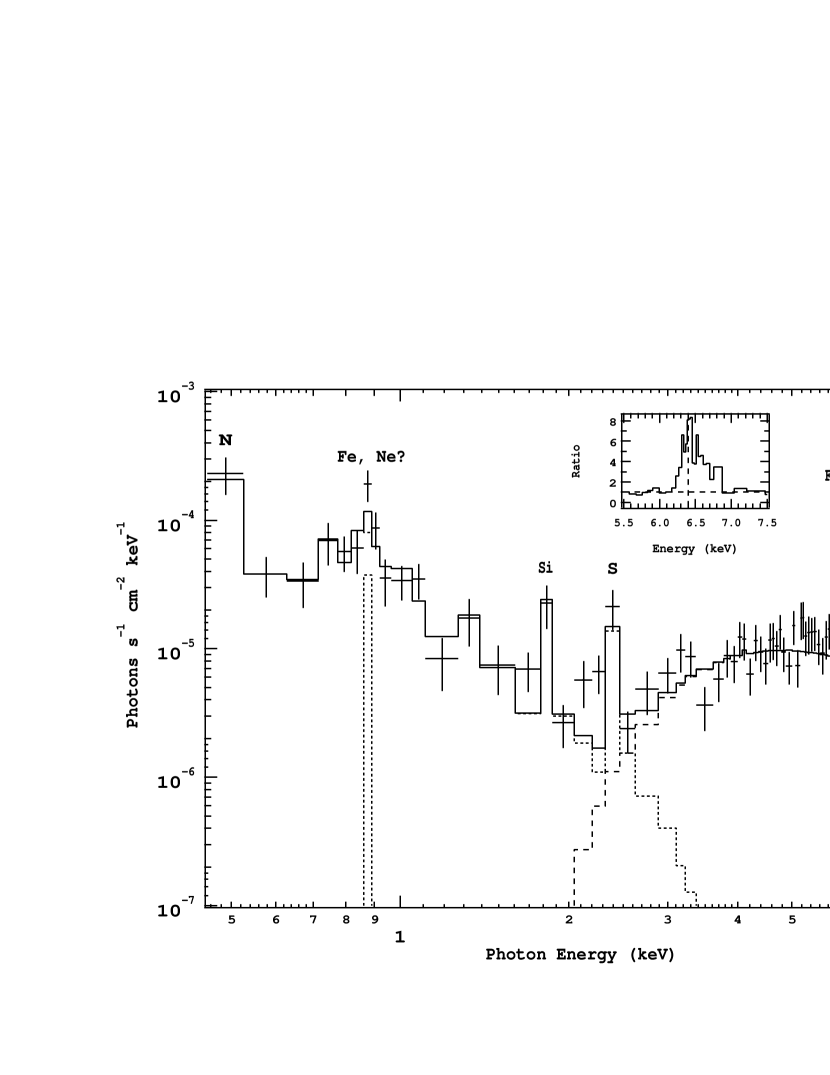
We extracted an X-ray spectrum of the Homunculus from an elliptical region of oriented with the semi-major axis along the polar axis of the Homunculus, excluding emission within 2.5 arcseconds of the star (which should exclude more than 95% of the direct stellar flux) and soft emission from the outer ejecta. The X-ray spectrum of the Homunculus is shown in Figure 4. This spectrum has been corrected for background emission, which was estimated from a source-free region to the northwest of the “red shell”.
4.1 The Thermal Component
We created responses and effective areas for the ACIS observation, and fit the extracted spectrum with a combination of absorbed collisionally-ionized plasma models using the “mekal” model within the XSPEC analysis package (Arnaud, 1996). For simplicity we assumed solar abundances although the composition of material around Carinae is decidedly non-solar. The X-ray emission associated with the Homunculus appears to be dominated by a component with a characteristic temperature of 113 million degrees, along with a weaker, cooler component ( million degrees). Table 1 compares the spectral properties (temperature, column density and luminosities) for the cooler and hotter components of the Homunculus, and the X-ray spectrum extracted from a circle around the central star (corrected for background using the same background region as above).
The hard emission from the Homunculus is strongly absorbed, having an equivalent hydrogen column density ( atoms cm-2, which is about the same as the absorbing column to the star. The absorbing column to the 6.7 million degree component is only atoms cm-2, which is consistent with foreground absorption. An examination of a low-energy X-ray image shows that this emission is clearly associated with the X-ray “bridge” (Weis et al., 2002; Weis, Corcoran, Bomans, & Davidson, 2004) running across the middle of the Homunculus.
4.2 Fluorescent Emission
The strongest feature in the X-ray spectrum of the Homunculus is an iron K-shell line at 6.4 keV, which we have modelled as a Gaussian in Figure 4. The inset in Figure 4 shows the ratio of the observed emission to a simple power law model which describes the continuum emission near the Fe line complex. The 6.4 keV line is produced by fluorescent scattering of X-rays by iron atoms (in either a gaseous phase inside the Homunculus, or locked in solid dust grains). The equivalent width of this iron line is about 1.5 keV, which is about a factor of 5 larger than the equivalent width of the iron fluorescent line seen in the spectrum of the star at times outside of the X-ray minimum. The line is significantly broadened ( keV) corresponding to a Doppler width of about 4700 km s-1. The fluorescent line in the stellar spectrum outside of minimum is consistent with (Corcoran et al., 2001b). The velocity width of the line measured here is much larger than twice the measured expansion velocity of the Homunculus, which is only about 650 km s-1. The line broadening might be indicative of scattering off higher velocity flows in the lobes of the Homunculus. The velocity of Carinae’s wind near the poles of the star has been measured to be km s-1 (Smith et al., 2003b), so that scattering from this material would produce a line broadening of km s-1, still a factor of 2 or more too low. At energies kev, some of the observed broadening is probably due to blending of narrow fluorescent Fe lines from Fe in a range of ionization stages. However, the fluorescent line shows an apparent “red wing” (as seen in the inset in figure 4) extending to keV, which cannot be produced from line blending. Perhaps processes more exotic than simple Doppler broadening are in evidence. For example, Compton scattering can produce a “core” line with low energy “shoulders” (Matt, 2002) though the intensity of the shoulder is expected to be much lower than the intensity of the core, which does not appear to be the case here (though it is conceivable that the line profile is produced by some superposition core lines + Compton shoulders given the complex scattering surfaces in the Homunculus). On the other hand, in systems like low-mass X-ray binaries and active galaxies, the presence of a compact object can give rise to broad Fe K lines with significant red wings due to gravitational redshifts in accretion disks, but there is no strong evidence for the presence of a compact object in the Carinae system. It is perhaps most likely that the red wing is produced by X-ray scattering off neutral iron in the wind of Carinae’s companion star, since the companion’s wind velocity is believed to be km s-1 (Pittard & Corcoran, 2002), and the companion’s wind should be receding from the observer at the time of the CHANDRA observation, based on the orbit presented in Corcoran et al. (2001). However, the companion’s wind should be confined near the orbital plane, while the broad fluorescent line is apparently distributed throughout the entire Homunculus.
5 Interpretation of the X-ray Emission from the Homunculus
The high energy X-ray spectrum of the Homunculus is similar to the hard X-ray emission from Carinae itself in temperature and column density. Such emission could arise from shock-heated gas in the lobes of the Homunculus, but while shocked gas has been observed in (Smith, 2002) and around (Dorland et al., 2003) the lobes, the deduced velocities are too low to produce significant emission at 8 keV. Furthermore, high velocity shocked gas could not exist in the lobes since such shocks are inconsistent with the presence of H2 which is seen in the lobes (Smith, 2002). The high energy X-rays we observe from the Homunculus are instead an X-ray “light echo” in which hard X-ray photons produced in a strong, high-velocity shock near Carinae are reflected to the observer at earth, primarily by Thomson scattering off electrons in the Homunculus. Although the Homunculus contains significant amounts of dust, scattering from dust grains could not produce the Homunculus X-rays since dust scattering is so strongly forward peaked (Predehl & Schmitt, 1995).
The amount of scattering depends approximately on the ratio of the scattering cross section to the mass-weighted geometrical cross section of the lobes. For simplicity we consider the Homunculus as 2 hollow connected spheres with an axis running from the point of contact of the spheres through their centers, and assume that the axis is tilted by to the line of sight, with the northwest lobe tilted away from the observer. Assuming that the composition of the Homunculus is 50% helium and 50% hydrogen, the total number of electrons is roughly and the total Thomson-scattering cross section is cm2, where is the Thomson scattering cross section ( cm2), assuming each lobe contains 6 solar masses (Smith et al., 2003a) as an upper limit. The approximate geometric radius of a lobe is very roughly cm after weighting the lobe by the derived mass distribution (Davidson, et al., 2001). Thus the probability of scattering for an X-ray photon is roughly %. The observed scattering probability is roughly , where is the intensity of the emission reflected from the Homunculus at the time of the CHANDRA observation, and is the intensity of the star at an earlier time , where is the light-travel time between the star and the reflecting surface, days. Monitoring with the RXTE observatory shows, 88 days prior to the CHANDRA observation (April 23, 2003, observation identification 80001-01-54-00, Corcoran et al. 2004b, in preparation), that ergs s-1, so that the observed scattering probability %, in very good agreement with the derivation given above for regions with appreciable light travel times.
6 Spatial and Temporal Variations
Regions of the Homunculus near the star where light travel times are negligible are also X-ray bright. Figure 3 shows that the X-ray emission in the Homunculus on either side of the star is noticeably peaked near the star, though there is much less contrast in surface brightness on either side of the star. This suggests that, in the direction of the low-latitude reflecting surfaces, the stellar source may be substantially brighter than the stellar flux that we see directly, and/or the amount of scattering material in the region near the star may be much higher than the amount of material in the lobes. Another alternative is that there may be substantially more extinction to the X-ray emitting region along our line of sight than in the direction of these reflecting surfaces. In principal some or all of these suggestions may play a role. Detailed analysis of the variation of the surface brightness profiles depends on the time-varying flux from the central source, the real distribution of matter in the lobes, and the amount of material between the star and the reflecting surfaces.
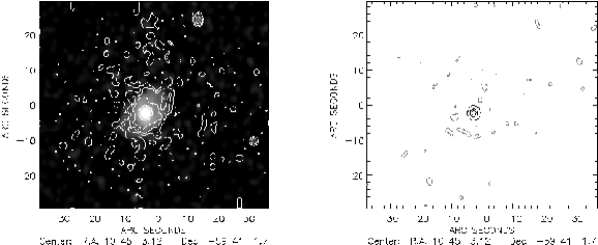
Figure 5 shows a comparison between the ACIS S3 image obtained on August 28 and the HETG+ACIS S3 zeroth order image from the July 20th observation. The images have been exposure corrected. The image on the left shows the August 28 image contours on the July 20th image. Both images are in the 3–8 keV band. The shape and intensity of the emission from the Homunculus is very similar in the two observations. Figure 5 also shows a difference image in which the exposure corrected August 28 image is subtracted from the exposure corrected July 20 image. Contours in gray are negative contours (July 20 brighter than August 28) and black are positive. Though the brightness of the central source has increased substantially between the two observations, there is little change in intensity in the reflected emission from the Homunculus, although there is perhaps some evidence of a fading in the southeastern lobe.
7 Conclusions
We have presented the first clear detection of X-ray emission from the Homunculus nebula around Carinae, and have shown that this emission is consistent with the amount of stellar emission expected to be scattered from the Homunculus accounting for light-travel-time delays. Along with the scattered emission, we note the presence of strong Fe K fluorescent line at 6.4 keV, which is anomalously broad, and which shows emission below 6.4 keV.
The X-ray Homunculus is the nearest member of the small class of Galactic X-ray reflection nebulae (Murakami, Senda, Maeda, & Koyama, 2003), and the only one where both the emitting source and reflector are clearly identified. Variation in the intensity, orientation and spectral shape of the central source will be mirrored by variations in the scattered emission from the Homunculus, and in principle can help define the three-dimensional structure by providing view of the stellar X-ray source from multiple lines of sight, similar to the way in which reflected optical emission provides a latitudinally-dependent view of Carinae itself (Smith et al., 2003b). Continued monitoring of the reflected emission after the star’s X-ray minimum would be especially interesting, since this could provide a measure of the intrinsic X-ray luminosity of the star during the minimum, and could help distinguish an occultation of the X-ray source from variation in the source’s intrinsic X-ray brightness. Additional high spatial resolution observations of the X-ray echo from the Homunculus can help define the three-dimensional structure and variability of the stellar X-ray source. Observations of the reflected emission can also help map out the geometry of the absorbing material between the emitting region and the reflecting surface and allow us to more accurately model this unique system.
References
- Arnaud (1996) Arnaud, K.A., 1996, Astronomical Data Analysis Software and Systems V, eds. Jacoby G. and Barnes J., p17, ASP Conf. Series volume 101.
- Corcoran et al. (1997) Corcoran, M. F., Swank, J. H., Petre, R., Drake, S., & Ishibashi, K. 1997, ASP Conf. Ser. 120: Luminous Blue Variables: Massive Stars in Transition, 267
- Corcoran et al. (2000) Corcoran, M. F., Fredericks, A. C., Petre, R., Swank, J. H., & Drake, S. A., 2000, ApJ, 545, 420
- Corcoran et al. (2001b) Corcoran, M. F., Swank, J. H., Petre, R., Ishibashi, K., Davidson, K., Townsley, L., Smith, R., White, S., Viotti, R., & Damineli, A., 2001b, ApJ, 562, 1031
- Corcoran et al. (2001) Corcoran, M. F., Ishibashi, K., Swank, J. H., & Petre, R. 2001, ApJ, 547, 1034
- Corcoran (2003) Corcoran, M. F., 2003, IAUC 8160, 2
- Damineli (1996) Damineli, A, 1996,ApJ, 460, L49
- Damineli (1997) Damineli, A. 1997, ASP Conf. Ser. 120: Luminous Blue Variables: Massive Stars in Transition, 272
- Davidson, et al. (2001) Davidson, K., Smith, N., Gull, T. R., Ishibashi, K., & Hillier, D. J., 2001, AJ, 121, 1569
- Davidson & Humphreys (1982) Davidson, K. & Humphreys, R. M. 1982, ARA&A, 35, 1
- Davidson (1989) Davidson, K., 1989, Ap&SS, 157, 101
- Davidson et al. (2002) Davidson, K., et al., 2002, Space Telescope Science Newsletter ed. R. Brown, Spring, 1
- Davidson (1999) Davidson, K., 1999, Astronomical Society of the Pacific Conf. Ser. 179, 304
- Dorland et al. (2003) Dorland, B. N., Currie, D. G., Kaufer, A., & Bacciotti, F. 2003, Revista Mexicana de Astronomia y Astrofisica Conference Series, 15, 70
- Ford et al. (2003) Ford, H. C., et al., 2003, Proc. of the SPIE 4854, 81
- Garmire et al. (2003) Garmire, G. P., Bautz, M. W., Ford, P. G., Nousek, J. A., & Ricker, G. R., Jr., 2003, Proc. of the SPIE 4851, 28-44
- Gaviola (1950) Gaviola, E., 1950, ApJ, 111, 408
- Hillier et al. (2001) Hillier, D. John, Davidson, K., Ishibashi, K., & Gull, T., 2001, ApJ, 553, 837
- Ishibashi et al. (1999) Ishibashi, K., Corcoran, M. F., Davidson, K., Swank, J. H., Petre, R., Drake, S. A., Damineli, A., & White, S,1999,ApJ, 524, 983
- Markert et al. (1994) Markert, T. H., Canizares, C. R., Dewey, D., McGuirk, M., Pak, C. S., & Schattenburg, M. L., 1994, Proc. of the SPIE 2280, 168
- Matt (2002) Matt, G. 2002, MNRAS, 337, 147
- Murakami, Senda, Maeda, & Koyama (2003) Murakami, H., Senda, A., Maeda, Y., & Koyama, K. 2003, ASP Conf. Ser. 289: The Proceedings of the IAU 8th Asian-Pacific Regional Meeting, Volume I, 175
- Pittard & Corcoran (2002) Pittard, J. M. & Corcoran, M. F. 2002, A&A, 383, 636
- Pittard et al. (1998) Pittard, J. M., Stevens, I. R., Corcoran, M. F., & Ishibashi, K., 1998, MNRAS, 299, L5
- Predehl & Schmitt (1995) Predehl, P. & Schmitt, J. H. M. M., A&A, 293, 889
- Seward et al. (1979) Seward, F. D., Forman, W. R., Giacconi, R., Griffiths, R. E., Harnden, F. R., Jones, C., & Pye, J. P. 1979, ApJ, 234, L55
- Seward et al. (2001) Seward, F. D., Butt, Y. M., Karovska, M., Prestwich, A., Schlegel, E. M., & Corcoran, M. 2001, ApJ, 553, 832
- Smith (2002) Smith, N., 2002, MNRAS, 337, 1252
- Smith, Gehrz & Krautter (1998) Smith, N., Gehrz, R. D., & Krautter, J. 1998, AJ, 116, 1332
- Smith et al. (2003a) Smith, N., Gehrz, R. D., Hinz, P. M., Hoffmann, W. F., Hora, J. L., Mamajek, E. E., & Meyer, M. R., 2003a, AJ, 125, 1458
- Smith et al. (2003b) Smith, N., Davidson, K., Gull, T. R., Ishibashi, K., & Hillier, D. J., 2003b, ApJ, 586, 432
- Smith et al. (2004) Smith, N., et al., 2004, ApJ, 605, 405
- Tsunemi et al. (2001) Tsunemi, H., Mori, K., Miyata, E., Baluta, C., Burrows, D. N., Garmire, G. P., & Chartas, G. 2001, ApJ, 554, 496
- Weis et al. (2002) Weis, K., Corcoran, M. F., & Davidson, K., 2002,ASP Conf. Ser., 262, 275
- Weis, Corcoran, Bomans, & Davidson (2004) Weis, K., Corcoran, M. F., Bomans, D. J., & Davidson, K. 2004, A&A, 415, 595
- Weisskopf et al. (2000) Weisskopf, M. C., Tananbaum, H. D., Van Speybroeck, L. P., & O’Dell, S. L., 2000, Proc. of the SPIE 4012, 2
- Weisskopf, O’dell & van Speybroeck (1996) Weisskopf, M. C., O’dell, S. L., & van Speybroeck, L. P., 1996, Proc.of the SPIE 2805, 2

| Component | Temperature | Column Density | aaObserved luminosity in the 0.5–10 keV band, assuming the distance to Carinae is 2300 pc (Hillier et al., 2001). | bbAbsorption corrected luminosity in the 2–10 keV band |
|---|---|---|---|---|
| ( K) | ( cm-2) | ( ergs s-1) | ( ergs s-1) | |
| Homunculus (soft) | 19.8 | |||
| Homunculus (hard) | 113 | |||
| star | 311.4 |