SPI observations of positron annihilation radiation from the 4th galactic quadrant: sky distribution
Abstract
During its first year in orbit the INTEGRAL observatory performed deep exposures of the Galactic Center region and scanning observations of the Galactic plane. We report on the status of our analysis of the positron annihilation radiation from the 4th Galactic quadrant with the spectrometer SPI, focusing on the sky distribution of the 511 keV line emission. The analysis methods are described; current constraints and limits on the Galactic bulge emission and the bulge-to-disk ratio are presented.
keywords:
gamma-ray observations; positron annihilation line; Galactic Center region1 Introduction
The cosmic positron annihilation radiation was first detected through its hallmark, a gamma-ray line at 511 keV, in balloon observations of the Galactic Center (GC) region in the 1970s and has been the focus of intense scrutiny by a large number of balloon and satellite borne experiments ever since (e.g. Harris, 1997). Despite this tremendous effort, the origin of the positrons is still far from being understood. A large variety of positron sources and production mechanisms have been proposed over the years (e.g. Chan & Lingenfelter, 1993). Among the more promising source candidates are the nucleosynthesis products from supernovae. More recently, hypernovae/GRBs (Cassé et al., 2004) and the annihilation of dark matter (e.g. Boehm et al., 2004) have been revisited. Another intriguing candidate source of positrons comprises compact objects.
Investigations of the sky distribution of the annihilation radiation promise to provide clues for identifying the source(s) of positrons in our Galaxy, despite the fact that positrons may travel from their source before annihilating. The annihilation radiation was mapped for the first time with the OSSE instrument on board the Compton Gamma-Ray Observatory (e.g. Purcell et al., 1997; Milne et al., 2001). At least two extended spatial components, a (possibly dominant) extended bulge and a disk, are required to account for the observed annihilation emission. Early OSSE maps showed tantalizing evidence for a third emission component (the so-called positive latitude enhancement, PLE) located about north of the GC (Purcell et al., 1997); however, the final analysis did not corroborate this (Milne et al., 2001) and its (astrophysical and/or instrumental) origin remains uncertain (von Ballmoos et al., 2003).
Modelling of the Galactic distribution of the 511 keV line emission from OSSE data suggests FWHM values of about when using Gaussians to describe the bulge component. No significant offset from the GC was found by Purcell et al. (1997) or Milne et al. (2001). However, Tueller et al. (1996), using OSSE observations with the long axis of the collimator perpendicular to the Galactic plane to produce a maximum sensitivity scan in longitude, derived a significant () offset of the 511 keV line emission. Analyzing data from the wide field-of-view TGRS instrument, Harris et al. (1998) obtained a rather extended distribution (FWHM ) with no significant offset from the GC. Before SPI, OSSE was the only instrument that allowed the bulge-to-disk ratio (hereafter B/D) to be constrained, albeit poorly, to a range of 0.2 – 3.3. This parameter is important for characterizing the Galactic distribution of the emission and - potentially - of positron sources. A major uncertainty in the determination of B/D is the possible existence of an extended (halo) component to the bulge, which would lead to a large ratio. Using OSSE, Milne et al. (2000) could determine the total 511 keV line flux from their model Galaxy relatively well (unlike B/D): ph cm-2 s-1.
Early SPI results on the 511 keV line emission from the GC region have been reported by Jean et al. (2003) and Knödlseder et al. (2003). The Galactic distribution of the emission could be described with a Gaussian bulge component of about FWHM and a uncertainty range covering . The centroid of the Gaussian was found to be consistent with the GC at the level. No evidence for a Galactic disk component was found. However, flux limits were in agreement with OSSE measurements.
In this paper we report results on the sky distribution of the 511 keV positron annihilation line radiation from the GC region after one year of observations with the spectrometer SPI on board ESA’s INTEGRAL observatory. Spectroscopic analysis of the 511 keV line, using the same data, is presented by Lonjou et al. (2004a). The results from both of these studies are presented in the context of previous findings by Jean et al. (2004); their astrophysical implications are discussed by Guessoum et al. (2004).
2 Data Analysis
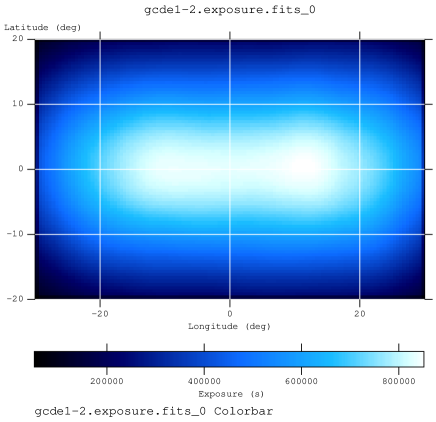
The data used for the analysis of the sky distribution of the 511 keV line emission with the spectrometer SPI (Vedrenne et al., 2003) consist of the spring and autumn Galactic Center Deep Exposures of 2003 (hereafter GCDE), supplemented by Galactic Plane Scan (GPS) observations of the central Galaxy. Both the GCDE and the GPS observations are part of the so-called Core Program observations of the INTEGRAL observatory, which are proprietary to the INTEGRAL Science Working Team (ISWT) and the instrument teams for one year (Winkler, 2001). The data comprise the INTEGRAL orbital revolutions 47–66 (March 3 – April 28) and 97–123 (August 2 – October 16), combining 1266 and 1068 pointings with a total exposure time of about and s, respectively. The GCDE consists of rectangular pointing grids covering Galactic longitudes and Galactic latitudes ; the GPS consists of pointings along the Galactic plane within (see Winkler, 2001, for details).
Due to data sharing agreements within the ISWT, the results presented here are limited to the Galactic quadrant (). However, in accordance with the aforementioned agreements, data from pointings in the entire GCDE region (as defined above) have been included in the analysis. The resulting exposure to the sky is depicted in Fig. 1.
The data were prepared following the procedures described in Jean et al. (2003) and Knödlseder et al. (2003). SPI single detector events have been gain corrected (see Lonjou et al., 2004b) and binned into event spectra for each detector and instrument pointing with 0.5 keV bins, leading to a 3-dimensional data space. In this data space, the instrumental background in the 485–550 keV band was modelled by two components: the instrumental 511 keV background line and the underlying continuum background, as described in detail in Jean et al. (2003), Teegarden et al. (2004), and Jean et al. (2004).
The continuum background in the line analysis interval 508.5–513.5 keV was determined based on the continuum background level at adjacent higher energies. The modelling of the instrumental line component has been significantly improved since the first analyses by Jean et al. (2003) and Knödlseder et al. (2003). We employed a multi-component model for the instrumental 511 keV line, which reflects to first order the multitude of prompt processes and delayed (radioactive) decays that give rise to this background line. We used e.g. the SPI background line identifications (Weidenspointner et al., 2003) and instrumental background simulations employing the MGGPOD Monte Carlo suite (Weidenspointner et al., 2004a, b) to identify the main contributors to the 511 keV line. The prompt components were assumed to scale with the rate of saturated Ge detector events (GeDsat). Delayed components due to radioactive decays were modelled by calculating a time history of their activity, assuming that their production rate scales with GeDsat.
3 Results
Imaging analyses of the 511 keV line emission with Richardson-Lucy (see Knödlseder et al., 2003, and references therein) and Bayesian (Allain et al., 2004) algorithms clearly show extended emission from the Galactic bulge with a radial profile that is approximately Gaussian. The sky maps do not provide any evidence for emission from point sources, a PLE component, or (at this stage) the Galactic disk.
A more quantitative approach for studying the Galactic distribution of the emission is model fitting. As a first step we have modelled the bulge emission by a spherical distribution with a Gaussian radial profile, located at the GC. We obtain a best fit FWHM of , with the quoted uncertainties defining the statistical confidence limits. The corresponding bulge flux is ph cm-2 s-1, with the uncertainty being dominated by the uncertainty of the width of the Gaussian intensity distribution. Spectroscopy of 511 keV line emission from the bulge resulted in a best fit energy of keV and an intrinsic line width of keV FWHM (see Lonjou et al., 2004a).
If we assume an ellipsoidal distribution with a Gaussian radial profile we improve the fits marginally. A bulge distribution that is more extended in longitude than latitude is slightly, but not yet significantly, favoured. This elongation might be an indication of emission from the Galactic disk.
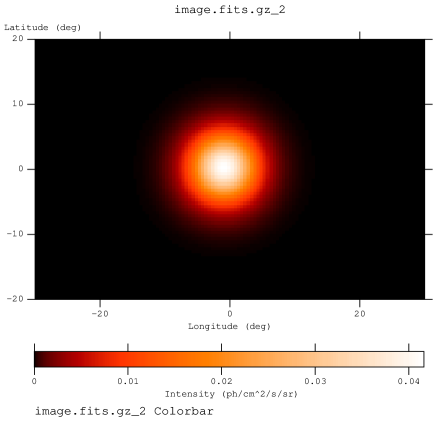
If we do not constrain the spherical Gaussian model (FWHM ) to be located at the GC, we find a best fit position of and ( error bars). The best fit bulge model is depicted in Fig. 2. The significance of the displacement from the GC is marginal at . This displacement of the Gaussian slightly reduces the range for FWHM, and slightly increases the bulge flux.
Although model fits yield hints of 511 keV line emission from the Galactic disk, such a component has not yet been significantly detected. The flux attributed to the disk depends strongly on the assumed spatial distribution (in the following, we quote 2 upper limits). The DIRBE 35 m and 240 m maps, which trace old and young stellar populations, yield flux limits of 1.4 and 0.9 ph cm-2 s-1 when integrated over the Galaxy. The motivation for chosing these two models was to span plausible positron source distributions.
We tried to account for the 511 keV line emission with point sources only using both model fitting and SPIROS (Skinner & Connell, 2003) imaging analysis. A single point source can be excluded with a very high confidence level. However, formally we cannot exclude the possibility that the emission originates in a population of at least 4 point sources. We also investigated how much a single point source could contribute in addition to our best (diffuse) description of the bulge emission. For a point source at the position of Sgr A∗, we can already set a 2 upper limit of about 40% of the total flux.
Analyses of the putative PLE component are complicated by the fact that the various OSSE studies did not converge on a unique parametrization (see table in von Ballmoos et al., 2003). In the following, we restrict ourselves to a PLE model of Purcell et al. (1997), a Gaussian at and , with a FWHM of . Fitting this PLE model together with a Gaussian model for the Galactic bulge has no significant effect on the results for the latter. No significant flux is attributed to the PLE; a conservative upper limit on the PLE flux (taking into account the uncertainty in the bulge size) is ph cm-2 s-1. It should be noted that a PLE of the strength suggested by Purcell et al. (1997) would have already been noticeable in the sky maps.
We have begun to investigate the positronium (Ps) continuum emission. First results in the 409–505 keV band indicate that the sky distribution of the total emission is consistent with what we find for the 511 keV line. If we use the Harris et al. (1990) result to fix the relative intensities of Galactic diffuse and Ps continuum emission, we can infer a Ps continuum flux from the measured total flux that is consistent with previous findings. However, because of systematic uncertainties in the subtraction of Galactic continuum emission we refrain from quoting a value for the Ps continuum flux and the Ps fraction until a forthcoming publication.
4 Discussion
With the available data, the sky distribution of the 511 keV positron annihilation line emission from the GC region as measured by SPI can be adequately described by a spherical distribution with Gaussian radial profile and a FWHM of , the quoted uncertainties being statistical confidence limits. The bulge extent as determined with SPI is consistent with the best fit OSSE results () at the confidence level. We cannot draw any firm conclusions regarding a possible discrepancy until we have achieved a positive detection of the Galactic disk with SPI, which might reduce the size of the bulge component.
We detect no significant deviation of the bulge distribution from spherical symmetry. The data hint at a possible elongation in longitude, which could reflect faint emission from the Galactic disk. Allowing the location of the Gaussian bulge model to vary freely suggests a slight offset from the GC that is only marginally significant. However, it is interesting to note that our best fit position coincides almost exactly with the centroid of the 511 keV line emission found by Tueller et al. (1996) using OSSE data. If the existence of an offset of the centroid of the 511 keV line emission can be corroborated in future analyses including more data, this would set an important constraint on emission models – in particular on models that attribute the bulk of the bulge 511 keV line emission to the annihilation of light dark matter particles, whose distribution should be exactly aligned with the dynamic center of the Galaxy. It is also interesting, but perhaps coincidental, that the centroid of our best-fit Gaussian bulge distribution lies less than 1 away from the hard X-ray source 1E1740.2-2942, which has been reported to produce transient red-shifted annihilation line radiation (see review by Harris, 1997, and references therein).
Assuming that the centroid of the 511 keV line emission is the GC, we find a flux from the bulge of ph cm-2 s-1, with the uncertainty being dominated by the uncertainty of the width of the Gaussian intensity distribution. This value is in good agreement with previous results obtained by high-resolution instruments (see table in Jean et al., 2003), which had fields-of-view smaller than or comparable to that of SPI, but falls short of the total 511 keV line fluxes obtained with OSSE (e.g. Milne et al., 2000) and SMM (e.g. Harris et al., 1990) by a factor of 2–3. SMM had a very large field-of-view ( FWHM) and therefore was sensitive to very extended emission beyond the Galactic bulge. In case of OSSE, the flux was separated into bulge and disk components, which had the values ph cm-2 s-1 and ph cm-2 s-1, respectively; these results strongly depended on the assumed shape of the bulge component (Milne et al., 2000). Our results for the bulge flux, and our upper limits on the disk flux, ph cm-2 s-1, are consistent with the OSSE measurements.
Our upper limits on the flux from the Galactic disk derived from model fits using the DIRBE 35 m and 240 m maps can be converted into lower limits on B/D, which are 0.5 and 0.8, respectively. Again, these limits are compatible with OSSE measurements (0.2–3.3). The SPI limits in B/D already have interesting implications. Based on their own low B/D, both DIRBE maps can be excluded as sole source distribution of Galactic positrons. Similarly, B/D for Galactic Type Ia SNe (from the distributions by Dawson & Johnson, 1994; Matteucci et al., 2003) is below the SPI limits. However, the observed distribution of low-mass X-ray binaries is consistent with our results for B/D (Pranzos, 2004). If light dark matter particles provide an important source of positrons, these would have a high B/D value.
We do not find any evidence for a PLE component.
Acknowledgments
Based on observations with INTEGRAL, an ESA project with instruments and science data centre funded by ESA member states (especially the PI countries: Denmark, France, Germany, Italy, Switzerland, Spain), Czech Republic and Poland, and with the participation of Russia and the USA.
References
- Allain et al. (2004) Allain, M., et al., 2004, these proceedings
- Boehm et al. (2004) Boehm, C., et al., 2004, Phys. Rev. Lett. 92, 101301
- Cassé et al. (2004) Cassé, M., et al., 2004, ApJ 602, L17
- Chan & Lingenfelter (1993) Chan, K.-W., and Lingenfelter, R.E., 1993, ApJ 405, 614
- Dawson & Johnson (1994) Dawson, P.C., and Johnson, R.G., 1994, JRASC 88, 369
- Guessoum et al. (2004) Guessoum, N., et al., 2004, these proceedings
- Harris et al. (1990) Harris, M.J., et al., 1990, ApJ 362, 135
- Harris (1997) Harris, M.J., 1997, Proc. of the Fourth Compton Symposium (AIP 410), 418
- Harris et al. (1998) Harris, M.J., et al., 1998, ApJ 501, L55
- Jean et al. (2003) Jean, P., et al., 2003, A&A 407, L55
- Jean et al. (2004) Jean, P., et al., 2004, these proceedings
- Knödlseder et al. (2003) Knödlseder, J., et al., 2003, A&A 411, L457
- Lonjou et al. (2004a) Lonjou, V., et al., 2004a, these proceedings
- Lonjou et al. (2004b) Lonjou, V., et al., 2004b, these proceedings
- Matteucci et al. (2003) Matteucci, F., et al., 2004, A&A 405, 23
- Milne et al. (2000) Milne, P.A., et al., 2000, in Proc. of the Fifth Compton Symposium (AIP 510), 21
- Milne et al. (2001) Milne, P.A., et al., 2001, in Proc. of Gamma 2001 (AIP 587), 11
- Purcell et al. (1997) Purcell, W.R., et al., 1997, ApJ 491, 725
- Pranzos (2004) Pranzos, N., 2004, these proceedings
- Skinner & Connell (2003) Skinner, G., and Connell, P., 2003, A&A 411, L123
- Teegarden et al. (2004) Teegarden, B., et al., 2004, these proceedings
- Tueller et al. (1996) Tueller, J., et al., 1996, A&AS 120, 369
- Vedrenne et al. (2003) Vedrenne, G., et al., A&A 411, L63
- von Ballmoos et al. (2003) von Ballmoos, P., et al., 2003, A&A 397, 635
- Weidenspointner et al. (2003) Weidenspointner, G., et al., 2003, A&A 411, L113
- Weidenspointner et al. (2004a) Weidenspointner, G., et al., 2004a, New Astr. Reviews 48, 227
- Weidenspointner et al. (2004b) Weidenspointner, G., et al., 2004b, these proceedings
- Winkler (2001) Winkler, C., 2001, Proc. 4th INTEGRAL workshop, ed. A. Gimenez, V. Reglero, and C. Winkler (ESA SP-459), 471