Spitzer observations of MAMBO galaxies: weeding out
active nuclei in starbursting proto-ellipticals
Abstract
We present Spitzer observations in five wavebands between 3.6 and 24 m of an unbiased sample of nine luminous, dusty galaxies selected at 1200 m by the MAMBO camera on the IRAM 30-m telescope, a population akin to the well-known submillimeter (submm) or ‘SCUBA’ galaxies (hereafter SMGs). Owing to the coarse resolution of submm/mm instrumentation, SMGs have traditionally been difficult to identify at other wavelengths. We compare our multi-wavelength catalogs to show that the overlap between 24 and 1200 m must be close to complete at these flux levels. We find that all (4/4) of the most secure 4 SMGs have robust 4 counterparts at 1.4 GHz, while the fraction drops to 7/9 using all 3 SMGs. We show that combining mid-infrared (mid-IR) and marginal (3) radio detections provides plausible identifications in the remaining cases, enabling us to identify the complete sample. Accretion onto an obscured central engine is betrayed by the shape of the mid-IR continuum emission for several sources, confirming Spitzer’s potential to weed out active galaxies. We demonstrate the power of a versus color-color plot as a diagnostic for this purpose. However, we conclude that the majority (75%) of SMGs have rest-frame mid-/far-IR spectral energy distributions (SEDs) commensurate with obscured starbursts. Sensitive 24-m observations are clearly a useful route to identify and characterize reliable counterparts to high-redshift far-IR-bright galaxies, complementing what is possible via deep radio imaging.
1 Introduction
Major progress has been made in our understanding of galaxy formation and evolution since the discovery of a significant population of submm/mm-bright, dusty galaxies. The first handful of galaxies, discovered behind lensing clusters (Smail, Ivison & Blain, 1997), and in the Hubble Deep Field (Hughes et al., 1998), revealed the diversity of the population. SCUBA (Holland et al., 1999), the innovative camera with which SMGs were first seen, was commissioned on the James Clerk Maxwell Telescope during 1996–7. Since then, the 117-bolometer, 1200-m MAMBO camera (Bertoldi et al., 2000) has been installed on the IRAM 30-m telescope, Spain. Surveys at 1200 m are sensitive to the same dusty galaxies as SCUBA, yet with a selection function that potentially stretches to higher redshifts and is sensitive to lower dust temperatures (Eales et al., 2003; Blain et al., 2004b).
A moderate fraction of SMGs can be pinpointed by their Jy-level emission at 1.4 GHz (Ivison et al. 2002), allowing us to identify their counterparts in other wavebands. However, up to 30% of the population remain undetected in the radio waveband in even the deepest maps and the properties of these galaxies remain a mystery. Those SMGs which can be localised through their radio emission are usually found in the optical/IR wavebands to be faint, morphologically complex systems, often comprising red galaxies with bluer companions, as expected for a distant, dust-reddened, interacting star-forming population (Ivison et al., 2002; Smail et al., 2002; Webb et al., 2003). Recent advances in their study include the measurement of the redshift distribution of radio-detected SMGs (Chapman et al., 2003), the resolution of most of the submm background by exploiting gravitational lensing (Blain et al., 1999; Cowie, Barger & Kneib, 2002), the identification of X-ray emission from a significant fraction of the population (Alexander et al., 2003), the detection — via broad CO lines — of collosal quantities (1011 M⊙) of molecular gas (Frayer et al., 1998; Neri et al., 2003; Greve et al., 2004a), and the first indications of the strong clustering expected for such massive galaxies (Blain et al., 2004a). These discoveries underline the importance of studying the far-IR luminous SMGs for our understanding the formation of massive galaxies at high redshifts.
For local IR-luminous galaxies, mid-IR data from the Infrared Space Observatory (ISO) were used to develop a number of useful diagnostics to differentiate between those powered predominantly by starbursts and by active galactic nuclei (AGN) (Genzel & Cesarsky, 2000). ISO was sensitive to only the most luminous SMGs, so efforts to assess the preponderance of AGN in SMGs have so far been reliant on UV/optical spectroscopy, radio observations, and the aforementioned X-ray imaging, often with ambiguous results. The fraction of distant, far-IR-luminous galaxies with an energetically dominant AGN remains poorly determined, although it is expected to be small: even SMGs with unambiguous AGN characteristics (Ivison et al., 1998) are thought to have a major starburst contribution to their bolometric luminosities (Frayer et al., 1998; Genzel et al., 2003). This finding has been echoed in studies of distant quasars and radio galaxies: far-IR-luminous examples are found to be gas-rich and their submm emission is often resolved, as expected if their power originates in large part from stars (Omont et al., 1996; Papadopoulos et al., 2000; Stevens et al., 2003).
In this Letter, we use mid-IR continuum imaging of nine MAMBO-selected SMGs in the Lockman Hole to investigate the use of mid-IR data to identify the counterparts at other wavelengths of this population and demonstrate the power of mid-IR data for determining the likely power source (AGN or starburst) in these galaxies.
2 MAMBO galaxies and the diagnostic potential of Spitzer
Greve et al. (2004b) reported the results of a deep unbiased MAMBO survey of the Lockman Hole, a region mapped earlier by SCUBA for the ‘8-mJy Survey’ (Scott et al., 2002). This region was selected for reasons that included its low Galactic cirrus emission and the availability of high-quality complementary data at X-ray, optical/IR and radio wavelengths. Not surprisingly, the same region was selected for some of the earliest imaging with Spitzer (Werner et al., 2004). The data exploited herein were obtained using IRAC (Fazio et al., 2004) and MIPS (Rieke et al., 2004), reaching noise levels of = 0.8, 0.8, 2.8, 1.7 and 30 Jy at 3.6, 4.5, 5.8, 8.0 and 24 m with absolute calibration accurate to %. These compare with 5- confusion limits (20 beams per source) of around 1.0, 1.2 and 56 Jy at 3.6, 8.0 and 24 m (Väisänen, Tollestrup & Fazio, 2001; Dole et al., 2004). The images cover a region, centered near the SMG, LE 850.01 (Table 1). Data were reduced using standard Spitzer data analysis tools, as described by Le Floc’h et al. (2004) and Huang et al. (2004).
Our analysis also makes use of deep optical imaging from SuprimeCam on the Subaru 8-m telescope (, Vega, 2′′-radius aperture), XMM-Newton X-ray data (, 0.5–10 keV) and a Very Large Array radio image (, 1.4 GHz) (Ivison et al., 2002).
The Greve et al. (2004b) 1200-m sample includes nine 3 MAMBO sources within the region covered by the IRAC/MIPS observations. Four are detected at 4, all of which should be secure. The other five are 3- detections, of which up to two may be the result of noise fluctuations, Eddington bias (Scott et al., 2002) or confusion. Greve et al. (2004b) performed Monte Carlo simulations to determine the reliability, completeness and positional accuracy of their source catalog. We list the flux densities, significance and positions for all nine sources in Table 1 and note that the positions are accurate to 4′′ (95% confidence).
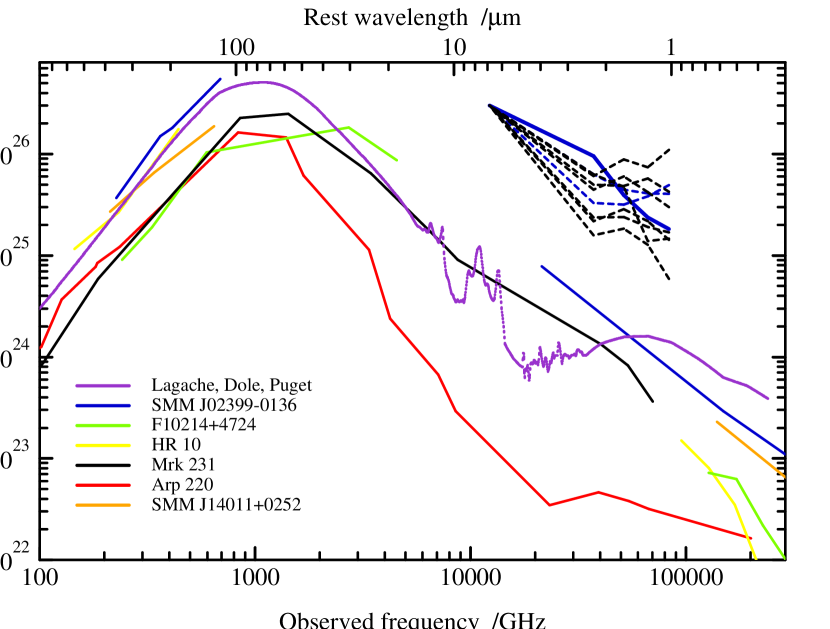
Fig. 1 shows the SEDs of typical local starburst- and AGN-dominated IR-luminous galaxies and several SMGs with well-sampled UV–radio spectra. It is worth reviewing the emission mechanisms operating across the observable wavelength range: where our adopted sample was selected, at 1200 m (rest-frame far-IR), we are sensitive to cold dust (40 k) created in copious quantities by supernovae (SNe; Dunne et al. (2003)), which re-radiates energy absorbed in the UV from hot, young stars. In the radio, at 1.4 GHz, we are again sensitive to SNe (and hence to recent star formation), via synchrotron radiation from relativistic electrons. Contamination via radio-loud AGN is possible and, at Jy flux levels, is virtually impossible to distinguish from pure SNe-related emission. We are also sensitive to AGN via X-ray emission from accretion disks and their associated coronae, although determining the origin of the X-rays is not always trivial and heavily obscured ( cm-2, Compton-thick) AGN can evade detection altogether (Alexander et al., 2003). At the shortest IR wavelengths accessible to Spitzer (3.6–8.0 m), we are provided — via photospheric emission from stars — with a relatively unobscured measure of stellar luminosity, possibly even of stellar mass in more evolved systems out to . At 24 m (rest-frame 7 m for a galaxy at –3) we are sensitive to emission from 500-k dust in the circumnuclear torus of AGN, and to the warmest dust in starbursts.
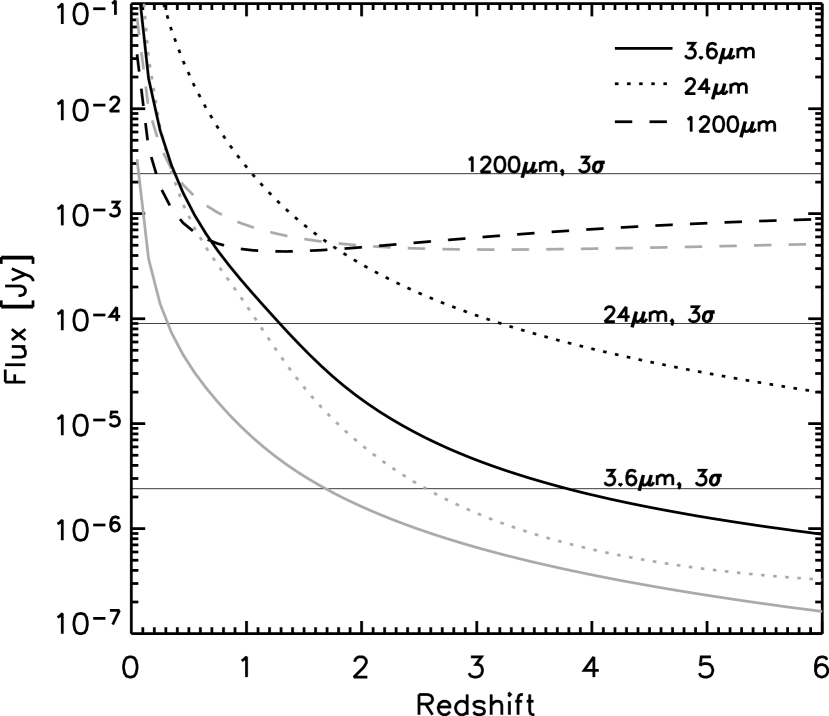
Do our Spitzer observations provide sufficient sensitivity to detect dust-enshrouded starbursts and AGN in the distant Universe? In Fig. 1 we illustrate the SEDs of a selection of well-studied dusty, luminous galaxies and models (both AGN and starbursts). These demonstrate the range of rest-frame mid-IR luminosities for these systems and we select Arp 220 and Mrk 231 to represent extremes of the the starburst- and AGN-dominated sub-classes. Fig. 2 shows that even with its steep mid-IR spectrum (, where ), Arp 220 would be detected at 3.6 and 24 m out to (see also Blain et al. (2004b)). Mrk 231, its mid-IR emission boosted an order of magnitude higher than Arp 220 by its AGN, would be detected out to at 24 m.
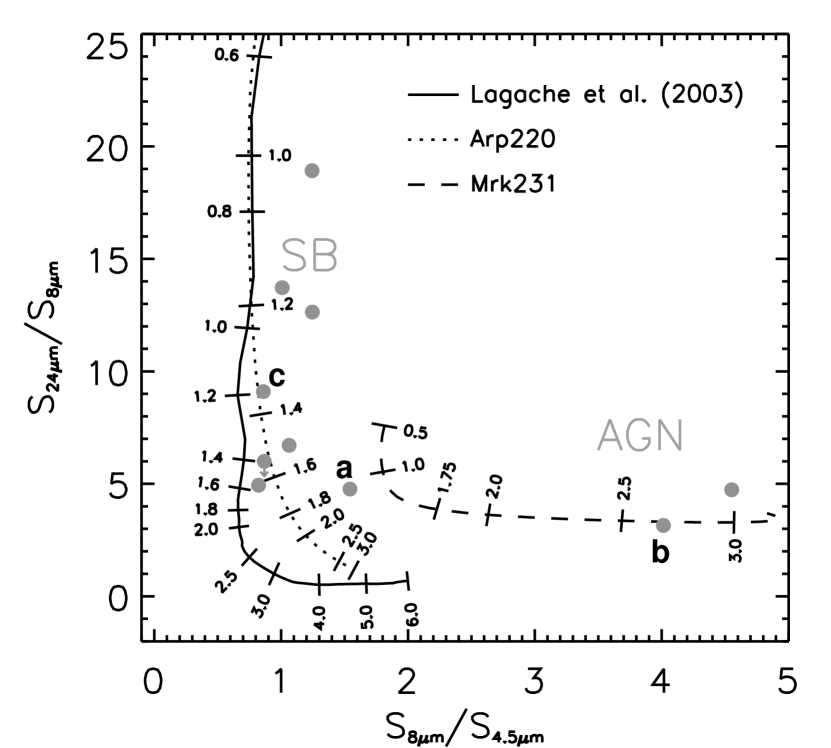
The diagnostic power of the near- and mid-IR bands — the ability to discriminate between starbursts with and without buried, active nuclei — arises from the different physical regimes and spectral features probed across the mid-IR waveband (Rigopoulou et al., 2002). A steeper slope between rest-frame –10 m is apparent for starbursts than for AGN-dominated galaxies. The latter, typified by Mrk 231 and SMM J023990136 (Fig. 1), have power-law spectra covering rest-frame 0.2–10 m (Ivison et al., 1998). In contrast, the SED of a starburst like Arp 220 has a flatter region between 1 and 4 m. Thus for MAMBO galaxies at –3 (assuming the same median redshift as for SCUBA galaxies — Chapman et al. (2003)), the key spectral indices are available in the 3.6–24-m bands covered by IRAC and MIPS. Fig. 3, a versus color–color plot, shows the tracks of Arp 220 and Mrk 231 as they are moved from the local Universe to , as well as the track of a synthetic -L⊙ starburst from Lagache, Dole & Puget (2003). We can see immediately that the starburst and AGN populations are well separated, and that this plot has strong diagnostic potential: we can define regions where starburst and active galaxies are likely to lie at –3 and hence use this to classify our SMGs.
3 Mid-IR counterparts to MAMBO galaxies
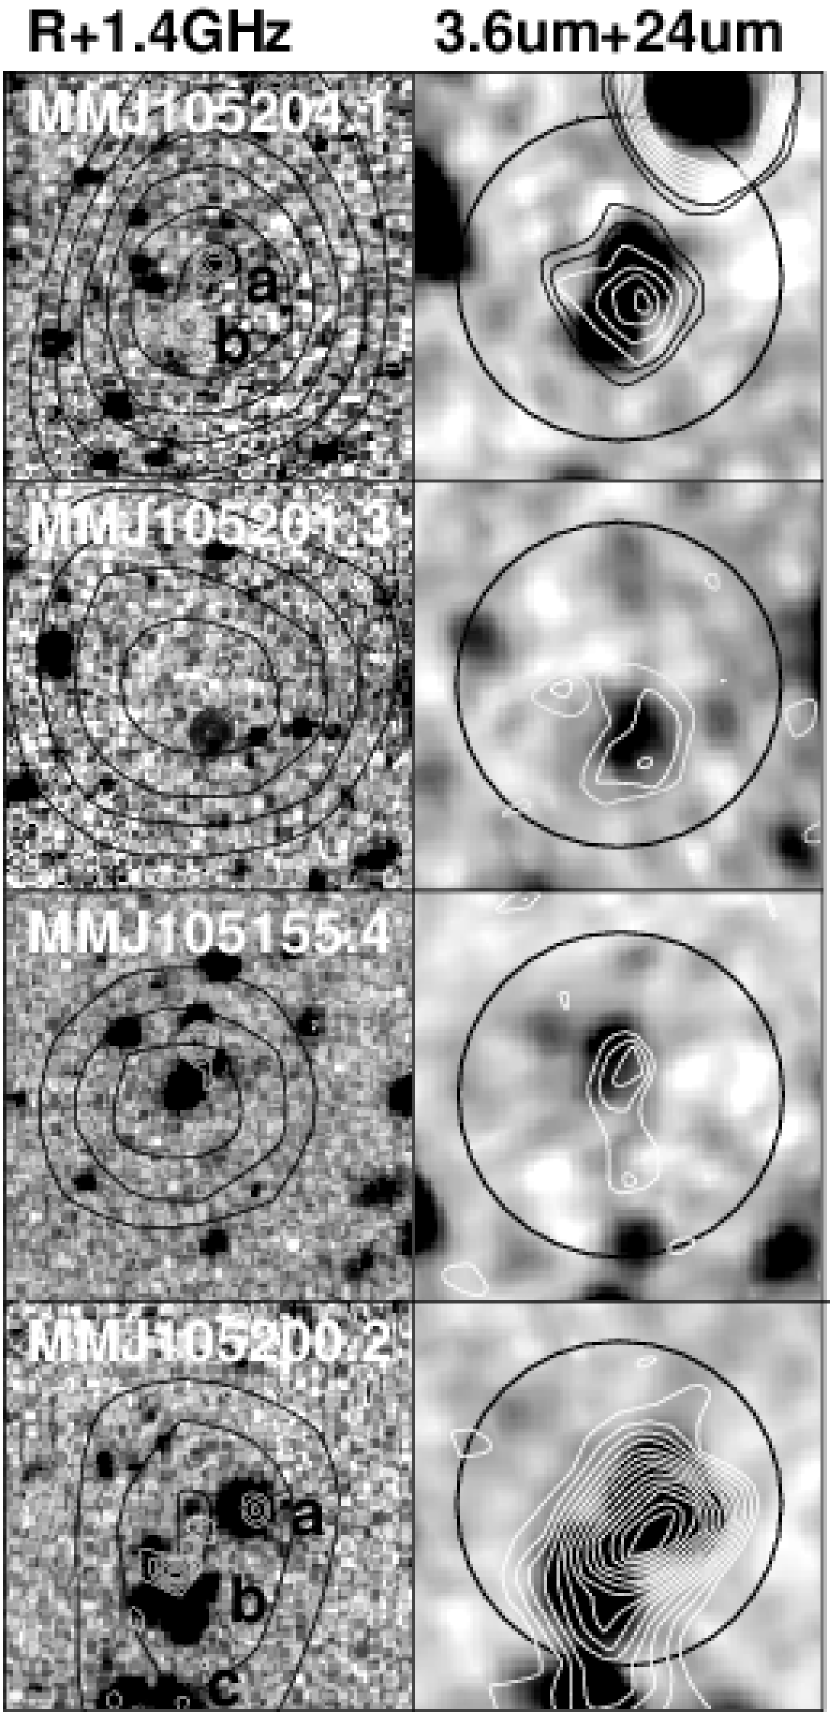
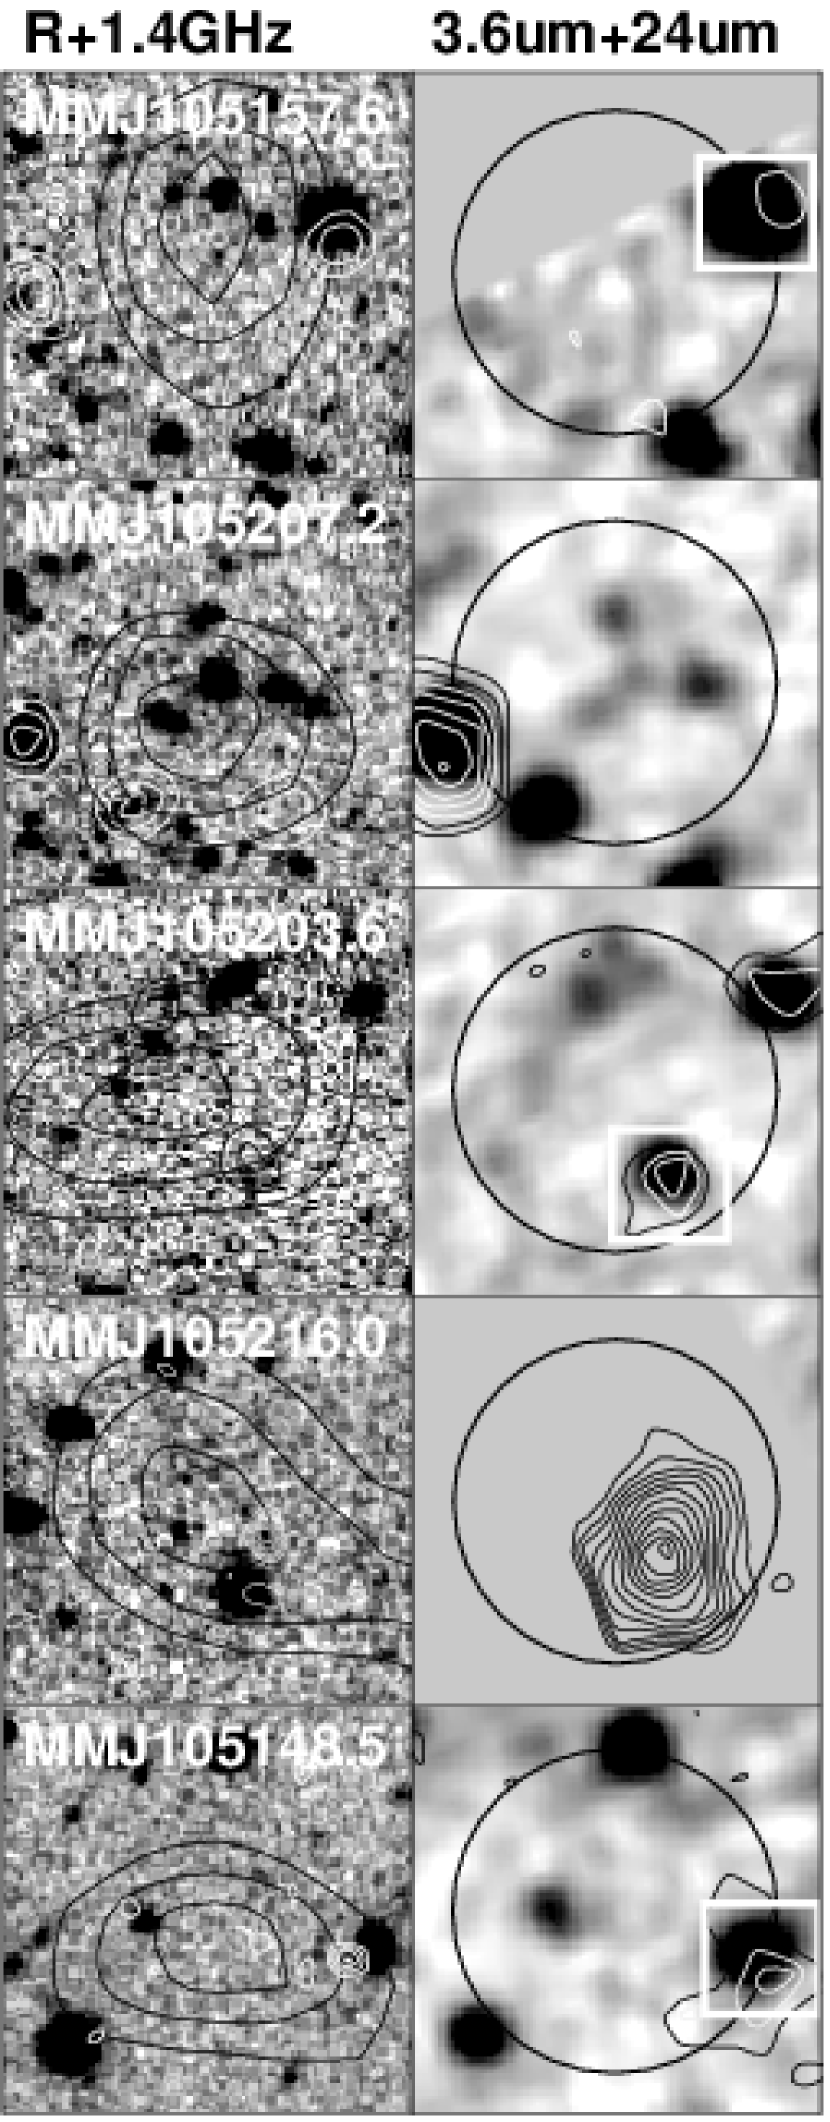
We search for radio and mid-IR counterparts to the MAMBO sources within their nominal error circles (illustrated in Fig. 4). We find that all of the four most secure 4 MAMBO sources have robust radio counterparts at 1.4 GHz (as defined by Ivison et al. (2002)). This drops slightly to 7/9 robust radio counterparts using all 3 MAMBO sources, somewhat higher than the 18/42 detection rate121212Dannerbauer et al. (2004) relied on a 1.4-GHz image which contains several stripe-inducing 60-mJy sources, with a noise level 2–3 times higher than the radio data utilized here. Using equivalent data, our fraction of radio-detected MAMBO sources would fall to 5/9, consistent with Dannerbauer et al. (2004). reported by Dannerbauer et al. (2004). The remaining two have tentative radio identifications at 3 – but these are not significant enough to be reliable. If instead we had used the 24 m Spitzer imaging to identify counterparts we would have identified 8/9 of the 3 MAMBO galaxies with significant 24 m sources. Interestingly, all but one of the seven MAMBO sources with robust radio counterparts are detected at 24 m, the exception being MM J105207.2+572558. Combining the two identification schemes increases our confidence in the identification of the proposed counterparts in both wavebands and provides reliable identifications for all nine SMGs in this region.
Detections at 24 m (fwhm 6′′) halve the mm positional uncertainties (to 2′′, 95% confidence), although the accuracy remains short of that provided by radio imaging (0.6–1.6′′, 95% confidence — Ivison et al. (2002)). Hence the radio remains the most useful waveband for localising the far-IR emission given sufficiently long integrations.
4 Weeding out AGN
We next investigate the power of mid-IR observations to identify AGN within the SMG population. Only one of our nine MAMBO sources has an X-ray counterpart, MM J105200.2+572425 (= LE 850.08), previously identified by Ivison et al. (2002). It could be argued that the complexity of this immense merger — there are at least seven distinct optical components in Fig. 4 — is such that it would be surprising if at least one of the galaxies were not active! In the absence of the X-ray detection, could we have identified which components contain buried AGN using only the mid-IR data? We could. We list the fluxes of the three resolved mid-IR components in this system separately in Table 1 to check whether they have different SEDs. Fig. 1 shows the individual SEDs, arbitrarily placed at . The component near-coincident with the brightest XMM-Newton and radio emission (‘b’ in Fig. 4; see also Ivison et al. (2002)) has a power-law mid-IR spectrum reminiscent of Mrk 231. Component ‘a’ (previously assumed to be the source of X-rays, based on a less precise centroid from ROSAT) was identified as an AGN at by Lehmann et al. (2001)) and shows a weak break in slope at an observed wavelength around 4m, suggesting a possible mix of AGN and star formation power sources. Component ‘c’, on the other hand, has a strong short-wavelength upturn indicative of a starburst. This system allows us to demonstrate the diagnostic power of Fig. 3, with component ‘b’ lying close to the track of Mrk 231, well separated from the starburst track; component ‘a’ lies between the AGN and starburst tracks and within of its predicted redshift based on the SED of Mrk 231; component ‘c’ is classified as a pure starburst. The main area of possible confusion with this diagram is separating high-redshift starbursts from low-redshift AGN; fortunately, as in this case, we can expect AGN at to reveal themselves in other wavebands. On the basis of these tests, it seems reasonable to expect that mid-IR observations with Spitzer will be able to weed out active galaxies within the SMG population.
The mid-IR data for the other SMGs shown in Figs 1 and 3 display a range of characteristics between the extremes of the Arp 220 and Mrk 231 templates, although the dispersion in Fig. 1 must be due partially to the spread in redshift. Over half of the sample display an Arp 220-like upturn in the mid-IR — with a flat SED out to 8 m in the observed frame and a sharp rise thereafter — showing that active galaxies, although present, do not dominate the MAMBO population. This is consistent with conclusions drawn from UV/optical spectra and X-ray imaging (Chapman et al., 2003; Alexander et al., 2003). Using the model/empirical tracks to classify the eight MAMBO galaxies with measured 3.6–24-m SEDs, Fig. 3 would indicate six starbursts and two AGN. Thus % of the SMGs in our small sample have mid-IR colors characteristic of high-redshift obscured starbursts. Their mid-IR colors suggest a median redshift of 1.4 for our MAMBO sample, somewhat lower than the measured for the radio-detected SMGs of Chapman et al. (2003). This may reflect differences in the selection functions at 850 and 1200 m, with the latter selecting a somewhat colder, lower redshift and intrinsically lower-luminosity section of the population, or it may simply be the result of adopting inappropriate SED templates.
If we assume the MAMBO sources lie at similar redshifts to the SCUBA population and place the MAMBO sources at then 8.0 m corresponds to rest-frame . It is therefore instructive to compare the MAMBO galaxies with the -corrected spectrum of Arp 220 (Fig. 3). Arp 220 has an absolute magnitude of 24.4, roughly 1.3 L⋆ (Kim et al., 2002), and would have an 8.0-m flux of 2 Jy at . The median 8.0-m flux of the 4 MAMBO sources is 20 Jy, implying naively that these galaxies are already 15 L⋆. The more plausible alternatives are that these galaxies lie at lower redshifts than we have assumed (–2, as implied by Fig. 3) or that their observed 8.0-m luminosity is dominated by massive, young stars or hot dust. Determining the exact cause of the apparently immense mid-IR luminosities of these SMGs will require spectoscopic observations in the optical and mid-IR to confirm their redshifts and the details of their mid-IR spectral properties.
5 Concluding remarks
Spitzer observations between 3.6 and 24 m of nine galaxies selected at 1200 m have improved our confidence in the identification of secure counterparts, complementing what was learned from radio imaging. Robust identifications have been possible for 90% of the MAMBO galaxies using 24-m imaging, a similar fraction to that achievable from radio imaging. Together, radio and mid-IR imaging have yielded plausible counterparts for the entire MAMBO sample in this region. We conclude that 3.6–24-m observations provide a useful tool to aid in identifying SMGs.
Accretion onto an obscured central engine is sometimes betrayed by the shape of the mid-IR continuum, confirming Spitzer’s potential to weed out active galaxies. The fraction of mm galaxies with energetically-important AGN in our small sample, 25% (or 5–60% at the 95% confidence level), is similar to that estimated from UV/optical spectroscopy and deep X-ray imaging (Chapman et al., 2003; Alexander et al., 2003), but the majority of MAMBO galaxies have rest-frame mid-/far-IR SEDs commensurate with obscured starbursts.
References
- Alexander et al. (2003) Alexander, D.M., et al. 2003, AJ, 125, 383
- Bertoldi et al. (2000) Bertoldi, F., et al. 2000, A&A, 360, 92
- Blain et al. (1999) Blain, A.W., Kneib, J.-P., Ivison, R.J., & Smail, I. 1999, ApJ, 512, L87
- Blain et al. (2004a) Blain, A.W., Chapman, S.C., Smail, I., & Ivison, R.J. 2004a, ApJ, submitted (astro-ph/0405035)
- Blain et al. (2004b) Blain, A.W., Chapman, S.C., Smail, I., & Ivison, R.J. 2004b, ApJ, submitted (astro-ph/0404438)
- Chapman et al. (2003) Chapman, S.C., Blain, A.W., Ivison, R.J., & Smail, I. 2003, Nature, 422, 695
- Cowie, Barger & Kneib (2002) Cowie, L.L., Barger, A.J., & Kneib, J.-P. 2002, AJ, 123, 2197
- Dannerbauer et al. (2004) Dannerbauer, H., Lehnert, M.D., Lutz, D., Tacconi, L., Bertoldi, F., Carilli, C., Genzel, R., & Menten, K.M. 2004, ApJ, 606, 664
- Dole et al. (2004) Dole, H., et al. 2004, ApJS, this issue
- Dunne et al. (2003) Dunne, L., Eales, S., Ivison, R., Morgan, H., & Edmunds, M. 2003, Nature, 424, 285
- Eales et al. (2003) Eales, S.A., Bertoldi, F., Ivison, R.J., Carilli, C.L., Dunne, L., & Owen, F.N. 2003, MNRAS, 344, 169
- Fazio et al. (2004) Fazio, G.G., et al. 2004, ApJS, this issue
- Frayer et al. (1998) Frayer, D.T., Ivison, R.J., Scoville, N.Z., Evans, A.S., Yun, M., Smail, I., Blain, A.W., & Kneib, J.-P. 1998, ApJ, 506, L7
- Genzel & Cesarsky (2000) Genzel, R., & Cesarsky, C.J. 2000, ARA&A, 38, 761
- Genzel et al. (2003) Genzel, R., Baker, A.J., Tacconi, L.J., Lutz, D., Cox, P., Guilloteau, S., & Omont, A. 2003, ApJ, 584, 633
- Greve et al. (2004a) Greve, T.R., et al. 2004a, ApJ, in preparation
- Greve et al. (2004b) Greve, T.R., et al. 2004b, MNRAS, submitted (astro-ph/0405361)
- Holland et al. (1999) Holland, W.S., et al. 1999, MNRAS, 303, 659
- Huang et al. (2004) Huang, J.-S., et al. 2004, ApJS, this issue
- Hughes et al. (1998) Hughes, D.H., et al. 1998, Nature, 394, 241
- Ivison et al. (1998) Ivison, R.J., Smail, I., Le Borgne, J.-F., Blain, A.W., Kneib, J.-P., Bézecourt, J., Kerr, T.H., & Davies, J.K. 1998, MNRAS, 298, 583
- Ivison et al. (2000) Ivison, R.J., Smail, I., Barger, A., Kneib, J.-P., Blain, A.W., Owen, F.N., Kerr, T.H., & Cowie, L.L. 2000, MNRAS, 315, 209
- Ivison et al. (2002) Ivison, R.J., et al. 2002, MNRAS, 337, 1
- Kim et al. (2002) Kim, D.-S., Veilleux, S., & Sanders, D.B. 2002, ApJS, 143, 277
- Lagache, Dole & Puget (2003) Lagache, G., Dole, H., & Puget, J.-L., 2003, MNRAS, 338, 555
- Le Floc’h et al. (2004) Le Floc’h, E., et al. 2004, ApJS, this issue
- Lehmann et al. (2001) Lehmann, I., et al. 2001, A&A, 371, 833
- Neri et al. (2003) Neri, R., et al. 2003, ApJ, 597, L113
- Omont et al. (1996) Omont, A., Petitjean, P., Guilloteau, S., McMahon, R.G., Solomon, P.M., Pecontal, E. 1996, Nature, 382, 428
- Papadopoulos et al. (2000) Papadopoulos, P.P., Röttgering, H.J.A., van der Werf, P.P., Guilloteau, S., Omont, A., van Breugel, W.J.M., & Tilanus, R.P.J. 2000, A&A, 528, 626
- Rieke et al. (2004) Rieke, G.H., et al. 2004, ApJS, this issue
- Rigopoulou et al. (2002) Rigopoulou, D., Kunze, D., Lutz, D., Genzel, R., & Moorwood, A.F.M. 2002, A&A, 389, 374
- Scott et al. (2002) Scott, S.E., et al. 2002, 331, 817
- Smail, Ivison & Blain (1997) Smail, I., Ivison, R.J., & Blain, A.W. 1997, ApJ, 490, L5
- Smail et al. (2002) Smail, I., Ivison, R.J., Blain, A.W., & Kneib J.-P. 2002, MNRAS, 331, 495
- Stevens et al. (2003) Stevens, J.A., et al. 2003, Nature, 425, 264
- Väisänen, Tollestrup & Fazio (2001) Väisänen, P., Tollestrup, E.V., & Fazio, G.G. 2001, MNRAS, 325, 1241
- Webb et al. (2003) Webb, T.M.A., et al. 2003, ApJ, 587, 41
- Werner et al. (2004) Werner, M.W., et al. 2004, ApJS, this issue
| SourceaaItalics signify sources for which robust counterparts have been identified via radio imaging; bold type indicates a robust identification made possible by the mid-IR data. | bbWe quote either a detection or a 3 limit based on the 850-m noise measured in a 2.6-square-arcmin region centered on the mm source. | S | S | Comment | |||||
|---|---|---|---|---|---|---|---|---|---|
| MM J105204.1+572658 | 3.60.6 | 9.52.8 | 24931 | 18.61.9 | 27.63.3 | 20.22.1 | 15.21.6 | 365 | (a); LE 850.14 |
| — | 18.51.9 | 22.23.0 | 14.71.5 | 9.81.0 | 728 | (b) | |||
| MM J105201.3+572448 | 3.40.6 | 10.51.6 | 19331 | 10.21.7 | 11.82.8 | 8.20.9 | 3.80.8 | 738 | LE 850.01 |
| MM J105155.4+572310 | 3.30.8 | 4.51.3 | 12532 | 26.42.7 | 19.92.8 | 5.80.8 | 6.10.8 | 475 | LE 850.18 |
| MM J105200.2+572425 | 2.40.6 | 5.11.3 | 53455 | 11212 | 79.08.0 | 72.67.3 | 72.07.2 | 15 | (a); , LE 850.08 |
| 28230 | 89.59.0 | 37.23.8 | 22.32.3 | 17.11.8 | 808 | (b) | |||
| 16230 | 17.81.8 | 17.22.8 | 20.72.1 | 26.72.7 | 226 | (c) | |||
| MM J105157.6+572800 | 2.20.6 | 11 | 12130 | 24.52.5 | 35.73.8 | 29.83.0 | 44.54.5 | 216 | |
| MM J105207.2+572558 | 1.70.5 | 12 | 90 | 15.01.7 | 14.52.8 | 17.31.8 | 12.81.3 | 236 | |
| MM J105203.6+572612ccThe source lies between LE 850.04 and LE 850.14; in the SCUBA map it would thus have been affected by the off-beams of both, hence its lack of detection at 850 m. | 1.70.5 | 10 | 16630 | 12.11.7 | 15.82.8 | 12.01.2 | 7.90.8 | 196 | |
| MM J105216.0+572506 | 1.60.5 | 6.72.1 | 57859 | — | — | — | — | 485 | LE 850.29 |
| MM J105148.5+572408 | 2.10.7 | 7.8 | 21130 | 16.71.7 | 16.82.8 | 13.41.4 | 11.91.2 | 296 |