2) Max Planck Institut für extraterrestrische Physik, Giessenbachstrasse, 85748 Garching, Germany
11email: email: moultaka@ph1.uni-koeln.de
Dust Embedded Sources at the Galactic Center
We present the first L-band spectroscopic observations for a dozen stellar sources in the central pc of the GC stellar cluster that are bright in the 2-4 m wavelength domain. The L-band data were taken with ISAAC at the VLT UT1 (Antu). With the aid of additional K-band spectroscopic data, we derive optical depth spectra of the sources after fitting their continuum emission with a single reddened blackbody continuum. We also derive intrinsic source spectra by correcting the line of sight extinction via the optical depth spectrum of a late type star that is most likely not affected by local dust emission or extinction at the Galactic Center. The good agreement between the two approaches shows that the overall variation of the line-of-sight extinction across the central pc is mag. The extinction corrected spectra of the hot He-stars are in good agreement with pure Rayleigh Jeans continuum spectra. The intrinsic spectra of all other sources are in agreement with continuum emission and absorption features due to the dust in which they are embedded. We interprete both facts as evidence that a significant amount of the absorption takes place within the central parsec of the Galactic Center and is most likely associated with the individual sources there. We find absorption features at , , and wavelength. Correlations between all three features show that they are very likely to arise in the ISM of the central pc. Spacially highly variable hydrogen emission lines seen towards the individual sources give evidence of the complex density and temperature structure of the mini-spiral. In the cases of the sources with featureless K-band spectra like IRS 21 and IRS 1W, they are consistent with massive hot stars embedded in the bow shock created by their motion through the dust and gas of the mini-spiral. It is likely that the bow shock scenario may be applicable to most of the dust embedded sources in the central stellar cluster. Spectroscopy of high MIR-excess sources 0.5” north of the IRS 13 complex is largely consistent with them being YSOs. However, a bow-shock nature of these sources cannot be excluded. The L-band spectrum at the location of SgrA*, is consistent with that of a hot O-type star, such as S2, which was very close to Sgr A* at the time of our observations.
Key Words.:
Galaxy: center - galaxies: nuclei - infrared: stars - infrared: ISM extinction1 Introduction
Near-infrared diffraction limited imaging over the past 10 years (Eckart & Genzel, 1996; Genzel et al., 1997; Ghez et al., 1998, 2000; Eckart et al., 2002; Schödel et al. 2002, 2003; Ghez et al., 2003) has resulted in convincing evidence for a 3-4106M⊙ black hole at the center of the Milky Way. This finding is supported by the discovery of a variable X-ray and NIR source at the position of SgrA* (Baganoff et al., 2001; Genzel et al., 2003a). Most intrigingly, near-infrared imaging and spectroscopic observations have provided evidence for recent star formation in the central parsec of the Milky Way, an environment previously thought hostile for star formation because of the tidal field of the black hole, intense stellar winds, and strong magnetic fields.
At a distance of 8 kpc (Eisenhauer et al. 2003), the Galactic Center is surrounded by a circumnuclear ring of dense gas and dust showing clumpy extinction (Güsten et al. 1987). Inside this ring, there is a central cavity of about 3 pc diameter, that contains mainly ionzed or atomic gas. The visual extinction estimates towards prominent sources within the central stellar cluster range between 20 and 50 magnitudes with a median around 30 magnitudes (see Rieke, Rieke, & Paul 1989, Chan et al. 1997, Scoville et al. 2003). In addition Scoville et al. (2003) showed that the extinction is smoothly distributed across the central 10 to 20 arcseconds with no indication of concentrations of extinction on scales of about 1” to 2”.
The 30 magnitudes of visual extinction along the line of sight toward the Galactic Center (GC) is mostly due to the diffuse interstellar medium (ISM) (Lebofsky 1979) and in part due to dense molecular gas (Gerakines et al. 1999; de Graauw et al. 1996; Lutz et al. 1996). The absorbing gas is cold (10 K) and the abundances of important molecular species are similar to the solar neighborhood (Moneti, Cernicharo, & Pardo 2001a, Chiar et al. 2000). In addition Blum et al. (1996) and Clénet et al. (2001) concluded that the colors of individual dusty sources within the central stellar cluster contain a substantial contribution from intrinsic reddening.
The entire central parsec of our Galaxy is powered by a cluster of young and massive stars (Blum et al. 1988, Krabbe et al. 1995, Genzel et al. 1996, Eckart et al. 1999, Clénet et al. 2001). Within that cluster the 7 most luminous (L105.75 L⊙ ), moderately hot (T104.5 K) blue supergiants contribute half of the ionizing luminosity of that region (Najarro et al. 1997, Krabbe et al. 1995, Blum et al. 1995). Such massive and hot stars were also found in dense clusters within the Galactic bulge, i.e. the Arches cluster (Cotera et al. 1992, see also Figer et al. 2002 and references therein) and the Quintuplet cluster (e.g. Figer et al. 1997).
In addition to the massive blue supergiants, a population of dusty sources associated with bright dust emission can be found in the Galactic Center stellar cluster. After initial preceeding work by Becklin & Neugebauer (1968, 1969) first individual mid-infrared sources in the central stellar cluster (among them IRS 1, 3 and others) were reported by Rieke & Low (1973) and Becklin & Neugebauer (1975). Later, IRS 1 was resolved into multiple components by Storey & Allen (1983), Rieke et al. (1989), Simon et al. (1990), and Herbst et al. (1993). Further high resolution imaging by Tollestrup et al. (1989) resolved IRS 6 and IRS 12 into multiple components.
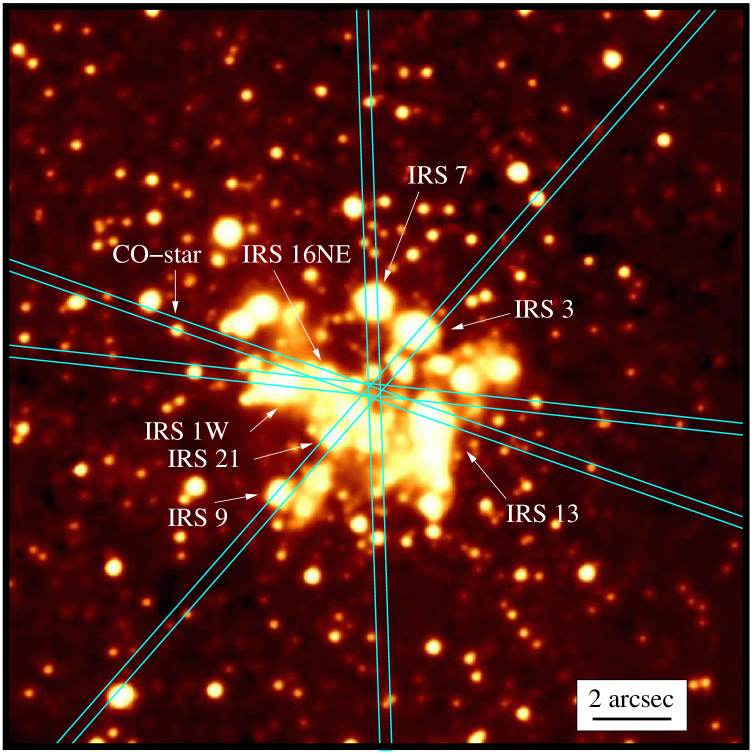
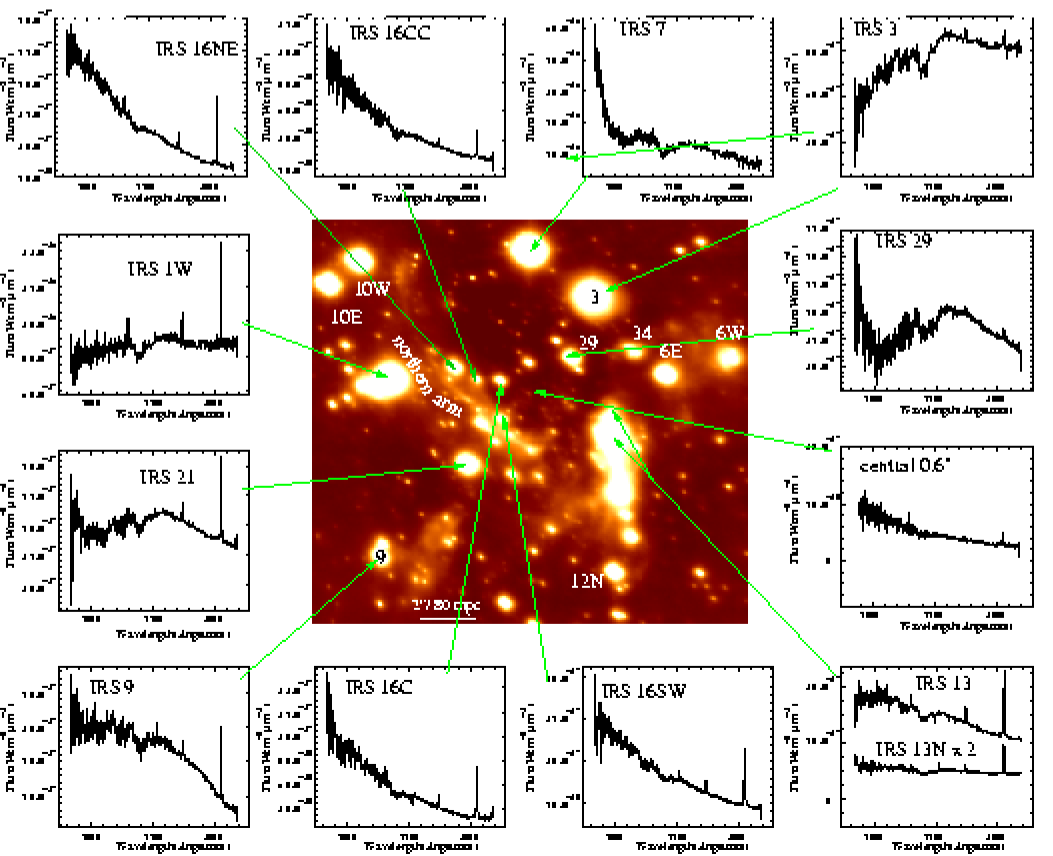
In this paper, we discuss MIR sources that are located well within the central stellar cluster at projected distances from Sgr A* of less than 0.5 pc (Fig. 1). Several sources like IRS 1, 3, and 21 are dominated by dust emission and are strong at a wavelength of 10m, whereas the supergiant IRS 7 is brightest at 2.2m. The nature of the dust enshrouded sources is still unknown. One among the best studied cases is IRS 21, which is strongly polarized (17% at 2m ; Eckart et al. 1995, Ott et al. 1999, Krabbe et al. 1995). Initially, Gezari et al. (1985) suggested that IRS 21 is an externally heated, high-density dust clump. Given the MIR excess and the featureless NIR spectra several other classifications have been proposed, including an embedded early-type star and a protostar (Blum et al. 1988, Krabbe et al. 1995, Genzel et al. 1996, Clénet et al. 2001). Tanner et al. (2002) suggest that IRS 21 is an optically thick dust shell surrounding a mass-losing source, such as a dusty recently formed WC9 Wolf-Rayet star. Tanner et al. (2002, 2003) indicate that the extended dust emission of most of the central sources is consistent with bow shocks created by the motion of massive hot stars through the dust and gas of the mini-spiral.
One way of investigating the nature of these bright NIR/MIR sources is imaging and spectroscopy in the 2 to 4m wavelength range. In addition to Hydrogen and Helium recombination lines this wavelength domain is dominated by strong absorption features due to abundant molecules (NH3, CH3OH, H2O, CO, CO2 etc…), functional groups (like NH2, CH2), and ices. Here H2O ice enriched with molecular material is of special importance. Liquid, crystalline, amorphous water ice as well as trapped water ice in SiO condensate (Wada et al. 1991) give rise to a rich variety in shapes of a prominent feature with its deepest absorption at 2.94-3.00 m (e.g. Wada et al. 1991). The variety in shapes of the water ice feature is dependent not only on temperature, but also on annealing history and on the ice composition etc… (Hagen et al. 1983, Tielens & Hagen 1982, Tielns et al. 1983, Kitta & Kratschmer 1983, Hudgins et al. 1993, Maldoni et al. 1998)
The emission of dust and the absorption features of ices are important diagnostic tools for the investigation of the interstellar medium and circumstellar environments of individual sources.
Infrared sources towards the Galactic Center show a wealth of ice absorption features (Butchart et al. 1986; Sandford et al. 1991) indicative for a broad range of organic material mostly in the diffuse interstellar medium. Aliphatic hydrocarbons are characterized by their CH2 (methylene) and CH3 (methyl) stretching modes around 3.4m (Sandford et al. 1991; Pendleton et al. 1994). Aromatic hydrocarbons are detected via their CH and CC stretching modes at 3.28 and 6.2m. (Chiar et al. 2000, Pendleton et al. 1994). An absorption feature at 3.25m has been found towards dense molecular clouds. It is attributed to aromatic hydrocarbon molecules at low temperatures (Sellgren et al. 1995; Brooke et al. 1999). Differences in the exact central wavelength and profile width of the absorption near 3.3m are mostly attributed to differences in temperature and/or carrier of the absorbing molecules in these regions.
In this paper we present 3 to 4m imaging and spectroscopy data combined with near-infrared 2.2m spectroscopy on the strongest mid-infrared sources in the central stellar cluster. In addition to the previously published L-band observations of IRS 1W, IRS 3 and IRS 7 we provide the first L-band spectra of 9 other MIR sources: IRS 9, IRS 13, IRS 13N, IRS 21, IRS 29 and IRS 16 C, CC, NE and SW. These data on sources located in the central pc of the GC enable us to study the properties of the local interstellar medium and of circumstellar matter in this region.
2 Observations and data reduction
In order to investigate the nature of the dust embedded sources within the central 0.5 pc of the nuclear stellar cluster we used near- and mid-infrared imaging and spectroscopy. In the following we describe the instrumentation and the data reduction that was employed.
2.1 MIR Observations and data reduction
The mid-infrared imaging and spectroscopy was obtained using the ISAAC instrument at the ESO Very Large Telescope (VLT) unit telescope UT1 (Antu), at the Paranal observatory in Chile. We have performed spectroscopic and imaging observations of the Galactic Center during May 23-30, 2002, as part of a monitoring program of SgrA* (Eckart et al. 2003, Baganoff et al. 2003). All the data reduction has been performed using routines from the IRAF and MIDAS software packages.
For the imaging in the L-band, paired flat fielded images at different chopper throws (18”2”) and chopping position angles (0o to 180o) were subtracted from each other, resulting in frames containing a positive and a (shifted) negative image. The frames were then shifted to a common reference point that coincides with a positive image of a source. Subsequently, frames belonging to the same batch, i.e. taken sequentially with identical or different chopper throws and/or chopping angles were combined by calculating a median. Since the images were moved to a common reference point this procedure eliminates the negative ”shadows” generated by the subtractions. This procedure also effectively removes cosmic rays and bad pixel structures. Such a batch typically consists of up to 40 images, and each resulting combined image covers an integration time of approximately 35 minutes. For the present investigation we used the images with the best seeing and image quality with an angular resolution of about 0.4”. The absolute L-band flux calibration (see magnitudes listed in Table 1) was performed using the fluxes of several bright well isolated objects also measured by Clénet et al. (2001).
The spectroscopic observations were performed with the long-wavelength (LWS3) and low resolution (LW) mode using the SL filter covering the wavelength range of 2.7m - 4.2m and 4.4m - 5.1m, respectively. The use of a 0.6” slit width implied a spectral resolution () of R=600 in that wavelength domain. The seeing at this time was ranging between 0.4 and 0.9 arcseconds. In order to compensate for the thermal background separate chopped observations were carried out using chopper throws of 18 arcseconds and random nodding within 2 arcseconds along the slit. We adopted 4 different slit positions all running through the location (see Fig. 1). The resulting images were divided by flat-fields, corrected for cosmic rays, for sky lines and dispersion related distortion. The wavelength calibration has been performed using a Xenon-Argon lamp.
Two chopped frames (with shifted image positions) were then subtracted one from each other to provide a single frame containing two negative trace images and a positive one with twice the intensity than the negative images. After extraction of the individual source spectra, they were corrected for wavelength dependent sensitivity, atmospheric transmission, and telluric lines using two standard stars HD 194636 (B4V) and HD 148703 (B2III-IV).
The spectra were normalized to the given K- and L-band magnitudes listed in Table 1.
2.2 NIR Imaging spectroscopy and data reduction
The near-infrared data in the K-band (2.2m) was obtained via integral field spectroscopy using the imaging spectrograph 3D (Weitzel et al., 1996) combined with the tip/tilt corrector ROGUE (Thatte et al., 1995) at the ESO/MPG 2.2m located at La Silla. This instrument allows observations of a continuous 2-dimensional field ( pixels) while providing spectral information for each spatial image element. These seeing-limited observations were done with a pixel scale of resulting in a field of view of for individual pointings. Using a spectral resolution of each half of the K-band had to be covered separately.
The observations were centered on the IRS 16 cluster. In March 1996, the central parsec was observed with a spectral coverage from to 2.21m (lower half of the K-band). In total 17 different but overlapping regions were observed. The total sky area covered amounts to in East-West and in North-South direction. The upper half of the K-Band from to 2.45m was observed during a second observing run in April 1996. Here a total of 52 overlapping regions was observed. This resulted in an area of in North-South direction and in East-West. For further details of the observations see (Genzel et al. 1997, Ott et al. 2003).
In order to calibrate the wavelength scale, spectral lamp data (argon lamps in this case) were taken at the beginning or the end of each observing night. As a further calibration step, calibration sources with a known spectrum were observed at a similar airmass as the Galactic Center. These standard stars were divided by a spectrum of the same stellar type (Kleinmann & Hall 1986) in order to remove stellar features resulting in an atmospheric transmission spectrum. The source data were then divided by this spectrum.
3 Extinction correction
The patchy extinction towards the GC stellar cluster (see e.g. Scoville et al. 2003) demand a careful calibration of spectral data. Therefore, the correction of the extinction along the line of sight has been carried out using the method described in Sect. 3.1 and tested using another, independent method described in Sect. 3.2. A cross-check shows that both of our approaches agree very well (see the results in Sect. 3.2.2 and the conclusion (Sect. 3.3) at the end of this section) and that the extraction of the optical depth spectra described in Sect. 4 can be done safely.
3.1 Fitting Blackbody Emission to the 2 to 4m Spectral Continua
3.1.1 Method
In order to estimate the extinction towards the individual sources and to determine the approximate continuum shape of the observed spectra, we have performed simultaneous fits of our K- and L-band data with single, reddened blackbody spectra. In this process we have considered the continuum emission, fitted locally around , , and wavelength, as representing the intrinsic, reddened continuum of the sources. In order to find the best fit, the temperature of the blackbody was allowed to vary within limits with a step size of . For the Helium stars these limits were 20,000 and 26,000 K (Najarro et al. 1997). For the remaining objects the limits were 200 K and 4,000 K. We allowed the K-band absorption to vary over a range between 2.7 to 4.5 magnitudes with a step sizes of assuming the extinction law stated by Martin & Whittet (1990). We extended the fitting range towards higher values in order to allow a search for higher extinction towards the dusty sources. In general the fitting is not very sensitive with respect to the determination of due to the strong H2O absorption feature that dominates almost the entire L-band.
There are several potential problems that one has to consider when using this procedure (see also discussion in Chiar et al. 2002):
We have to take into account that our K- and L-band data have not
been taken at the same epochs and in some cases their relative
calibration may be affected by variability. Some sources in the
central parsec of the Milky Way are variable on time scales of months
to years (Ott et al. 1999, Blum et al. 1996, and Tamura et al. 1994,
1996). In order to achieve a successful combined fit over both bands
we therefore used different overall flux calibrations of the spectra.
For the K-band fluxes, we have considered data from 5 different
references: Becklin et al. (1978), Tollestrup et al. (1989), Blum et
al. (1996), Ott et al. (1999), and Clénet et al. (2001). The
observations of Clénet et al. (2001) are the most recent of the four
references and have been obtained with Adaptive Optics. For this
reason, we have privileged the use of the values given in Clénet et
al. (2001) for the fitting procedure. However, for some sources, a
better fit was obtained when using a different flux calibration. This
was the case for IRS 7, IRS 9, the stars in the IRS 16 complex as well
as IRS 13. In the case of IRS 7 and IRS 9, these objects are variable
as shown in Ott et al. (1999), Blum et al. (1996), and Tamura et
al. (1994, 1996). The relative flux density calibration from Becklin
et al. (1978) results in the best fits for our data since their
observations in the K- and L- bands were performed in the same year.
The IRS 13 complex consists of at least three bright members, E1, E2,
and E3 (Paumard et al. 2001, Maillard et al. 2003). They contain the
hottest and most luminous star in the entire region (Najarro et
al. 1997). The IRS 13 complex therefore is very likely to be variable
in flux density. In this case the fitting results were best using the
K-band fluxes by Blum et al. (1996).
The blackbody temperatures and K-band extinction resulting from the best fit of the spectra are listed in Table 1.
Moreover, most of the spectra are heavily affected by broad absorption
features and it is difficult to determine a clear measure of the underlying
continuum emission. Also, the assumption of a single temperature
blackbody continuum can only be taken as a first approximation. On the
other hand, reddened multi-temperature models quickly result in a
larger number of not well determined parameters (e.g. temperature and
relative flux density contribution for each component).
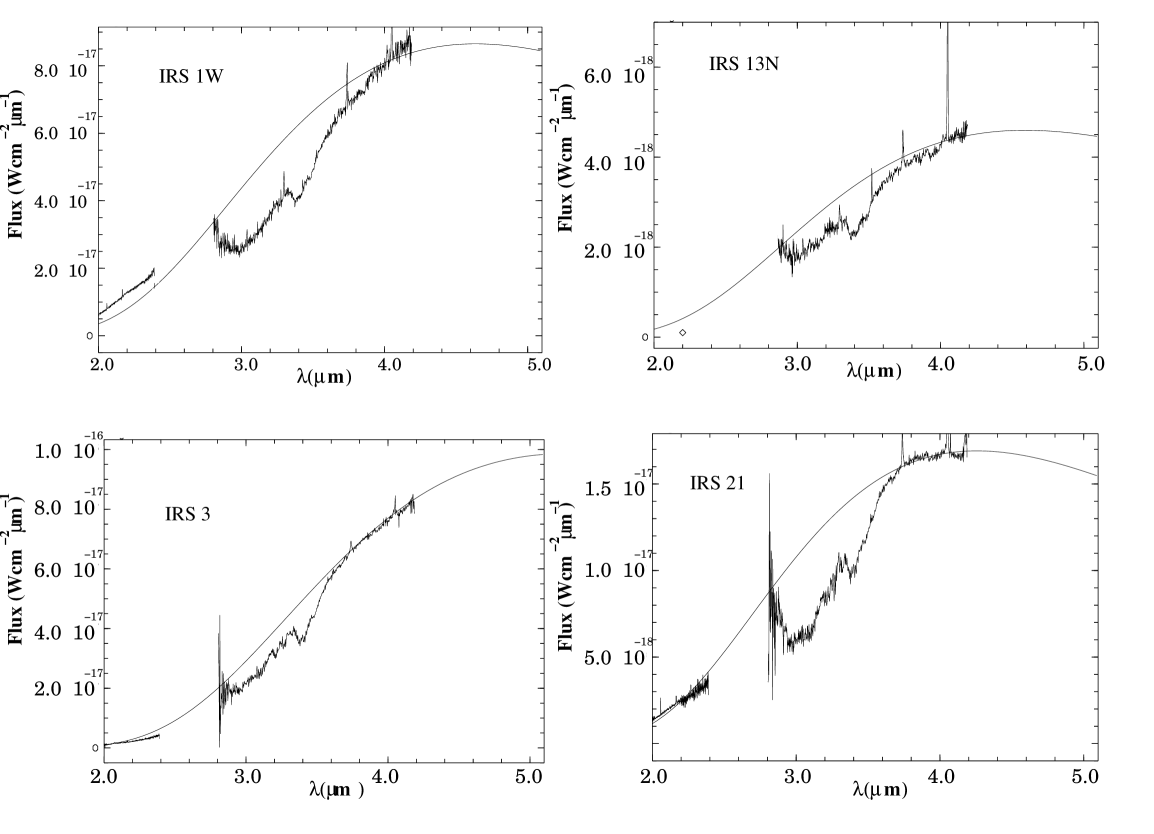
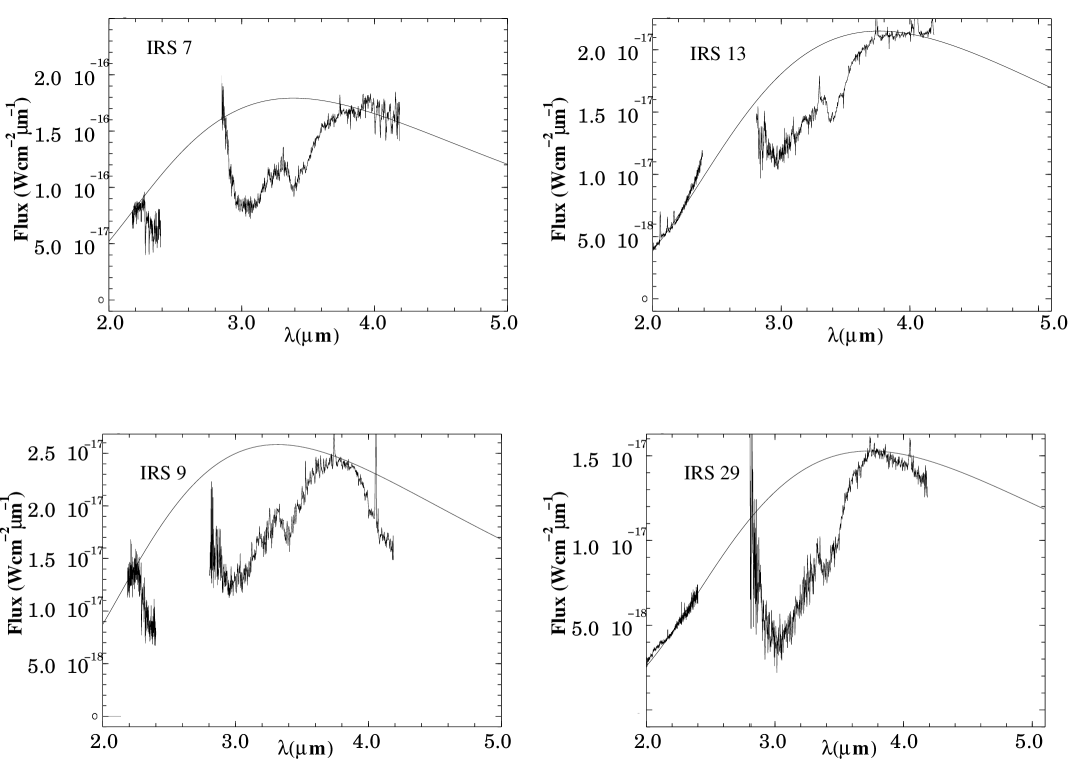
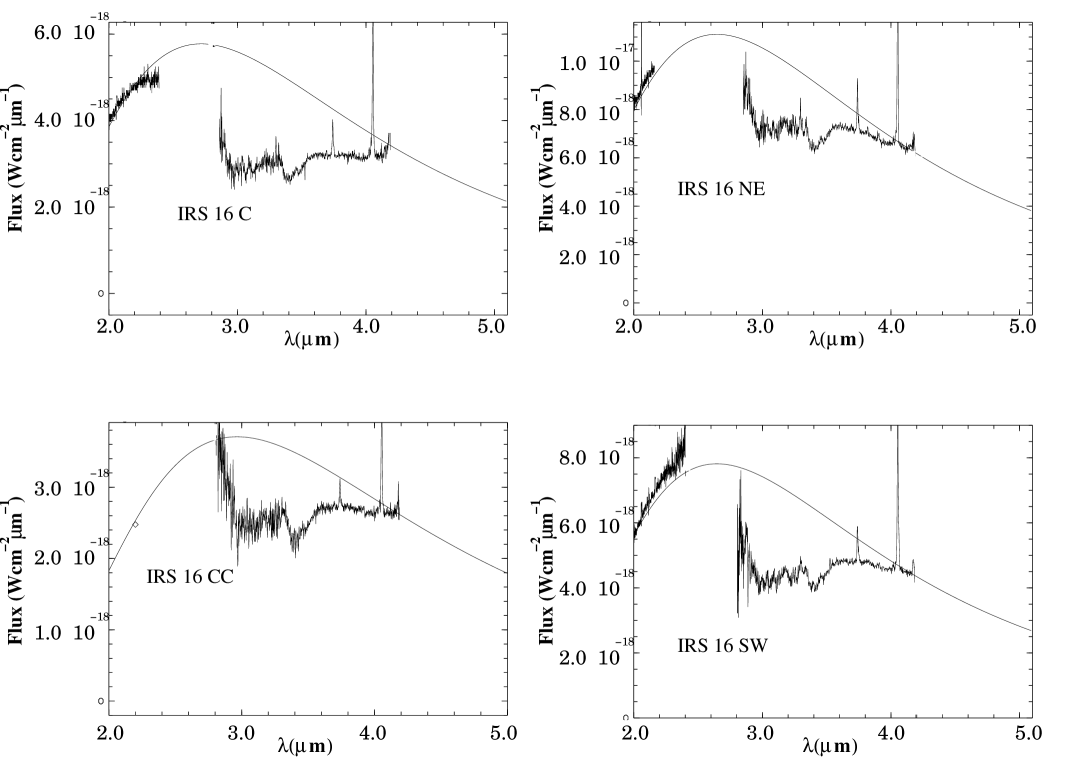
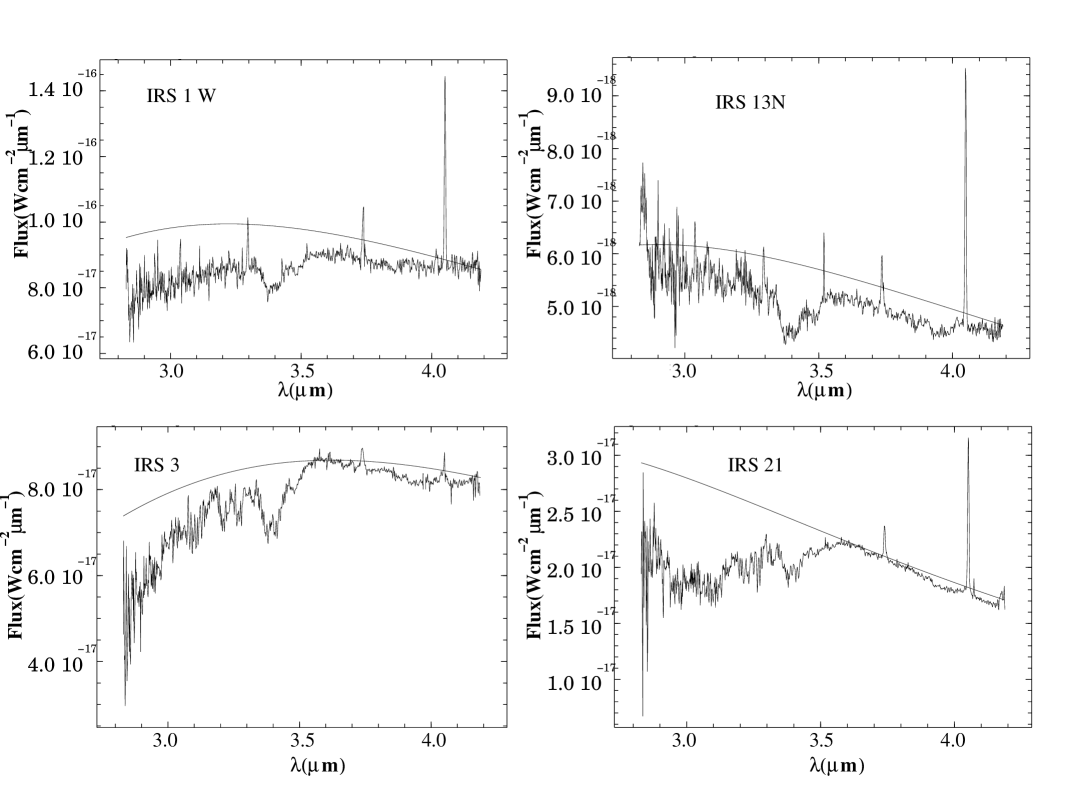
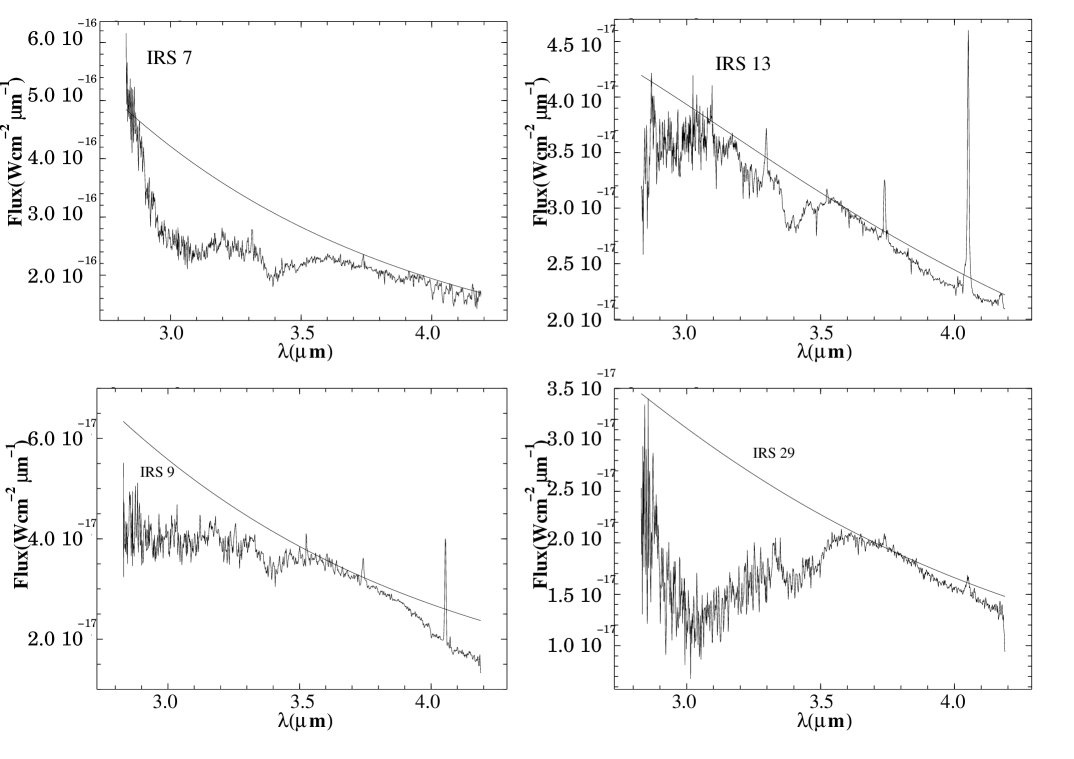
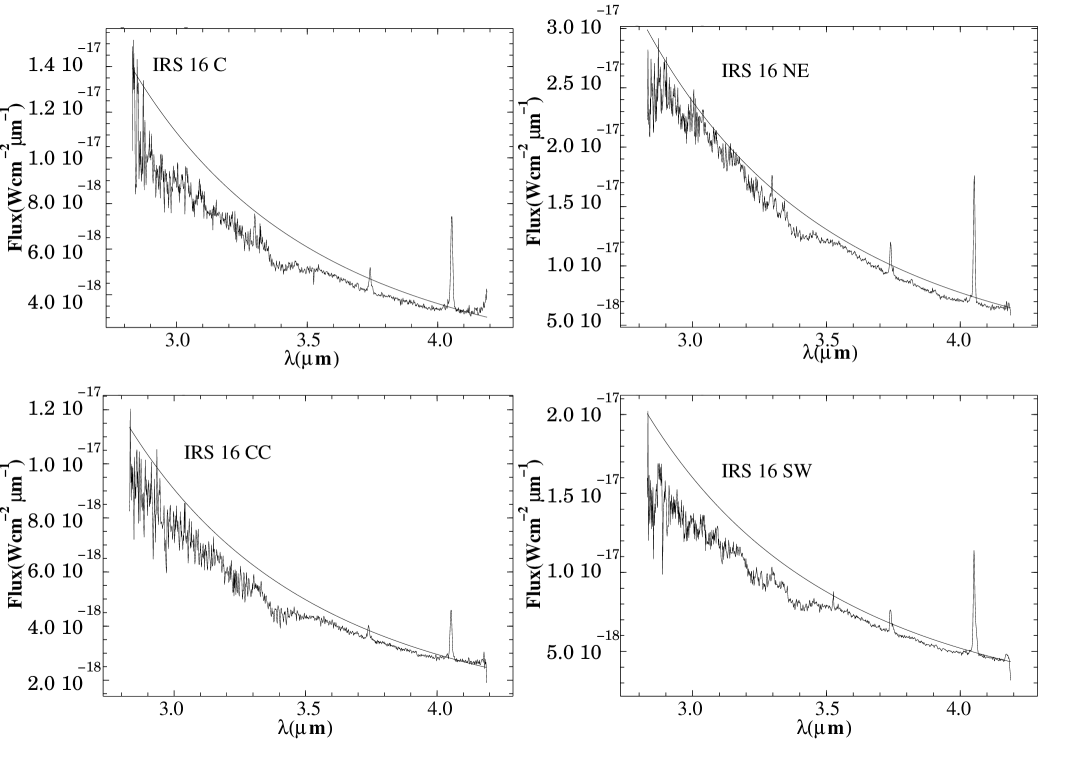
The resulting best fits of the individual spectra with a single blackbody are shown in Figs 2 to 4.
| Source | Blackbody | L-band | |
|---|---|---|---|
| Temperature | magnitude | ||
| IRS 1W | 900 | 3.30 | 5.8 |
| IRS 3 | 800 | 4.20 | 5.3 |
| IRS 7 | 2100 | 3.55 | 5.0 |
| IRS 9 | 1900 | 3.10 | 7.4 |
| IRS 21 | 1200 | 3.95 | 6.8 |
| IRS 29 | 1600 | 3.70 | 7.4 |
| IRS 16C | 22600 | 3.45 | 8.6 |
| IRS 16CC | 20200 | 4.00 | 9.0 |
| IRS 16NE | 22400 | 3.25 | 7.7 |
| IRS 16SW | 22500 | 3.25 | 8.4 |
| IRS 13 | 1300 | 3.00 | 6.7 |
| IRS 13N | 1000 | 3.90 | 9.76 |
3.1.2 Results
We list the resulting parameters of the fits in Table 1 and the spectra with the corresponding blackbody curves in Figs. 2, 3, and 4. The temperatures and the K-band extinctions derived by the fitting procedure agree well with those found by other authors: The He stars of the IRS 16 complex are best fitted with temperatures that are similar to those found by Najarro et al. (1997). IRS 7 and IRS 9 have typical temperatures of late-type supergiants or giant stars (Chiar et al. 2002, Ott et al 1999) and the remaining dusty sources are well fitted by blackbody continua of typical temperatures for hot dust (Tanner et al. 2002, Gezari et al. 1996, Genzel et al. 1997, Blum et al. 1996 and others).
The overall shapes we obtain by fitting single blackbodies are reasonable and compare favorably to those of Chiar et al. (2002) (especially in the case of the three sources in common IRS 1W, IRS 3 and IRS 7). In addition, they are supported by an independent procedure to calibrate the line of sight absorption described in the following section (Sect. 3.2). Also, the inclusion of the K-band spectra which was missing in the work by Chiar et al. (2002) allows to better judge the quality of the fitting procedure via comparison to the K-band continuum fluxes and spectral shapes, especially for the three sources in common (IRS 1W, IRS 3 and IRS 7).
Despite of the improvements in the spectral fitting, there are some mismatches we want to comment on:
The fit of the IRS 1W spectrum shown in Fig. 2 does not
match the K-band spectrum of this source and shows a continuum level mismatch in the to region
that has no physical significance. This is certainly due to a non-consistency
between the flux calibrations in the K- and L- spectral bands.
For this reason, we decided to set an upper and a lower limit to the fit by
performing a fit matching perfectly the K-band spectrum without caring about the adjustement at the red part of the spectrum on the one hand
and another fit compensating the non physical mismatch at m.
An absorption at m appears in the spectra of IRS 9 and IRS 29. This suppression in flux is hardly an artefact of the data reduction, since we used the same procedures as for the other sources. We have no scientific explanation for that suppression but considered it as real. Also, both in shape and center wavelength, it does not seem to be consistent with the closest (at ) strong absorption line due to the stretching mode resonance of solid also observed towards the dust shells of some Young Stellar Objects (de Graauw et al. 1996). The presence of this suppression does not affect results presented and conclusions drawn in this paper.
Concerning the IRS 16 objects, all fits were not very satisfying
towards the red part of the L-band spectrum and match perfectly well the K-band spectra. It is obvious that this is not due to the fitting procedure itself but to the shape of the L-band spectra of these sources which are very flat (except for the IRS 16 NE case where the shape matches better the overall shape of a Rayleigh-Jeans spectrum). These spectra have been reduced in the same way as all the other spectra with the same flux calibrator stars and thus the shape of the spectra is real.
The origin of this behavior is not clear. It may be due to the fact
that these sources are the least contaminated by local dust emission
features and are likely most susceptible to variations in the
wavelength dependent line of sight extinction or of properties of the
associated material. If for instance - compared to the intrinsic,
local absorptions of the dusty sources - the line of sight absorption
is dominated by amorphous H2O ice (Wada et al. 1991), the
corresponding line center and strength of the red wing would be
shifted towards the red. As a result the slope of the reddened
continuum simultaneously fitting the K- and L-band continuum would be
systematically too large.
3.2 Determining the Wavelength-Dependent Line of Sight Extinction
3.2.1 Method
The calibration procedure described in this section is supported by
the finding of Scoville et al. (2003) that the extinction shows a
smooth distribution across the central 10 to 20 arcseconds with no
indication of concentrations of extinction on scales of about 1” to
2”. Furthermore Blum et al. (1996) and Clénet et al. (2001)
concluded that the colors of the sources within the central stellar
cluster are due to both, intrinsic and foreground reddening.
One of the slit settings we adopted for our observations runs through
a late-type star shown in Fig. 1. This star
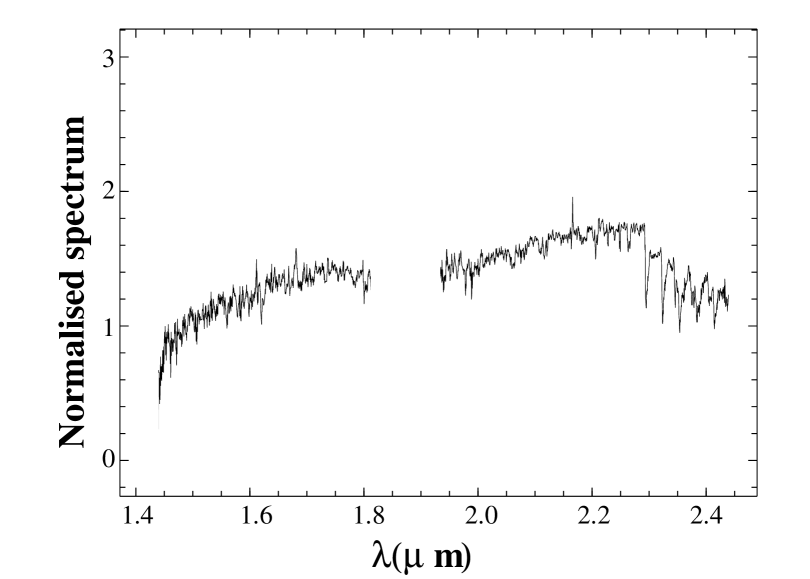
shows clear 2.3m CO absorption band-heads in its K-band spectrum (see Fig. 6), therefore, we will call it hereafter “CO-star” (e.g. Eckart et al. 1995).
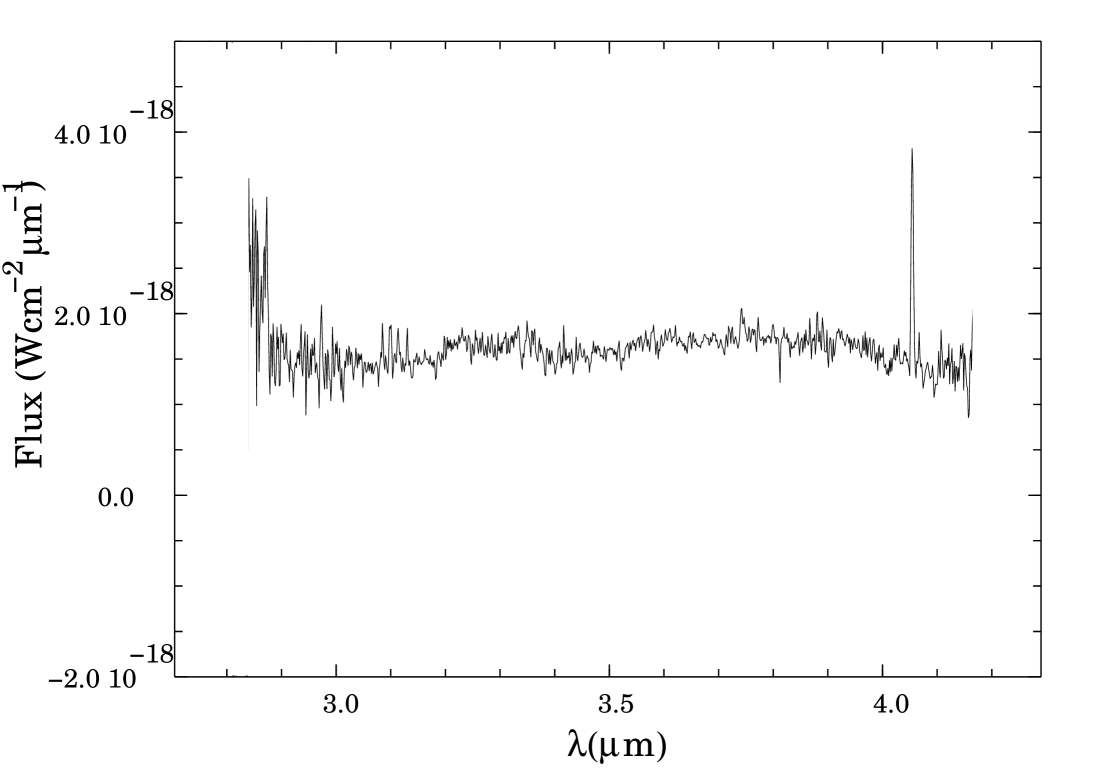
It is located at a projected distance of 12.6“ ( pc)
from the center, is well off the mini-spiral emission and does not
show excess emission at wavelengths of 3m or longer (see the L-band spectrum in Fig. 7).
Therefore we can safely assume that this star is largely free of local reddening and that its spectrum is mostly affected by the line
of sight extinction along the 8 kpc towards the Galactic Center.
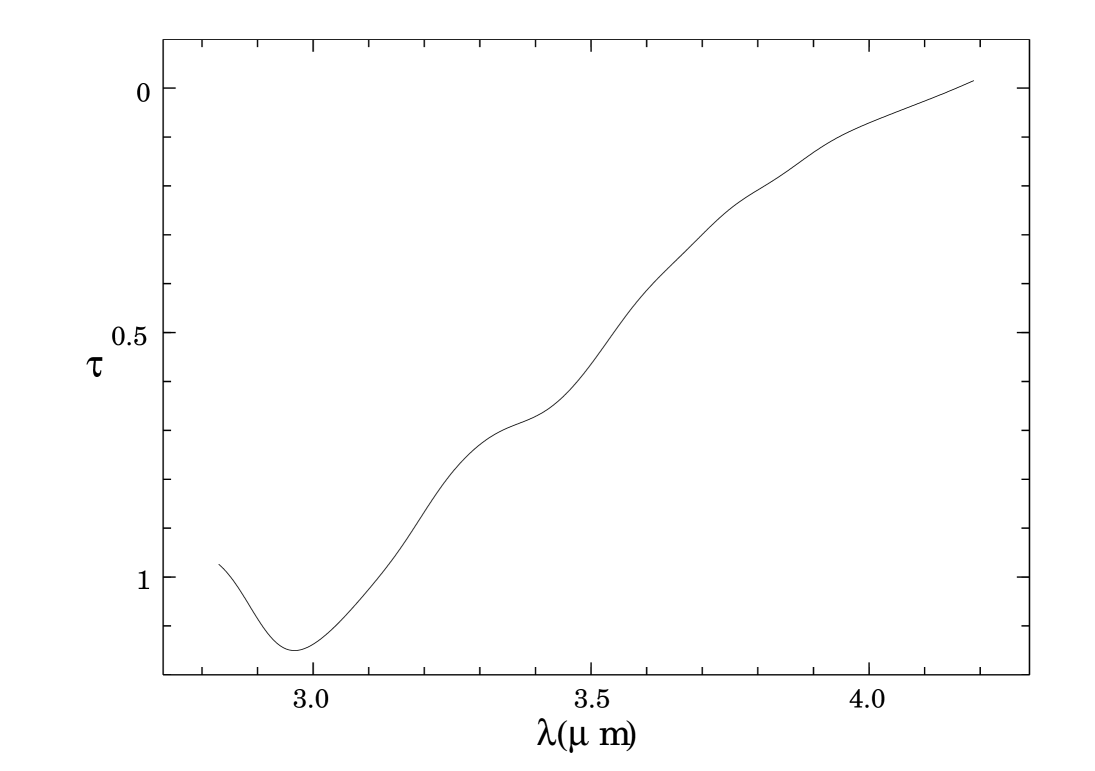
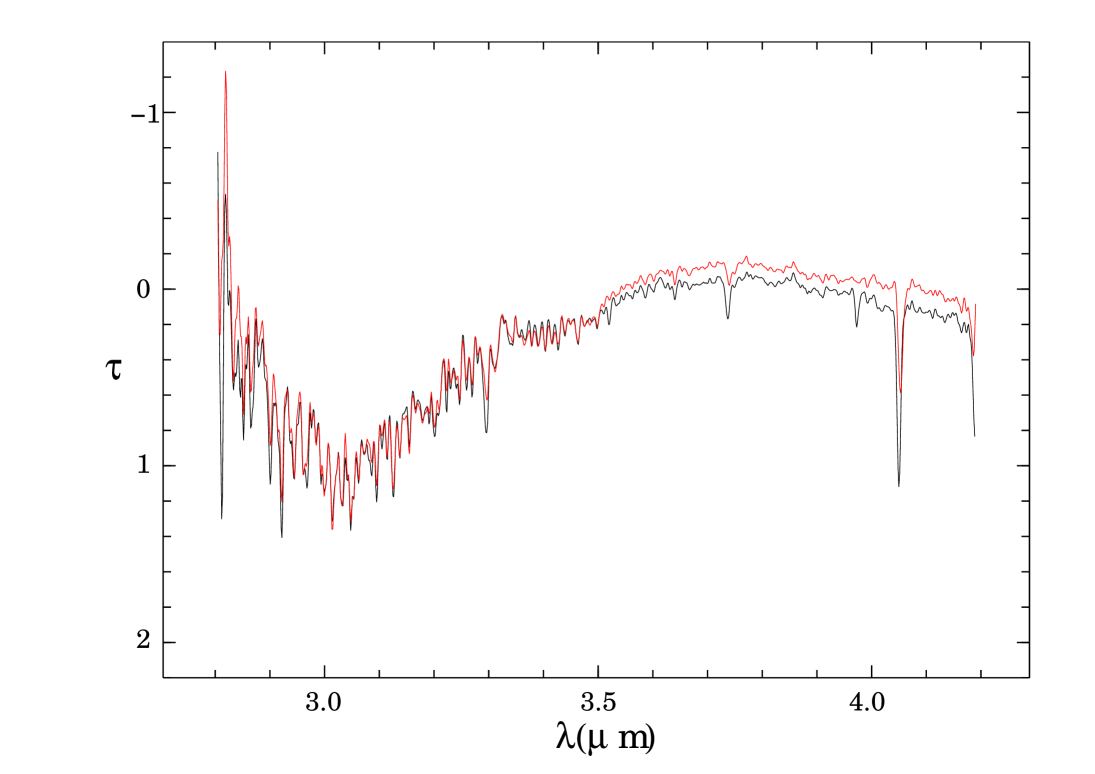
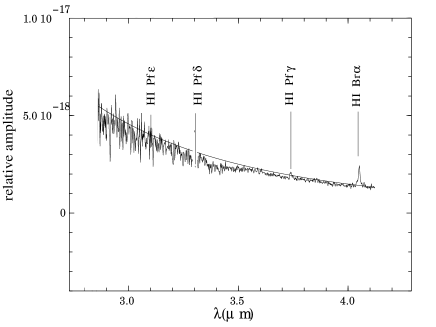
We assume that the L-band spectrum of the CO-star can be represented by a 3600 K (M0-M3 spectral type) blackbody spectrum. If one matches the 4.2m flux densities of the measured L-band spectrum and the theoretical continuum blackbody spectrum then the ratio between both spectra provides a measure of the relative wavelength dependent ice feature dominated L-band absorption due to the interstellar medium along the line of sight. The corresponding optical depth spectrum is shown in Fig. 8. If we correct this spectrum with the continuum optical depth value at of =1.09 (derived via interpolation between the expected L- and M- band extinctions given by Rieke & Lebofsky 1985) the mean optical depth would be of the order of . This result is consistent with the value of obtained by Rieke & Lebofsky (1985) for the L-band optical depth. We have divided the spectra of all remaining objects by this extinction spectrum (of which the optical depth spectrum is shown in Fig. 8). The resulting spectra then represent probably more closely the source spectra as seen at the location of the Galactic Center - corrected for wavelength dependent absorption along the line of sight towards the Galactic Center.
3.2.2 Results
We show the spectra after correction for wavelength-dependent
absorption together with our L-band image in
Fig. 5.
In Figs. 9 to 11, the spectra
corrected for the measured wavelength-dependent line of sight
extinction as determined from the CO-star are shown in comparison to
the continuum spectra that were derived by fitting the non-corrected spectra with a single reddened blackbody
(Sect. 3.1).
We find that they can be grouped into
three classes represented by the three figures.
-
•
I. As shown in Fig. 11, the spectral shapes of the hot stars found in the IRS16 complex are fitted well by Rayleigh Jeans continuum spectra i.e. high temperature blackbody spectra (listed in Table 1).
The slight mismatch between the blackbody spectra and the calibrated observed spectra in the red part of the L-band wavelength range corresponds to the one between the uncorrected spectra and the reddened blackbody continua shown in Fig. 4. Its origin is, thus, probably the same as mentioned in the previous section. -
•
II. The corrected spectra of IRS 1W, IRS 3, IRS 13N and IRS 21 (Fig. 9) are flat in the red part with indications of continuum absorption at wavelengths short-ward of . The spectra can be roughly explained by a T1500 K blackbody continuum, with deviations at wavelengths due to the red wing of the ice absorption feature.
- •
3.3 Conclusion on the extinction correction
The comparison of the corrected spectra from extinction (using the CO-star) and the blackbody continuum spectra with temperatures equal to the ones obtained by the fitting procedure (Sect. 3.1 and Table 1) shows that the overall shape of the corrected spectra is consistent with the blackbody continuum shape of the corresponding balckbody temperature. The dusty sources are fitted well with blackbody temperatures of the order of and the global spectral shape of the hot Helium stars in the IRS16 complex closely resembles pure Rayleigh Jeans spectra. This implies that the L-band optical depth spectrum of Fig. 8 is consistent with the extinction law of Martin & Whittet (1990) (see section 3.1) and with the known absorption value toward the Galactic Center (Rieke & Lebofsky 1985). Consequently, the fitting procedure made in Sect. 3.1 is reliable and one can use the reddened continua obtained in that section in order to derive optical depth spectra. The extraction of the optical depth spectra is described in the next section. In the following, we do not make use of the corrected spectra obtained in Sect. 3.2 because small absorption features could still be present in the spectrum of the correction CO-star which may affect the optical depth measurments.
In addition, the good agreement between the two calibration procedures implies that the overall variation in extinction across the central 0.5pc of the Milky Way cannot be much larger than =0.5 magnitudes. This is consistent with the results by Scoville et al. (2003) who derived extinction estimates from the P/6cm radio continuum and the P/H92 line emission over this central region. These estimates result in a distribution which is smooth on the 1” scale. This supports the assumption that the excess extinction seen towards some of the sources must in fact be associated with the individual objects rather than with the diffuse ISM (see Blum et al., 1996; Clénet et al., 2001).
4 Optical Depth Spectra
4.1 Extraction of Optical Depth Spectra
As it has been pointed out in the previous section, the optical depth spectra of the Galactic Center sources can be obtained using the reddened blackbody continua of the fitting procedure (Sect. 3.1 and Figs. 2 to 4).
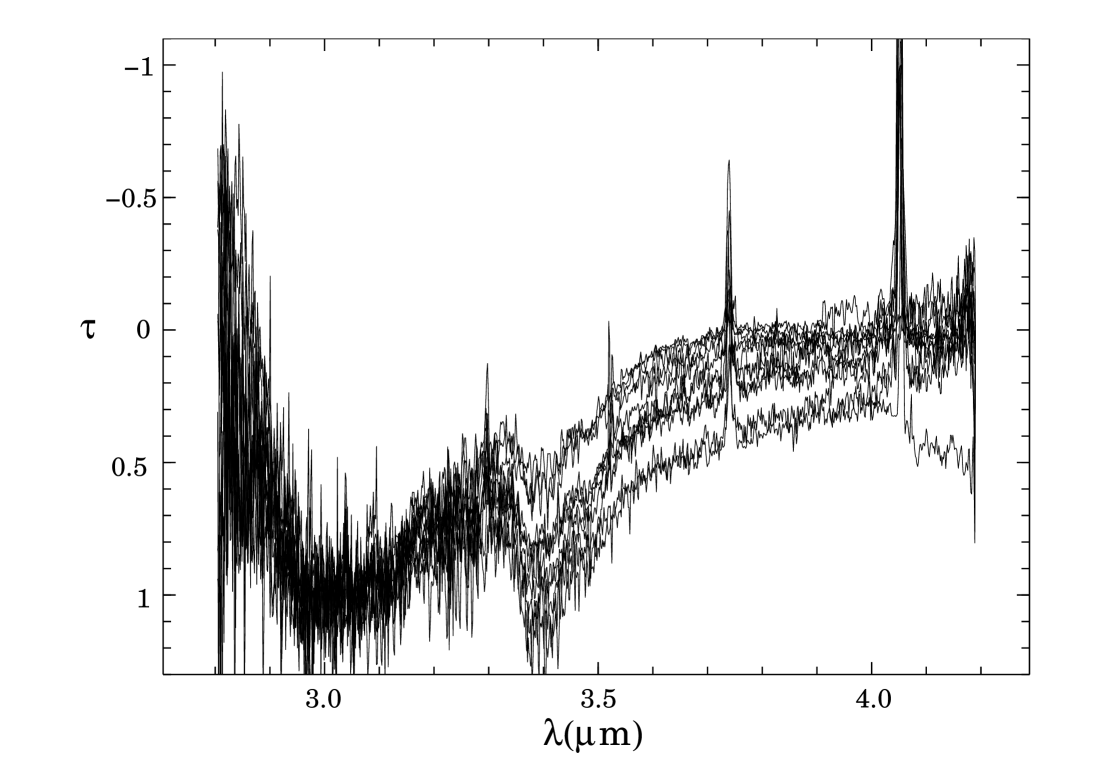
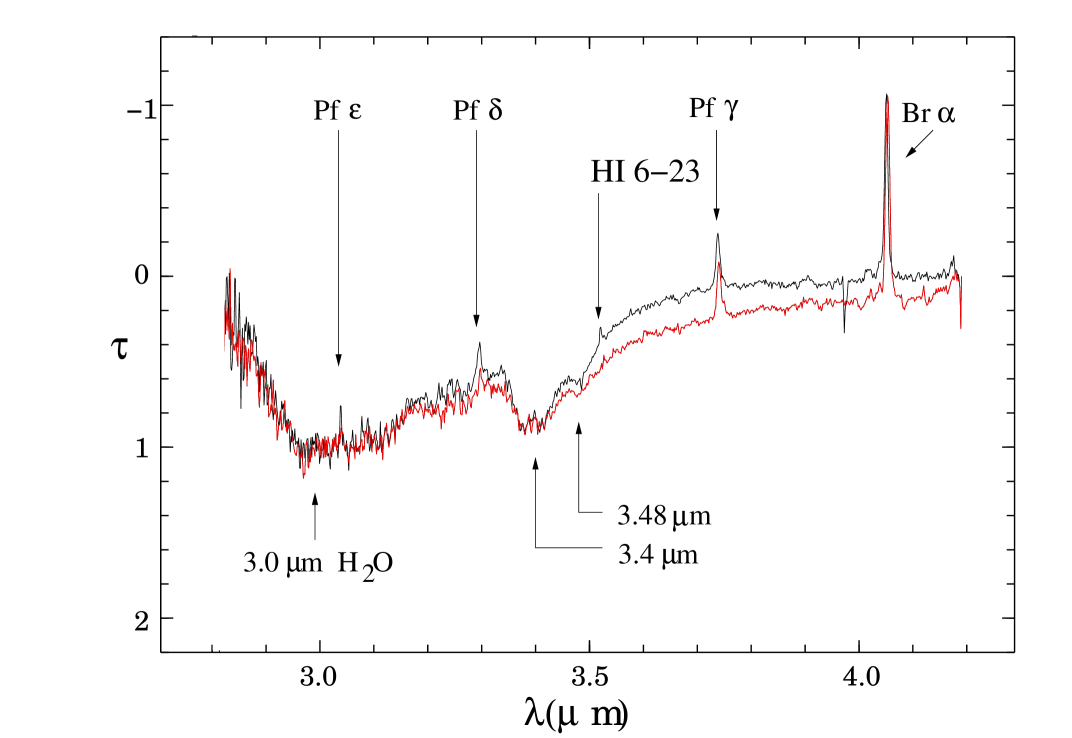
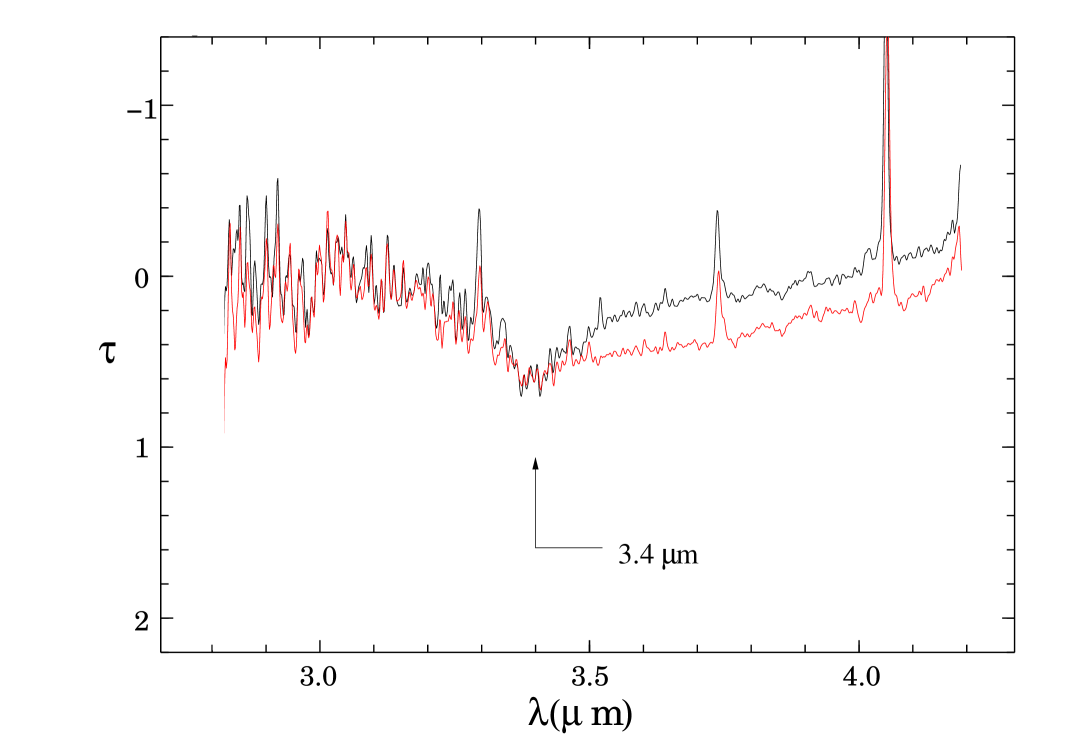
With the results of the blackbody fitting (Table 1), we have derived the optical depth spectra of the sources using the equation where is the optical depth, and and Fintr are the observed and intrinsic fluxes, respectively. All the spectra are shown in Fig. 12 where they have been normalised to unity at . Mean optical depth spectra for the dust enshrouded sources and the non-obscured sources are shown in Fig. 13. This figure shows very clearly three absorption features at , and . From Fig. 12, it is evident that the absorption depths of the , and features vary from source to source.
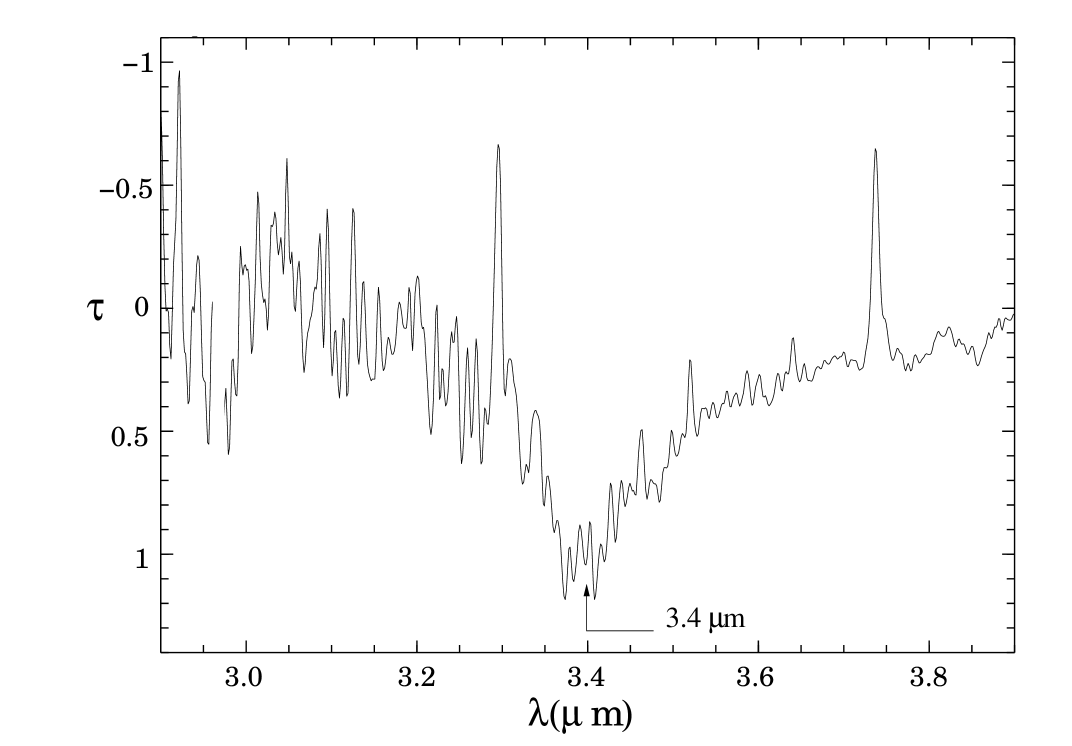
Mean spectra of the hydrocarbon feature at and the ice feature at have been constructed in the same iterative way as in Chiar et al. (2002). The optical depth spectrum of IRS 29 shows the smallest absorption in comparison to the feature. A first mean spectrum of the feature was obtained by subtracting the optical depth spectrum of IRS 29 from all other spectra. Then the average spectrum of the residual spectra was derived. The mean water profile spectrum is then obtained by subtracting the average spectrum of the hydrocarbon feature multiplied by a free scaling parameter. This parameter is adjusted such that a featureless spectrum is obtained in the region after subtraction from the mean source spectrum. Finally, the spectrum of the hydrocarbon feature was deduced by subtracting the mean spectrum from all the spectra and averaging the residuals. The resulting spectra are shown in Figs. 14 and 15.
The most reliable results were obtained for the dust enshrouded sources. As a consequence of the successful continuum fits described in Sect. 3.1, the absorption spectra level out at 0.0 for wavelengths well above and well below the corresponding absorption features. For the hot He-stars in the IRS16 cluster the situation is different. Here the continuum fits were less successful (see discussion in Sect. 3.1) and the derived profile of the absorption features are less reliable towards the long wavelength end of the spectra. This is less severe for the feature since in this case only the continuum long-ward of 3.5m is affected.
4.2 Characteristics of Features in the Optical Depth Spectra
An examination of the optical depth spectra reveals information on the origin and physical conditions of the absorbing material in the central parsec of the GC stellar cluster. We distinguish the following features:
-
•
The feature: The dusty sources (which are located in the minispiral area like IRS 1W, 3, 13, 13N and 29) and hot He-stars (i.e. showing He emission lines in their K-band spectra which is the case for the IRS 16 sources, e.g. Najarro et al. 1997) allow to derive both the linewidth and line minimum of the 3.0m absorption feature. Both quantities are not affected by the slight continuum mismatch at wavelengths above m in case of the He-stars. The absorption feature is associated with interstellar ice in molecular clouds (Gillett & Forrest 1973). Laboratory experiments suggest that the shape of the observed ice absorption (which is deepest at about 2.95m in IRS 7 for example) toward the Galactic Center corresponds to trapped water ice in SiO condensate (Wada et al. 1991).
Our mean absorption spectrum (Fig. 14) shows, however, that in our observations the deepest absorption occurs m longward of 3.0m. This behavior is consistent with the presence of amorphous ice (Wada et al. 1991).
Our mean spectrum of the 3.0m ice feature appears to be narrower than the one obtained by Chiar et al. (2002). As modeled in their paper, the 3.0m ice feature derived by the authors is best fitted by a temperature of 10K and a maximum mantle thickness of 0.75 to 0.85 assuming the simple model of core-mantle grains of Bohren & Huffman (1983) and the hypothesis of a variable mantle thickness of Smith et al. (1993).
-
•
The 3.4m and 3.48m features are known to arise in the diffuse interstellar medium. They are both part of a single line complex (Duley & Williams 1983) and have already been seen towards many Galactic Center sources (Sandford et al. 1991, Pendleton et al. 1994, Chiar et al. 2002, Mennella et al. 2003). They are most likely due to aliphatic hydrocarbons which are characterized by their CH2 (methylene) and CH3 (methyl) stretching modes (Sandford et al. 1991, Sellgren et al. 1995, Brooke, Sellgren & Geballe 1999, Grishko & Duley 2002, Butchart et al. 1986, Duley & Williams 1984).
Actually, the m feature is composed of two bands, one at m and the other at m. These are due to the asymmetric stretching vibrations of and groups respectively (Sandford et al. 1991).
The m seen in all spectra (see also the mean optical depth spectrum in Fig. 13) is due to the perturbed symmetric C-H stretching vibrations of the same and groups (Sandford et al. 1991). This feature was already reported by Allen & Wickramasinghe (1981), Jones et al. (1983) and Butchart et al. (1986).
| Object | lower limit | |||
|---|---|---|---|---|
| IRS13 | ||||
| IRS13N | ||||
| IRS16C | ||||
| IRS16CC | ||||
| IRS16NE | ||||
| IRS16SW | ||||
| IRS1W | ||||
| IRS21 | ||||
| IRS29 | ||||
| IRS3 | ||||
| IRS7 | ||||
| IRS9 |
4.3 Measurements of the strengths of the Absorption Features
The optical depths of the 4 absorption features at , and are listed in Table 2.
The values are obtained by averaging the optical depth spectra over
the wavelength intervals ]2.95,3.05[, ]3.35,3.45[ (including thus the two bands of the feature) and ]3.43,3.53[, respectively. The and optical
depths are measured in the spectra from which the ice
absorption feature was subtracted (see Sect. 4.1).
The error bars listed in the table take only into account the measuring uncertainties, except for the feature of the IRS 1W case where the error bar is taken such that the optical depth value includes its upper and lower limits obtained by fitting upper and lower baselines as described in Sect. 3.1.2.
To estimate the lower limit of the optical depth values of the absorption feature, we measured the value of the strength of this feature using a linear continuum between and as baseline. The obtained values are listed in Table 2.
Table 2 shows that the optical depth values span a large interval suggesting that part of the absorption features arise probably from the local medium and may be associated with the individual sources.
Concerning the optical depth values of the feature, they agree well with the values obtained by Chiar et al. (2002) for the two sources in common IRS 1W and IRS 7. The feature of these two sources exhibits higher values than those of Chiar et al. (2002). This is probably the result of the derivation of the
isolated ice absorption feature described in Sect. 4.1
which is sensitive to the choice of the subtracted spectrum (here the
spectrum of IRS 29). In particular, in Chiar et al. (2002), the
authors find a negative optical depth value at for IRS 7
due to the shape of the ice feature which is narrower than the mean
ice absorption feature. Moreover, their optical depth value of the feature of IRS 7 is even smaller than the lower limit obtained in our spectrum.
Concerning the IRS 3 source results, no comparison can be done with Chiar et al. (2002) as the fit of their spectrum was not satisfactory and did not match at all the K-band point flux. This may be due to the problematic relative flux calibration of their L-band spectrum which shows a different slope than ours.
On the other hand, the lower limits of the optical depth values of the hydrocarbon feature for the IRS 3 and IRS 7 sources in common with Sandford et al. (1991, 1995) and Pendelton et al. (1994) agree well with those obtained by these authors. This is very satifactory as the values provided in these papers were derived using a linear fit similar to the one used here to derive the lower limits.
4.4 Correlations Between the Strengths of the Absorption Features
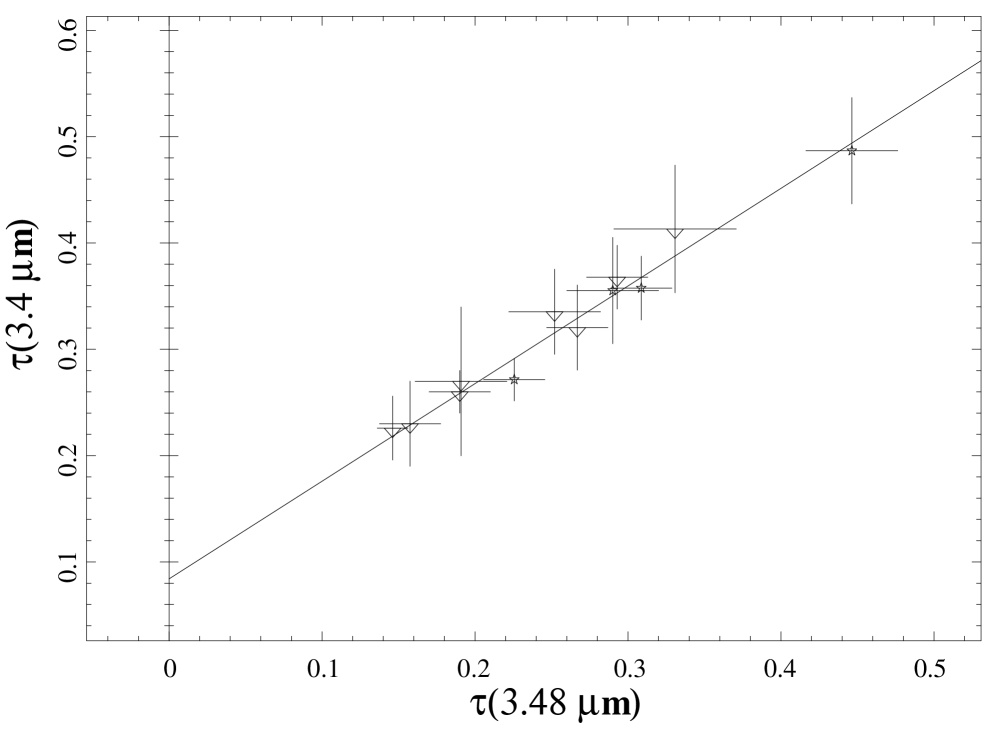
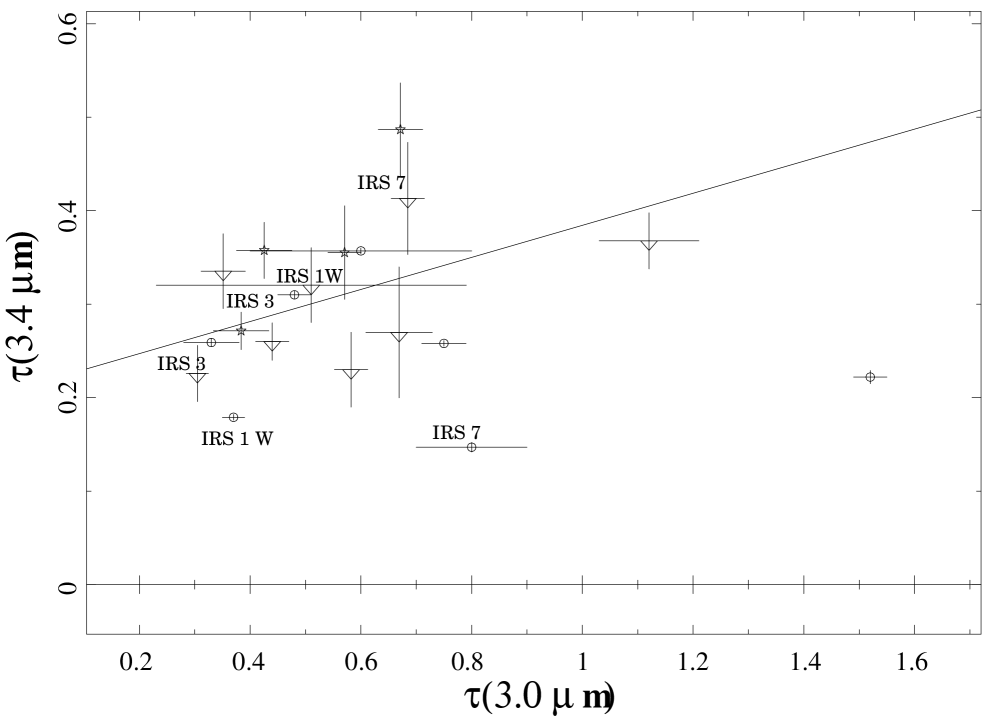
The plots of the optical depths of the absorption features at versus and versus are shown in Figs. 19 and 18 respectively. In these figures we also plot the data by Chiar et al. (2001) that were mostly obtained on sources in the outer parts of the central stellar cluster.
We find a good correlation (correlation coefficient of ) between the and absorption features (Fig. 18) and a trend of correlation (correlation coefficient of ) between the and features (Fig. 19). In Figs. 18 and 19, the best fits of linear regression are drawn as well; the goodness of fit probabillities are respectively and . The first correlation is forseeable since both features (at and ) arise from the same functional groups as explained in Sect. 4.2.
The possible correlation between the optical depths of the and features shown in Fig. 19 suggests that the ISM in the central region is a mixture of diffuse and dense material. On the other hand, if this correlation is real, then in this plot the discrepancy between the positions of IRS 7 derived by us and by Chiar et al. (2002) cannot only be due to the variability of the source. In the case of variability, both positions should follow the overall trend of the correlation. Actually, the discrepancy between the positions of the 3 sources (IRS 1W, IRS 3 and IRS 7) in common with Chiar et al. (2002) is due to the same reasons evoked previously in Sect. 4.3.
The fact that the to absorption feature “correlation” shows a significant offset from the origin of the coordinate system used for display may indicate that there could be a significant line absorption even if the water ice feature were not present. Therefore we may conclude that a certain amount of the 3.4m line absorption is due to the diffuse ISM on the line of sight to the Galactic Center. Due to the low density of the mini-spiral gas a substantial amount may, in fact, be closely linked to the individual sources that we are studying here in detail. Therefore, the remaining portion of the absorption may occur in the central parsec. This is also supported by the finding of Sandford et al. (1995) who derived anomalously high aliphatic CH absorption per visual extinction relative to all the other lines of sight for which data was then available.
4.5 Hydrogen emission lines
The obtained L-band spectra also allow us to investigate the HI line emission
towards selected lines of sight.
The corresponding line strengths, widths and equivalent widths for
Br, Pf, and Pf are listed
in Tables 4, 5, and 6.
At the achieved spectral resolution we cannot distinguish
between the emission from
the individual objects and the mini-spiral.
The latter seems to dominate the emission
since sources on or close to the mini-spiral
(IRS 1W, 16NE, 16SW, 21, 13, 13N),
also show the strongest line emission.
Especially for IRS 21 the K-band spectrum by Ott et al. (1999)
suggests that probably all
the hydrogen line emission is due to the mini-spiral.
Using the and line strengths published by
Najarro et al. (1997) we can calculate the diagnostic line ratios
and
for three of the IRS 16 sources.
The results are shown in Table 3.
In order to obtain dereddened line strengths, we have considered an absorption
in the L-band wavelength range of consistent with our optical
depth spectrum of Fig. 8 as well as the value given
by Rieke & Lebofsky (1985).
Taking the dereddened ratios at face value and omitting possible small
contributions from the He line emission close to P and Br
line we can derive first estimates about the temperature and density
of the emitting gas.
Assuming case B recombination, for both sources IRS 16NE and IRS 16C
the line ratios are consistent with emission from gas at low temperatures
of K and low densities of 102cm-3.
For IRS 16SW the ratios are more consistent with emission from a gas at
high temperature K and high density cm-3.
While it cannot be excluded that the emission towards IRS 16SW contains a
significant contribution
from the hot stellar atmospheres of the He-star IRS 16SW and the other
neighboring hot stars in the IRS 16 complex,
this result reflects the complex density and temperature structure
within the mini-spiral that consists of a thermal plasma of
ne104cm-3 at T104 K
(e.g. Brown, Johnston, & Lo 1981)
with denser entities of nH105cm-3 and a few 100 K
(e.g. Jackson et al. 1993).
| Object | ||
|---|---|---|
| IRS16NE | ||
| IRS16C | ||
| IRS16SW |
4.6 L-band spectrum at the position of SgrA*
Our ISAAC L-band imaging and spectroscopy was part of a flux density monitoring program of SgrA* (Baganoff et al. 2001, 2003 and Eckart et al. 2004) which has been carried out simultaneously to CHANDRA observations. Therefore all slit settings were defined such that the position towards SgrA* always fell into the slit. A mean extinction corrected spectrum at that position is shown in Fig. 17. Here the weak hydrogen recombination lines are most likely due to emission from the mini-spiral. The Rayleigh Jeans shape of the continuum spectrum compares well to that of other hot stars, like the He stars in the central cluster. In Fig. 17 we show the L-band spectrum of SgrA* compared to a 22,200K blackbody spectrum. In fact, high resolution adaptive optics L-band images were taken in August 2002 with NAOS/CONICA on the VLT UT4 during the science verification phase (Clénet et al. 2003, Genzel et al. 2003, Eckart et al. 2004).These images show that at the position of SgrA* the L-band flux density is dominated by the fast moving star S2 (Schödel et al. 2003). Our spectrum is consistent with the fact that based on its K-band luminosity spectrum S2 is likely to be a 15-20 solar mass late O, early B main-sequence star of age less than 20 Myr (Gezari et al., 2002; Eckart et al., 1999; Figer et al., 2001; Ghez et al., 2003).
| Object | Line-Continuum of HI (4.051) | Integral of HI (4.051) | EW of HI (4.051) | Line width |
|---|---|---|---|---|
| Å | Å | |||
| IRS 1 W | ||||
| IRS 3 | ||||
| IRS 7 | - | |||
| IRS 9 | ||||
| IRS 21 | ||||
| IRS 29 | ||||
| IRS 13 | ||||
| IRS 13 N | ||||
| IRS 16 CC | ||||
| IRS 16 C | ||||
| IRS 16 NE | ||||
| IRS 16 SW |
| Object | Line-Continuum of HI (3.739) | Integral of HI (3.739) | EW of HI (3.739) | Line width |
|---|---|---|---|---|
| Å | Å | |||
| IRS 1 W | ||||
| IRS 3 | ||||
| IRS 7 | ||||
| IRS 9 | ||||
| IRS 21 | ||||
| IRS 29 | ||||
| IRS 13 | ||||
| IRS 13 N | ||||
| IRS 16 CC | ||||
| IRS 16 C | ||||
| IRS 16 NE | ||||
| IRS 16 SW |
| Object | Line-Continuum of HI (3.296) | Integral of HI (3.296) | EW of HI (3.296) | Line width |
|---|---|---|---|---|
| Å | Å | |||
| IRS 1 W | ||||
| IRS 3 | - | |||
| IRS 7 | ||||
| IRS 9 | - | |||
| IRS 21 | - | |||
| IRS 29 | - | |||
| IRS 13 | ||||
| IRS 13 N | ||||
| IRS 16 CC | - | |||
| IRS 16 C | ||||
| IRS 16 NE | ||||
| IRS 16 SW |
5 IRS 13N
Well within the central stellar cluster of the Milky Way, about 0.5” north of the IRS 13 complex,trend in Eckart et al. (2004) have found a small cluster (0.13 light years) of compact sources with a strong infrared excess and obtained a first spectrum of it. The integrated spectrum of that area clearly shows that this excess is due to the contribution of warm T=500 - 1000 K dust. The nature of these newly found sources is currently unclear. Eckart et al. (2004) discuss three possible explanations. The L-band excess sources north of the IRS 13 complex could be heavily extincted luminous stars. They could also be hot stars that heat and interact with the more ambient environment of the local mini-spiral. Finally these newly found objects may even be young stars and their L-band excess may be due to the flux density contribution of luminous accretion disks. While a combination of the first two possibilities currently cannot be entirely excluded, the luminosities and colors of these sources are consistent with those of young stellar objects. As described in Sect. 3.1, a reddened blackbody continuum was also fitted to the IRS 13N spectrum considering the K- and L-band fluxes given by Eckart et al. (2004) (see Figs. 3 and 10 and Table 1). The resulting temperature and K-band extinction agree well with the above explanations. The extinction of about mag in the K-band is by about higher than the overall line of sight extinction toward the Galactic Center and a 1000 dust temperature emission agrees well with the highly dust embedded YSO’s as studied by e.g. Ishii et al. (1998). The ice absorption feature often observed towards YSO’s (see Ishii et al 1998) is not detectable in the extinction corrected spectrum shown in Fig. 9; this may in part be due to the small absorption in the spectrum of the late-type CO-star that reverberates on the spectrum of the extinction along the line of sight (Fig. 8). It is also possible that the circumstellar material is affected by the intense radiation field at the Galactic Center (Lutz et al. 1996). In this case the ices in the disks of young stars may become either tenuous and/or destroyed by hard-UV photons.
6 Summary and Conclusions
Combined NIR and MIR spectroscopic observations of sources in the central pc parsec of the Milky Way allowed us to obtain a detailed picture of the absorption features visible in the spectra towards that region. Our investigation on the central sources (radius 2.5”) complements the study by Chiar et al. (2002) that mostly includes sources with larger separations from the center. We find some evidence that the diffuse ISM in the pc has properties that are slightly distinct from the ISM at larger distances from the center.
The 3.0m ice profile usually observed toward the Galactic Center peaks at 2.96m, short-ward of the ice feature in local molecular clouds (McFadzean et al. 1989; Tielens et al. 1996; Chiar et al. 2000). It is likely due to cold (15 K) water ices with an enhanced NH3 abundance (Chiar et al. 2000). Especially processed ices contribute a substantial portion of the refractory grain materials that persist when the molecular cloud is dispersed by star formation, and these products may yield the extinction characteristic of the diffuse interstellar medium.
However, the profile of the ice feature obtained in our work peaks long-ward of and therefore is likely to be associated with the presence of amorphous ice towards these sources.
Simultaneous fits of our K- and L-band spectra with single reddened blackbody continua allowed us to estimate the extinction towards the individual Galactic Center sources and to determine the approximate continuum shape of the observed spectra. The derived K-band extinctions and blackbody temperatures are consistent with values found for the sources in the central stellar cluster (Chiar et al. 2002, Tanner et al. 2002, 2003).
Using the spectrum of a late-type star assumed to be free from local extinction, we were able to derive the spectrum of the L-band extinction along the line of sight toward the Galactic Center. This spectrum has been used in order to derive the extinction corrected spectra of the most luminous sources. The extinction corrected spectra are consistent with the blackbody temperatures derived from the previous fitting procedure. The Rayleigh Jeans continuum spectra obtained towards all the hot stars indicate that the distribution of extinction in the central half parsec is fairly flat and varies in the K-band only by AK mag. This is consistent with the results by Scoville et al. (2003). Therefore the excess extinction that we determined after correction for the line of sight extinction towards some of the sources should be associated with the individual objects or very clumpy features of the ISM. This is in support of the findings by Blum et al. (1996) and Clénet et al. (2001) and is also consistent with the large interval in which range the optical depth values derived from the fitting procedure.
The presence of local extinction in the envelopes of the dusty sources is consistent with the bow shock model of Tanner et al. (2002, 2003). Cotera et al. (1999) had already shown that several of these sources are indeed offset from nearby local maxima in the extended dust emission and temperature distribution. Especially for IRS 21, Tanner et al. (2002) indicate that the extended dust emission of this source is consistent with a bow shock created by the motion of such a massive hot star through the dust and gas of the mini-spiral. It is likely that the bow shock scenario may be applicable to most of the dust embedded sources in the central stellar cluster. For IRS 3, however, the bow-shock scenario may not apply. Gezari et al. (1985) find IRS 3 as the most compact and (together with IRS 7) hottest, bright source (T400 K) in the central cluster. As suggested in the case of IRS 21 by Tanner et al. (2002) IRS 3 may be an optically thick dust shell surrounding a mass-losing source, such as a dusty recently formed WC9 Wolf-Rayet star.
In addition, a blackbody temperature of 1000K is found for the spectrum representing the highly reddened sources located in the North of IRS 13. While it cannot be excluded that the individual objects contained in this source complex are lower luminosity analogues of the class of bow shock objects found by Tanner et al. (2002) and Rigaut et al. (2003), their temperature and luminosity is well in agreement with the low temperatures of the YSO classified by Ishii et al. (1998).
Detailed modeling, similar to the studies by Tanner et al. (2003) and Eckart et al. (2004), based on higher angular resolution MIR imaging and spectroscopy (using AO or interferometry) is required to unravel the nature of the highly extinced sources in the IRS 13N association.
Finally, a trend of correlation is noticed in the versus optical depths plot. If a real correlation were confirmed between these two features, it would suggest that the ISM along the line of sight toward the Galactic Center is possibly composed of a mixture of diffuse and dense material. Moreover, the plots of the optical depth values suggests that part of the feature arises probably from the foreground ISM and part of it from the local medium associated with the individual sources.
Acknowledgements.
This work was supported in part by the Deutsche Forschungsgemeinschaft (DFG) via grant SFB 494. We are grateful to all members of the ISAAC/VLT and the MPE 3D team.Allen, D.A. & Wickramasinghe, D.T. 1981, Nature 294, 239
Baganoff, F. K., Bautz, M. W., Brandt, W. N., Chartas, G., Feigelson, E. D., Garmire, G. P., Maeda, Y., Morris, M., Ricker, G. R., Townsley, L. K., Walter, F. 2001, Nature, Volume 413, Issue 6851, pp. 45-48
Baganoff et al., Proceedings of the Galactic Center Workshop, Nov. 3-8, 2002, Hawaii, A. Cotera, T. Geballe, S. Markoff, H. Falcke (editors) 2003, Astron. Nachrichten in press
Becklin, E.E. & Neugebauer, G. 1968, iihconf 1
Becklin, E.E. & Neugebauer, G. 1969, ApJ 157, L31
Becklin, E.E. & Neugebauer, G. 1975, ApJ 200, L71
Becklin, E.E., Matthews, K., Neugebauer, G., Willner, S.P. 1978, ApJ 219, 121
Blum, R. D., Sellgren, K., Depoy, D. L. 1988, AJ 112
Blum, R. D., Sellgren, K., Depoy, D. L. 1995, ApJL 440, L17
Blum, R. D., Depoy, D. L., Sellgren, K. 1995, ApJ 441, 603
Blum, R. D., Sellgren, K., Depoy, D. L. 1996, ApJ 470, 864
Bohren, C.F., Huffman, D.R. 1983, asls. book
Brandner, W. et al. 2002, The ESO Messenger 107, 1-6
Brooke, T. Y., Sellgren, K., Geballe, T. R. 1999, ApJ 517, 883
Brooke, T. Y., Tokunaga, A. T., Strom, S. E. 1993, AJ 106, 656
Brown, R.L., Johnston, K.J., Lo, K.Y. 1981, ApJ 250, 155
Butchart, I., McFadzean, A. D., Whittet, D. C. B., Geballe, T. R., Greenberg, J. M. 1986, A&A 154
Chan, Kin-Wing, Moseley, S. H., Casey, S., Harrington, J. P., Dwek, E., Loewenstein, R., Varosi, F., Glaccum, W. 1997, ApJ 483, 798
Chiar, J.E., Tielens, A.G.G.M., Whittet, D.C.B., Schutte, W.A., Boogert, A.C.A., Lutz, D., van Dishoeck, E.F., Bernstein, M.P. 2000, ApJ 537, 749
Chiar, J. E., Tielens, A. G. G. M. 2001, ApJ 550, L207
Chiar, J. E., Adamson, A. J., Pendleton, Y. J., Whittet, D. C. B., Caldwell, D. A., Gibb, E. L., 2002, ApJ 570, 198
Clénet, Y., Rouan, D., Gendron, E., Montri, J., Rigaut, F., Lńa, P., Lacombe, F. 2001, A&A, 376, 124
Clénet, Y. et al., Proceedings of the Galactic Center Workshop, Nov. 3-8, 2002, Hawaii, A. Cotera, T. Geballe, S. Markoff, H. Falcke (editors), 2003, Astron. Nachrichten in press
Cotera, A. S., Erickson, E. F., Colgan, S. W. J., Simpson, J. P., Allen, D. A., & Burton, M. G. 1996, ApJ 461, 750
Cotera, A. S., Erickson, E. F., Simpson, J. P., Rieke, M. 1992, J.American Astronomical Society, 180th AAS Meeting, 25.02, Bulletin of the American Astronomical Society, Vol. 24, p.765
Cotera, A. S., Simpson, J. P., Erickson, E. F., Colgan, S. W. J., Burton, M. G., Allen, D. A. 1999, ApJ 510, 747
Cotera, A., Morris, M., Ghez, A. M., Becklin, E. E., Tanner, A. M., Werner, M. W., Stolovy, S. R. 1999, cpg conf, 240
de Graauw, T., Whittet, D.C.B. et al. 1996, A&A 315,L345
Duley, W. W., Williams, D. A. 1983, MNRAS 205, 67
Duley, W. W., Williams, D. A. 1984, Natur 311, 685
Eckart, A. Moultaka, J. Viehmann, T. Straubmeier, C. Mouawad, N. 2004, ApJ 602, in press
Eckart, A. Genzel, R., Hofmann, R., Sams, B.J. and Tacconi-Garman, L.E. 1995, ApJ 445, L26
Eckart, A. & Genzel, R. 1996, Nature 383, 415-417
Eckart, A., Ott, T., Genzel, R., & Lutz, D. 1998, in Proc. of IAU Symp. No.193 on ’Wolf-Rayet Phenomena in Massive Stars and Starburst Galaxies’ Puetrto Valarta, Mexico, November 3–7, van der Hucht, K.A., Koenigsberger, G., Enens, P.R.J. (eds.), Kluewer, pp.449
Eckart, A, Ott, T, Genzel, R. 1999, A&A 352,L22
Eckart, A., Genzel, R., Ott, T. and Schoedel, R. 2002, MNRAS 331, 917-934
Eckart,A., Moultaka. J., et al., 2003, Proceedings of the Galactic Center Workshop, Nov. 3-8, 2002, Hawaii, A. Cotera, T. Geballe, S. Markoff, H. Falcke (editors, Astron. Nachrichten in press
Eisenhauer, F., Schoedel, R., Genzel, R., Ott, T., Tecza, M., Abuter, R., Eckart, A., Alexander, T., accepret by ApJL (astro-ph/0306220)
Figer, D.F., Gilmore, D., Morris, M., McLean, I.S., Becklin, E.E., Gilbert, A.M., Graham, J.R., Larkin, J.E., Levenson, N.A., Teplitz, H.I. 2001, AAS 198, 8706
Figer, D.F., et al. 2002, ApJ 581, 258
Figer, D. F., Najarro, F., McLean, I. S., Morris, M., Geballe, Th. R. 1997, Luminous Blue Variables: Massive Stars in Transition. ASP Conference Series, Vol. 120, 1997, ed. Antonella Nota and Henny Lamers p.196
Figer, D.F., Najarro, F. et al. 2002, ApJ 581, 258
Fuente, A., Martin-Pintado, J., Bachiller, R., Rodriguez-Franco, A., Palla, F. 2002, A&A 387, 977
Genzel, R., Thatte, N., Krabbe, A., Kroker, H., Tacconi-Garman, L. E. 1996, ApJ 472, 153
Genzel, G., Eckart, A., Ott, T. & Eisenhauer, F. 1997, MNRAS 291, 219-234
Genzel, R., Pichon, C., Eckart, A., Gerhard, O. & Ott, T. 2000, Mon.Not.R.Soc.317, 348-374
Genzel, R., Schödel, R., Ott, T., et al. 2003, ApJ. 594, 812-832
Genzel, R., Schödel, R., Ott, T., Eckart, A., Lacombe, F., Rouan, D., & Aschenbach, B. 2003a, Nature 425, 934-936
Gerakines, P. A., Whittet, D. C. B., Ehrenfreund, P., Boogert, A. C. A., Tielens, A. G. G. M., Schutte, W. A., Chiar, J. E., van Dishoeck, E. F., Prusti, T., Helmich, F. P., de Graauw, Th. 1999, ApJ 522, 357
Gerakines, P. A., Whittet, D. C. B., Ehrenfreund, P., Boogert, A. C. A., Tielens, A. G. G. M., Schutte, W. A., Chiar, J. E., van Dishoeck, E. F., Prusti, T., Helmich, F. P., de Graauw, Th. 1999, ApJ 526.1062
Gerhard, O. 2001, ApJ 546, L39-L42
Gezari, D.Y., Shu, P., Lamb, G., Tresch-Fienberg, R., Fazio, G.G., Hoffmann, W.F., Gatley, I., McCreight, C. 1985, ApJ 299, 1007
Gezari, D.Y., Schmitz, M., Pitts, P.S., Mead, J.M. 1993, Catalogue of Infrared Observations (NASA RP-1294) (3rd ed., Washington:NASA)
Gezari, D., Dwek, E., Varosi, F., In ’The Nuclei of Normal Galaxies: Lessons from the Galactic Center’ 1994, Proceedings of the NATO Advanced Research Workshop, held in Schloss Ringberg, Kreuth, Bavaria, Germany, July 25-30, 1993, Dordrecht: Kluwer Academic Publishers, edited by Reinhard Genzel and Andrew I Harris. NATO Advanced Science Institutes (ASI) Series C, Volume 445, p.343
Gezari, D., Dwek, E., Varosi, F. 1996, IAUS 169, 231
Gezari, S., Ghez, A.M., Becklin, E.E., Larkin, J., McLean, I.S., Morris, M. 2002, ApJ 576, 790
Ghez, A., Klein, B.L., Morris, M. & Becklin, E.E. 1998, ApJ. 509, 678-686
Ghez, A., Morris, M., Becklin, E.E., Tanner, A. & Kremenek, T. 2000, Nature 407, 349-351
Ghez, A., Duchêne, G., Matthews, K., et al. 2003, ApJ. 586, L127-L131
Gillett, F. C., Forrest, W. J. 1973, ApJ 179, 483
Glass, I.S., & Moorwood, A.F.M. 1985, MNRAS 214, 429
Grishko, V. I., Duley, W. W. 2002, ApJ 568, L131
Guesten, R., Genzel, R., Wright, M. C. H., Jaffe, D. T., Stutzki, J., Harris, A. I. 1987, ApJ 318, 124
Hagen, W., Greenberg, J. M., Tielens, A. G. G. M. 1983, A&A 117, 132
Herbst, T. M., Beckwith, S. V. W., Shure, M. 1993, ApJ 411, L21
Hillenbrand, L.A., Strom, S.E., Vrba, F.J., Keene, J. 1992, ApJ 397, 613
Hoyle, F., Wickramasinghe, N. C., Al-Mufti, S., Olavesen, A. H., Wickramasinghe, D. T. 1982, Ap&SS 83, 405
Hudgins, D. M., Sandford, S. A., Allamandola, L. J., Tielens, A. G. G. M. 1993, ApJS 86, 713
Ishii, M., Nagata, T., Sato, S., Watanabe, M., Y., Yongqiang, J., Terry J. 1998, AJ 116, 868
Jackson, J.M., et al. 1993, ApJ 402, 173
Jones, T. J., Hyland, A. R., Allen, D. A. 1983, MNRAS 205, 187
Joyce, R. R., Simon, T. 1982, ApJ 260, 604
Kim, S.S., Morris, M., Lee, H.M. 1999, ApJ 525, 228
Kitta, K., Kraetschmer, W. 1983, A&A 122, 105
Kleinmann, S.G., Hall, D.N.B. 1986, ApJS 62,501
Koornneef, J. 1983, A&A 128, 84
Krabbe, A. et al. 1995, ApJL 447, L95
Lacy, J. H., Townes, C. H., Hollenbach, D. J. 1982, ApJ 262, 120
Lebofsky, M. J. 1979, AJ 84, 324
Lenzen, R., Hofmann, R., Bizenberger, P. & Tusche 1998, A. Proc. SPIE, IR Astronomical Instrum. (A.M.Fowler ed.) 3354, 606-614
Lutz, D. et al. 1996, A&A 315, 269
Maillard et al., Proceedings of the Galactic Center Workshop, Nov. 3-8, 2002, Hawaii, A. Cotera, T. Geballe, S. Markoff, H. Falcke (editors) 2003, Astron. Nachrichten in press
Maldoni, Marco M., Smith, R. G., Robinson, Garry, Rookyard, V. L. 1998, MNRAS 298, 251
Martin, P. G., Whittet, D. C. B. 1990, ApJ 357, 113
McFadzean, A.D., Whittet, D.C.B., Bode, M.F., Adamson, A.J., Longmore, A.J. 1989, MNRAS 241, 873
Mennella, V., Baratta, G. A., Esposito, A., Ferini, G., Pendleton, Y. J. 2003, ApJ 587, 727
Moneti, A., Cernicharo, J., Pardo, J.R. 2001a, ApJ 549, L203 .
Morris, M., 1993, ApJ 408, 496.
Najarro, F., Krabbe, A., Genzel, R., Lutz, D., Kudritzki, R. P., Hillier, D. J. 1997, A&A 325, 700
Ott, T., Eckart, A., Genzel, R., 2003, ApJ 523, 248O
Paumard, T., Maillard, J.P., Morris, M., Rigaut, F. 2001, A&A 366, 466-480
Pendleton, Y.J., Sandford, S.A., Allamandola, L.J., Tielens, A.G.G.M., Sellgren, K. 1994, ApJ 437, 683
Phinney, E.S., in The Centre of the Galaxy 1989, ed. M. Morris (Dortrecht: Kluwer), 543
Portegies Zwart S., McMillan, S., Gerhard, O., 2003, astro-ph/0303599, ApJ in press.
Reid, M.J., Menten, K.M., Genzel, R., Ott, T., Sch del, R., Eckart, A. 2003, ApJ 587, 208
Rieke, G.H., Low, F.G. 1973, ApJ 184, 415
Rieke, G. H., Lebofsky M.J. 1985, ApJ 288, 618
Rieke, G. H., Rieke, M. J., Paul, A. E. 1989, ApJ 336, 752
Rigaut et al., Proceedings of the Galactic Center Workshop, Nov. 3-8, 2002, Hawaii, A. Cotera, T. Geballe, S. Markoff, H. Falcke (editors) 2003, Astron. Nachrichten in press
Rousset, G. et al. 1998, Proc.SPIE Adaptive Optics Technology (D.Bonaccini & R.K.Tyson eds) 3353, 508-516
Sanders, R.H. 1992, Nature 359, 131
Sandford, S.A., Allamandola, L.J., Tielens, A.G.G.M., Sellgren, K., Tapia, M., Pendleton, Y. 1991, ApJ 371, 607
Sandford, S. A., Pendleton, Y. J., Allamandola, L. J. 1995, ApJ 440, 697-705
Scoville, N.Z., Stolovy, S.R., Rieke, M., Christopher, M.H., Yusef-Zadeh F. 2003, accepted to ApJ (9/1/03 issue)
Schödel et al. 2002, Nature 419, 694-696
Schödel, R., Ott, T., Genzel, R., Eckart, A., Mouawad, N., & Alexander, T. 2003, Astrophys.J. 596, 1015-1034
Sellgren, K., McGinn, M. T., Becklin, E. E., Hall, D. N. 1990, ApJ 359, 112
Sellgren, K., Brooke, T. Y., Smith, R. G., Geballe, T. R. 1995, ApJL 449, L69
Serabyn, E., Morris, M. 1996, Nature 382, 602
Simon, M., Chen, W.J., Forrest, W.,J., Garnett J.D., Longmore, A.,J., Gauer, T., Dixon, R.I. 1990, ApJ 360, 95
Smith, R. G., Sellgren, K. & Brooke, T. Y. 1993, MNRAS, 263, 749
Storey, J.W.V. & Allen, D.A. 1983 MNRAS 204, 1153
Tamura, M., Werner, M.W., Becklin, E.E., Phinney, E.S. 1994, iaan conf. 117
Tamura, M., Werner, M. W., Becklin, E. E., Phinney, E. S. 1996, ApJ 467, 645
Tanner, A., Ghez, A. M., Morris, M., Becklin, E. E., Cotera, A., Ressler, M., Werner, M., Wizinowich, P. 2002, ApJ 575, 860
Tanner et al., Proceedings of the Galactic Center Workshop, Nov. 3-8, 2002, Hawaii, A. Cotera, T. Geballe, S. Markoff, H. Falcke (editors), 2003, Astron. Nachrichten in press
Thatte, Niranjan A., Kroker, H., Weitzel, L., Tacconi-Garman, Lowell E., Tecza, M., Krabbe, Alfred, Genzel, R. 1995, SPIE. 2475, 228
Thornley, M.D., Schreiber, N.M. F rster, Lutz, D., Genzel, R., Spoon, H.W. W., Kunze, D., Sternberg, A. 2000, ApJ 539, 641
Tielens, A. G. G. M. & Hagen, W. 1982, A&A 114, 245
Tielens, A. G. G. M., Hagen, W., Greenberg, J. M. 1983, JPhCh 87, 4220
Tielens, A.G.G.M., Wooden, D.H., Allamandola, L.J., Bregman, J., Witteborn, F.C. 1996, ApJ 461, 210
Tokunaga, A. T., in ’Diffuse Infrared Radiation and the IRTS’ 1997, ASP Conference Series, Vol. 124, 1997, ed. H. Okuda, T. Matsumoto, and T. Rollig, p.149
Tollestrup, E.V., Becklin, E.E., Capps, R. W. 1989, AJ 98, 204
Wada, S., Sakata, A., Tokunaga, A.T. 1991, ApJ 375, L17
Weitzel, L., Krabbe, A., Kroker, H., Thatte, N., Tacconi-Garman, L.E., Cameron, M., Genzel, R. 1996, A&AS 119, 531
Willner et al. 1982, Ap.J. 253, 174
Yusef-Zadeh, F., Roberts, D. A., Biretta, J. 1998, ApJL 499, L159
Zhao, J.-H.,& Goss, W.M. 1998, ApJL 499, L163