The Data Reduction and Analysis Graphical Organizer
Abstract
Spectroscopic surveys are undergoing a rapid expansion in their data collecting capabilities, reaching the level of hundreds of spectra per pointing. An efficient use of such huge amounts of information requires a high degree of interconnection between the various tools involved in preparing the observations, reducing the data, and carrying out the data analysis. DRAGO (Data Reduction and Analysis Graphical Organizer) attempts to easy the process, by integrating in a global framework the main data handling components: from reduction pipelines, to data organization, plotting, and browsing tools, to storing the data reduction results in a database for further analysis. DRAGO allows the use of the astronomer own’s preferred tools, by ”plugging them in” in an environment which handles transparently the communications between them. See http://cosmos.mi.iasf.cnr.it/pandora .
keywords:
Data Reduction, Data Organizer, Astronomical software, DatabaseThe Data Reduction and Analysis Graphical Organizer
Astronomical Data Analysis Conference III
1 INTRODUCTION
The purpose of this package is to have a tool specifically built to handle relatively large datasets, in the most complete way. The package must include pipelines for data reduction to be carried out in a semi-automatic fashion, tools for data visualization, and data analysis tools that can be used efficiently for standard or ad-hoc analysis of the available data.
The need for such a package is dictated by the rapid increase in the number of large telescopes available to the astronomical community, coupled with the equally rapid increase in the multiplexing capabilities of the instruments attached to those telescopes. While a normal long-slit spectrograph on a 4-meter class telescope could produce a few tens of spectra per night of observation, today a spectrograph like VIMOS at the VLT can obtain several thousands spectra per night. This productivity increase has rendered obsolete traditional methods of data reduction and analysis, at least as long as these data must be reduced and analyzed in a timely fashion. It is clearly necessary to automatize as much as possible these operations, to increase the speed with which they can be carried out, but without sacrificing the capability of analyzing in detail the results of the various operations, and eventually intervene manually to change the way some of these operations are carried out. Moreover it is necessary to develop an efficient and rigorous data organizer and archiver, so that the available data and files would not be lost among hundreds or thousands of similar data and files.
This concurrent need for automation of the data reduction and analysis procedures, and for an efficient and rigorous data organizer leads to the decision of building a new package, specifically designed to satisfy these needs. General-purpose astronomical software packages like IRAF or MIDAS in fact are not well equipped for these tasks, and to add these facilities using the rather limited programming tools these packages offer would require a prohibitively large amount of work.
2 TECHNICAL DESCRIPTION
We can identify three main types of operation:
- data organization (raw data and reduced data);
- data reduction and analysis;
- data storing (coming from data reduction and analysis).
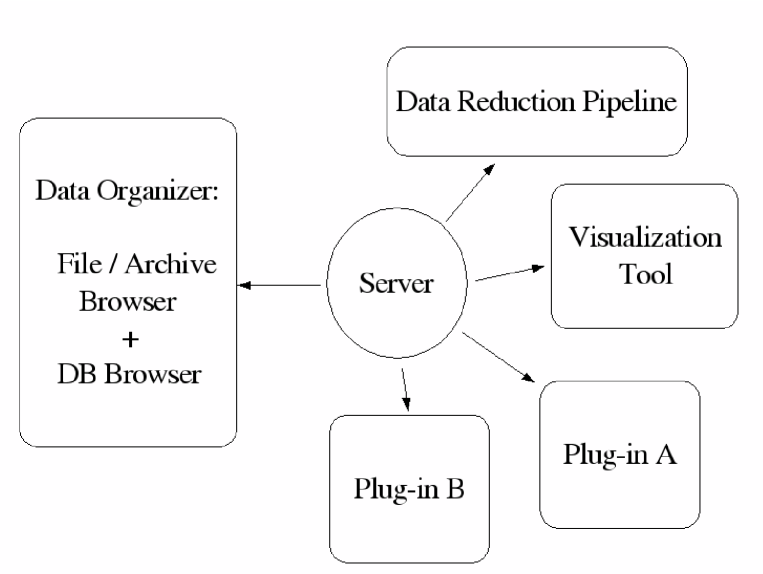
Each of the tasks above corresponds to one (or more) software module. Thus we have a File Browser for the data handling and managing, one or more Reduction Software for data elaboration and analysis, and a Database Browser for the data storing and inquiring.
Operationally, DRAGO is structured around a Communication Server, which handles the communication between these independent software modules (see Figure 1). Every functionality the package offers, is included in one such module, and it is possible to add external plug-in modules following a very simple procedure.
 |
 |
 |
At the first development stage, the Communication Server is a relatively simple one, and all package modules are local packages, so that all instances of all software tools will be executed on a single workstation. In a future implementation, the communication server will be replaced with an advanced server, capable of handling remote communications and of taking advantage of distributed computing infrastructures, where separate data reduction or data analysis modules and the data storage facilities can be located anywere within a grid of computers.
The core DRAGO functions are being developed using Python. Data reduction and analysis plug-ins can be coded using any language of choice, and they will require a small Python interface to obtain a complete integration within the DRAGO package.
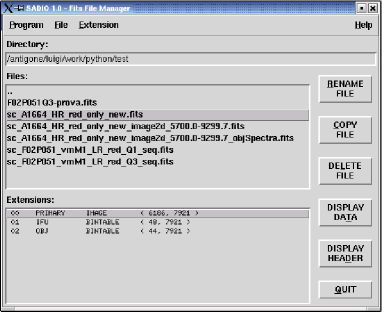
3 FILE BROWSER
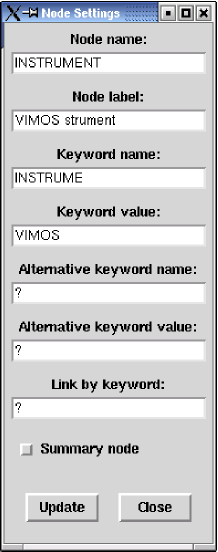
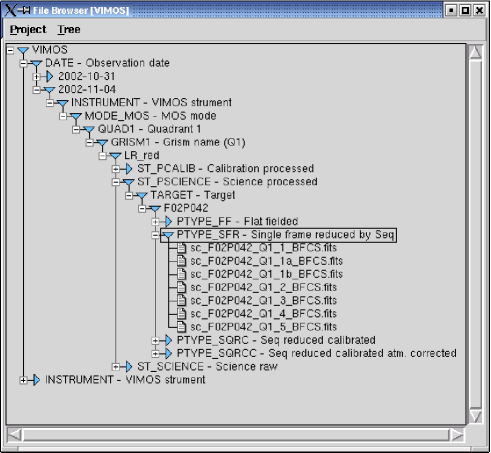
The File Browser is responsible for data organization: it categorizes files according to user’s defined criteria, and allows an easy and fast browsing through them.
As an example, in Figure 2 we show the characterization of VIMOS data files: the panel on the left is to be filled in by the user, and allows to define the data structure on the basis of FITS keywords. On the right we show the categorization of data files resulting from such definition.
 |
4 EXTERNAL PLUG-INS
DRAGO provides a plug-in system where each data reduction software and tool (coming from third parties) can be integrated in the global framework. The astronomer can use his own’s preferred tool exploiting at the same time all of the others DRAGO potentialities.
DRAGO plug-in technology makes it extremely simple to incorporate existing software tools, interfacing them in a single working framework.
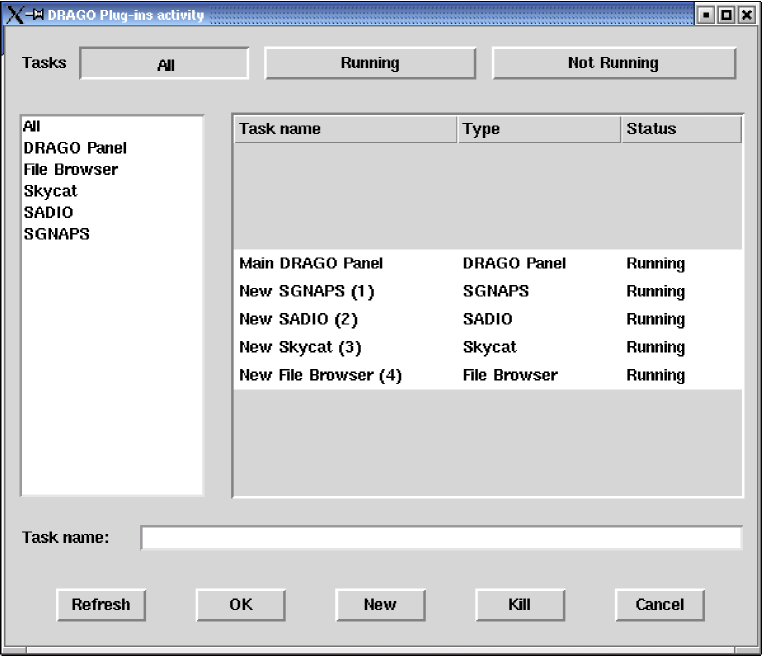
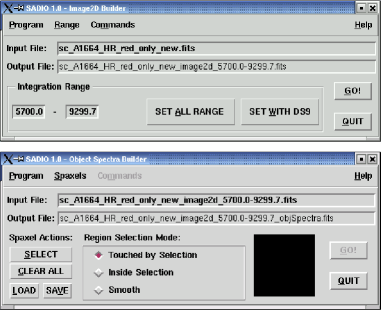
To demostrate and test DRAGO plug-ins system, we have used it to plug-in a number of packages for data visualization and analysis (see Figure 3). Skycat is used as example of distributed external software, while SADIO and SGNAPS are two internally developed packages we have incorporated as testing case.
SADIO plug-in (Software for Analise and Display IFU Observations) allows to elaborate VIMOS-IFU data. It can produce a 2D image integratig spectra over a user defined wavelength range, and a monodimensional spectrum, spatially integrating spectra over a region selected from the 2D image produced before (Figure 4).
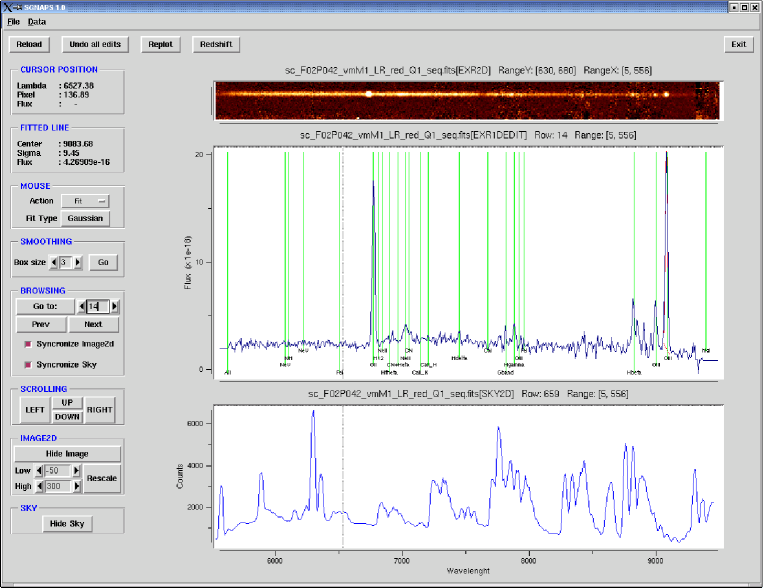
SGNAPS (Software for Graphical Navigation, Analysis and Plotting of Spectra) allows to display and elaborate 1D spectra, coordinating its display with that of the corresponding 2D image and sky spectrum. It also provides a redshift estimation tool (Figure 5).
 |
 |
 |
5 DATABASE
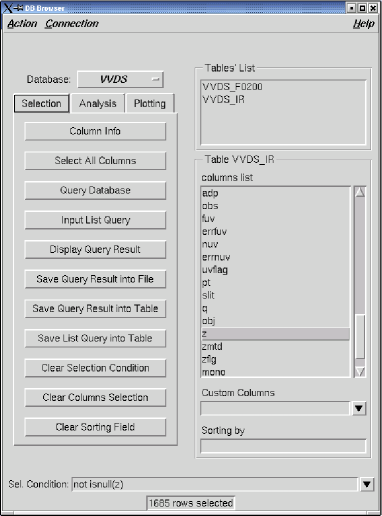
The last plug-in we will provide within DRAGO is an easy-to-use interface to MySQL named DBrowser.
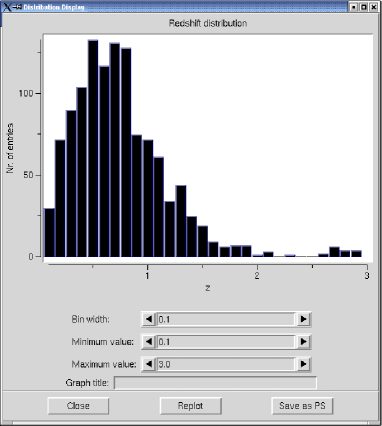
It is designed to be a quick analysis tool for scientists who have their data stored in tables within a MySQL database, as it provides simple and easy to use statistical and plotting facilities: plot data value distributions or correlations; get measurements for a distribution mean, median, and spread; measure the degree of correlation and derive the linear correlation coefficients between two sets of data values (see Figure 6).
Being embedded within DRAGO, it will eliminate the requirement of extracting the data from the database and passing them to some external package for analysis.
Once incorporated in the DRAGO plug-in suite, it will be possible to complete the DRAGO philosophy, having a global framework that satisfied the three requirements of data organization, data reduction and analysis, data storing.
 |
 |