Detailed chemical composition of the open cluster IC 4651: The iron peak, elements, and Li. ††thanks: Based on observations collected at the ESO VLT, Paranal Observatory, Chile
We present a detailed chemical analysis of 22 stars along the colour-magnitude
sequence of the intermediate-age (1.7 Gyr) open cluster IC 4651, based on
high-resolution, high S/N ratio spectra from UVES/VLT. IC 4651 thus
becomes one of the few open clusters for which a detailed composition
analysis exists for stars spanning 3.5 magnitudes, from solar-type
main-sequence stars to giants above the RGB clump. In a strict comparison
with the Sun, we find for the cluster a well-defined Fe abundance
of [Fe/H]= 0.03 (internal errors), with a reddening E(b-y)=
0.091. We also derive abundances for
the elements Mg, Si, Ti, and Ca and find a moderate enhancement of
the three former elements, in excellent agreement with the results for
field stars of similar Fe abundance. Among the Fe group elements, Cr and Ni
are slightly overabundant ([X/Fe]0.05).
As also observed in M67, the Na abundance among the giants is more
than 0.2 dex higher than in the dwarfs. We interpret this effect as real,
and due to dredge-up of 23Na in the giants.
Four turnoff stars, all fairly rapid rotators ( 25 km s-1),
appear to have higher [Fe/H] than the other stars; our tests show that, while
a spurious enhancement of 0.1 dex can be produced by the effect of high
rotation on our spectral analysis, this cannot explain the whole difference.
These stars appear overabundant because we tend to overestimate their
effective temperatures by forcing excitation equilibrium.
Li abundances have been computed for all the stars and show a well-defined
pattern: the Solar-type stars have an almost constant Li abundance, just
below that of the Hyades, and the Li-dip is pronounced and well determined.
Turnoff stars just above the dip have a ‘cosmic’ Li abundance, but within
a very small range of magnitudes (0.25 mag) higher on the turnoff,
the Li level drops by more than a factor 10.
This cannot be due just to dilution; rather some extra mixing is required. Among
the giants, two probable clump stars show detectable Li, while all the
other (likely) RGB stars do not - as is also observed in the similar cluster
NGC3680. None of these patterns can be explained by classical stellar evolution
models. Again, some extra mixing is required.
We show that rotating stellar models including the most recent
developments for meridional circulation and turbulence by shear instabilities
explain very well the behaviour of the lithium abundance along the
colour-magnitude diagram of IC4651, including subgiant and giant phases.
The possibility remains open that the giants exhibiting the highest lithium
abundances are actual RGB bump stars which have just been through the so-called
“lithium flash”.
Key Words.:
Stars: abundances – stars: open clusters – stars: late-type – stars: rotation1 Introduction
Open clusters are key tracers of the chemical evolution of the Galaxy and, at the same time, benchmarks for stellar evolution models. Despite the many advances in the detailed modelling of stellar evolution over the last few years (see e.g. Girardi et al. 2000), very few open clusters have been studied in a comprehensive manner. Membership studies have become available for several clusters, but the number of detailed chemical analyses remains very small (e.g., Gratton gratt00 (2000) and references therein).
The determination of heavy-element abundances and abundance ratios and their variation with time and Galactocentric distance is crucial for our understanding of the formation and chemical evolution of the Galactic disk (e.g., Edvardsson et al. 1993; Tosi 2000). Abundances in clusters also provide a fundamental tool to constrain the relative importance of Type I and Type II supernovae in the enrichment of the interstellar medium and thus to gain insight in the star formation history in the disk. On the other hand, the abundance evolution of the fragile elements Li and Be along the colour magnitude diagram (CMD) of a cluster represents a precious testbench for stellar evolutionary theories, as the initial stellar mass is the only variable parameter within a cluster (see e.g. Pasquini et al. 2000; Deliyannis et al. 2000).
For these reasons, we decided to carry out a detailed abundance analysis of the rich, well-studied, intermediate age cluster IC 4651, based on high-quality spectra for 23 members obtained with the VLT/UVES. The Strömgren photometry by Meibom (2000) and radial-velocity survey by Meibom et al. (2002) allowed us to select target stars known to be members, single, and with known rotational velocity. It also provided the basic properties of the cluster (distance, reddening, overall metallicity, and age).
In the present paper, we briefly summarize the properties of the cluster and describe the observations, data reduction and analysis. We then discuss the metal and element abundances, while the last section before the conclusions is devoted to a detailed analysis of the evolution of lithium. The abundances of O and Be and the isotopic ratio will be the subject of a future paper.
2 Basic properties of IC 4651
The early studies of IC 4651 by Eggen (1971), Lindoff (1972), and Anthony-Twarog et al. (1987, 1988, 2000) were superseded by the extensive photometry of 17,640 stars by Meibom (2000), supplemented by the radial-velocity survey of 104 stars by Meibom et al (2002). Notably, the wide field observed by Meibom (2000) roughly doubled the area and stellar content of the cluster relative to earlier studies; because the radial-velocity survey was initiated about a decade earlier, it is complete for the inner cluster only (to ).
Meibom et al. (2002) found IC 4651 to have a reddening of E(B-V) = 0.10, a distance of 1 kpc (), a metal abundance of [Fe/H] = +0.1 dex, and an age of Gyr; the mass of the cluster stars at the turnoff (TO) is . The present stellar population of IC 4651 was estimated to be stars with a total mass of . IC 4651 was, however, also found to show moderate mass segregation. A comparison of the present and plausible initial mass functions indicated that it initially contained at least stars with a total mass of . Of this mass, has been lost during the evolution of the initially most massive stars, while the remaining ( of the original low-mass stars) have evaporated from (the central part of) the cluster.
¿From its space motion, Meibom et al. (2002) also computed the Galactic orbit of IC 4651. They found a fairly eccentric orbit ( = 0.19), with a mean galactocentric orbital radius of 8.6 kpc and peri- and apogalactic distances 7.0 and 10.2 kpc, respectively. IC 4651 is currently 7.1 kpc from the Galactic centre and 140 pc below the Galactic plane; its maximum distance from the plane is 190 pc.
The conclusion of Meibom et al. (2002) that IC 4651 is metal rich ([Fe/H] = +0.1 dex) was based on the same type of photometry as used by Nordström et al. (1997) to derive a similarly high metallicity for the roughly coeval cluster NGC 3680. However, for the latter cluster, Pasquini et al. (2001) found [Fe/H] = -0.17 from high-resolution spectroscopy, a result that appears to be corroborated by the recent photometry of Anthony-Twarog & Twarog (2004). Thus, one goal of the present study is to check the iron abundance of IC 4651 by careful high-resolution spectroscopy.
3 Sample selection and observations
20 programme stars were selected for observation from the unpublished thesis by Meibom, pending the publication of the detailed results by Meibom (2000) and Meibom et al. (2002). Stars were chosen to be single and among the slower rotators in each magnitude bin, since an accurate analysis of very broad-lined spectra is not possible, in particular in the Be region. The stars were also chosen to sample a large section of the CMD; based on our previous experience with the twin cluster NGC3680 (Pasquini et al. 2001), it was clear that the region around the so called Li-dip (Boesgaard & Tripicco 1986) at the turnoff (TO) would be particularly interesting; thus we took care to sample this region more densely than was possible in the more sparsely populated NGC 3680 (Nordström et al. 1997). To these 20 stars we added the three stars previously analyzed by Randich et al. (2002), which were also observed with UVES in dichroic mode.
Our sample (including the stars from Randich et al. 2002) is listed in Table 1. Numbers less than 100 and with prefix “E” are from Eggen (1971); higher numbers with prefix “T” are from Anthony-Twarog et al. (1988). Strömgren photometry and rotational velocities are from Meibom (2000) and Meibom et al. (2002), while the B-V colors are from Anthony-Twarog et al. (1988); the magnitude for E98 by Meibom (2000) has been corrected for an apparent typographical error. The CMD of IC 4651 is shown in Fig. 1, with our sample stars circled for identification.
| Name | b-y | B-V | v | |||
|---|---|---|---|---|---|---|
| E12 | 10.324 | 0.661 | 0.465 | 0.314 | 1.126 | 1.1 |
| E8 | 10.667 | 0.666 | 0.403 | 0.299 | 1.100 | 0.1 |
| E60 | 10.870 | 0.673 | 0.491 | 0.312 | 1.141 | 1.9 |
| E98 | 10.880 | 0.694 | 0.496 | 0.331 | 1.187 | 1.0 |
| T812 | 11.059 | 0.648 | 0.413 | 0.344 | 1.140 | 0.5 |
| E95 | 11.953 | 0.514 | 0.185 | 0.386 | 0.805 | 12.0 |
| E3 | 12.051 | 0.374 | 0.169 | 0.527 | 0.612 | 29.9 |
| E56 | 12.184 | 0.378 | 0.159 | 0.499 | 0.599 | 27.8 |
| E19 | 12.240 | 0.412 | 0.157 | 0.484 | 0.651 | 32.1 |
| E99 | 12.377 | 0.347 | 0.171 | 0.531 | 0.546 | 28.1 |
| E17 | 12.625 | 0.337 | 0.158 | 0.543 | 0.539 | 10.0: |
| E25 | 12.654 | 0.365 | 0.118 | 0.552 | 0.537 | 21.3 |
| E5 | 12.817 | 0.329 | 0.160 | 0.532 | 0.507 | 23.9 |
| T1228 | 12.941 | 0.344 | 0.130 | 0.540 | 0.536 | 5.7 |
| E14 | 13.119 | 0.335 | 0.154 | 0.507 | 0.516 | 34.1 |
| E34 | 13.418 | 0.358 | 0.156 | 0.459 | 0.566 | 25.2 |
| E15 | 13.515 | 0.374 | 0.146 | 0.447 | 0.563 | 10.0 |
| E79 | 13.549 | 0.360 | 0.154 | 0.444 | 0.514 | 21.8 |
| E64 | 13.722 | 0.370 | 0.160 | 0.430 | 0.594 | 9.2 |
| E86 | 13.739 | 0.383 | 0.143 | 0.431 | 0.626 | 14.0 |
| T2105 | 13.948 | 0.429 | 0.145 | 0.374 | 0.618 | 11.3 |
| E7 | 14.165 | 0.402 | 0.179 | 0.368 | 0.643 | 2.1 |
| E45 | 14.184 | 0.430 | 0.127 | 0.399 | 0.654 | 4.2 |

The observations were carried out at the ESO VLT Kueyen telescope and its UVES spectrograph (Dekker et al. 2000). We used UVES in dichroic mode, which allowed us to simultaneously observe the near-UV/blue and red spectral ranges. In order to obtain a good signal in the region of the UV Be lines (313 nm), much longer exposure times are required than at longer wavelengths. We thus chose to obtain several red exposures, using both CD#3 centered at 580 nm and CD#4 centered at 860 nm, simultaneously with the UV ones; in this way we were able to observe the whole range 480-1000 nm in all the stars, with a gap in spectral coverage from 390 to 480 nm and very small gaps around 580 and 860 nm.
The three stars previously analyzed by Randich et al. (2002), which were also observed with UVES in dichroic mode, had several red exposures each in the setup centered around 580 nm. Each of these exposures was used to compute independent abundances, as if they pertained to different objects. This gives a good estimate of the internal random errors.
The observations were carried out in service mode between May and June 2001. Whereas in the UV a resolving power was used (1 arcsec slit), we opted for a very high resolution () in the red, using a 0.4 arcsec wide slit. The typical S/N ratio of our spectra is 70–120 per pixel. The data of Randich et al. were characterized by a similar S/N ratio, but a lower resolution (R45,000).
Both raw data and spectra reduced using the ESO–UVES pipeline (Ballester et al. 2000) were sent to us; after independently re-reducing several sample spectra we concluded that a complete, independent re-reduction was not warranted.
4 Data analysis: Stellar parameters and determination of abundances
4.1 Stellar parameters and iron abundances
Initial effective temperatures (Teff) were derived following the Alonso et al. (1996 and 1999) scales, based on (b-y) colours and assuming a reddening of E(b-y)= 0.072 (Meibom et al. 2002). Using a TO mass of 1.8 M⊙ and a distance modulus of = 10.03 (Meibom et al. 2002), we then computed surface gravities () from mass, luminosity and Teff. For each star, Teff and the microturbulence velocity have then been varied so as to eliminate any dependence of the Fe i abundance on the line excitation potential and equivalent width. Surface gravities were not varied by more than 0.3 dex. Due to the good quality of the spectra and the many lines present in our large spectral range, we could avoid using lines in the flat portion of the curve of growth, i.e., equivalent widths larger than 100 mÅ. As mentioned, we did not attempt to vary log in order to have (Fe i)(Fe ii), but just tried to obtain an ionization balance as good as possible while keeping a gravity compatible with the position of the star in the CMD.
Our analysis was carried out differentially with respect to the Sun starting from measured equivalent widths, hence most of the systematic effects should cancel out. We shall see, however, that for some elements this may not be completely true and some differences may be present between dwarfs and giants.
Equivalent widths were measured by using an automatic line width programme: DAOSPEC (Stetson et al. 2004) and typically 80–100 Fe i lines were used. The abundance calculations were performed with an updated and improved version of the original code described in Spite (1967). Edvardsson et al. (1993) model atmospheres were used for the dwarfs, while Gustafsson et al. (1975) models were employed for the giants. For the subgiant E95 we derived the Fe abundance using both models and found excellent agreement (within 0.01 dex in Fe/H); thus, we do not expect any major spurious effect by using the two sets of model atmospheres in the two different evolutionary regimes. Finally, for most elements we used the line list of Pancino et al. (2002); atomic parameters were mainly retrieved from the National Institute of Science and Technology Atomic Spectra Database. For Ca and Al, the data were taken instead from the VALD database (Kupka et al. vald2 (1999)).
4.2 Iron abundances
In Table 2 we list the initial photometric Teff, the final (spectroscopic) adopted Teff, microturbulence , and values, together with the derived Fe i and Fe ii abundances. The first line of the table reports the solar abundances that we have determined by analyzing the UVES solar spectrum (www.eso.org/instruments/UVES) in the same fashion as for the IC 4651 stars. For the Sun we used an Edvardsson et al. model with Teff= 5750 K, = 4.4 and = 0.9 km s-1. We note that our solar Fe i and Fe ii abundances are slightly higher than the canonical value ((Fe)= 7.52, Anders & Grevesse ag89 (1989)). In particular, it is worth noting that while in the Sun the ionization equilibrium is obtained, this is not the case for most stars in IC 4651; for these Fe ii is usually lower than Fe i because we allowed the spectroscopic to depart no more than 0.3 dex from the photometric value.
| Star | Tphot | Tspec | [Fe i] | [Fe ii] | ||
| (K) | (K) | (km s-1) | ||||
| Sun | 5800 | 5750 | 4.4 | 0.9 | 7.57 | 7.59 |
| E12 | 4940 | 5000 | 2.7 | 1.5 | 0.09 | 0.13 |
| E8 | 4870 | 4900 | 2.7 | 1.3 | 0.09 | 0.13 |
| E60 | 4850 | 4900 | 2.9 | 1.4 | 0.07 | 0.09 |
| E98 | 4870 | 4900 | 3.0 | 1.4 | 0.15 | 0.05 |
| E812 | 4830 | 5000 | 3.0 | 1.6 | 0.11 | 0.05 |
| E95 | 5560 | 5800 | 3.5 | 1.7 | 0.07 | 0.04 |
| Average | 0.097 | |||||
| 0.03 | 0.09 | |||||
| E3 | 6390 | 6550 | 3.9 | 2.1 | 0.27 | 0.16 |
| E56 | 6360 | 6500 | 3.9 | 2.1 | 0.11 | 0.06 |
| E19 | 6127 | 6500 | 3.9 | 2.1 | 0.14 | 0.00 |
| E99 | 6656 | 6800 | 4.0 | 2.0 | (0.32) | (0.23) |
| E17 | 6653 | |||||
| E25 | 6514 | 6900 | 4.1 | 1.9 | 0.11 | 0.06 |
| E5 | 6750 | 7100 | 4.3 | 1.9 | (0.40) | (0.22) |
| T1228 | 6600 | 6800 | 4.2 | 1.7 | 0.26 | 0.19 |
| E14 | 6690 | 6800 | 4.3 | 1.9 | 0.20 | 0.14 |
| E34 | 6480 | 6850 | 4.3 | 1.9 | (0.45) | (0.45) |
| E15 | 6380 | 6850 | 4.4 | 1.8 | 0.21 | 0.07 |
| E79 | 6460 | 6650 | 4.3 | 1.7 | 0.17 | 0.14 |
| Average | 0.18 | 0.09 | ||||
| 0.06 | 0.08 | |||||
| *E64 | 6390 | 6650 | 4.3 | 1.7 | 0.09 | 0.05 |
| E86 | 6300 | 6600 | 4.3 | 1.7 | 0.13 | 0.06 |
| T2105 | 5990 | 6350 | 4.3 | 1.1 | 0.04 | 0.05 |
| T2105 | 5990 | 6300 | 4.3 | 1.1 | 0.07 | 0.02 |
| T2105 | 5990 | 6400 | 4.4 | 1.1 | 0.13 | 0.05 |
| E7 | 6150 | 6300 | 4.3 | 1.1 | 0.13 | 0.12 |
| E7 | 6150 | 6300 | 4.3 | 1.1 | 0.12 | 0.07 |
| E45 | 5960 | 6350 | 4.3 | 1.1 | 0.12 | 0.08 |
| E45 | 5960 | 6350 | 4.3 | 1.1 | 0.13 | 0.03 |
| Average | 0.107 | 0.04 | ||||
| 0.03 | 0.06 |
The typical 1 dispersion around the mean Fe I and Fe II abundances is
0.1 dex, very uniform between slow-rotating dwarfs and giants.
Table 2 shows that:
-
1.
The abundances obtained from different spectra of the same star (7 last entries in the table) are in very good agreement, within 0.09 dex for Fe i and 0.1 dex for Fe ii (peak to peak);
-
2.
In most cases spectroscopic temperatures are higher than photometric ones. While the difference between Teff(phot) and Teff(spec) is within K for the giants, it can be as high as 300–400 K for the other stars. Small discrepancies could easily be explained, for instance by the characteristics of the stellar model atmospheres adopted, but the differences in Teff are too high for most dwarfs to be explained in this way;
-
3.
The bulk of the stars (19, including all the giants) have Fe i ranging between [Fe/H]= 0.03 and [Fe/H]= 0.26, while the remaining three objects, all located at the TO, give more than 2 higher Fe i abundances;
-
4.
The average Fe i abundances of giants and dwarfs are in excellent agreement, while the average abundance of stars at the TO is somewhat higher, even when not taking into account the three stars mentioned above. More specifically, the six giants have a mean [Fe i/H]= 0.10, to be compared with [Fe i/H]= 0.11 for the solar–type stars. This is a very encouraging result, confirming that not only the spectroscopic effective temperatures are consistent, but also that the agreement between the two sets of model atmospheres is very good.
However, eight stars, which are typically rather fast-rotating TO stars, give a slightly larger metallicity ([Fe i/H]= 0.18), while the three apparently most metal-rich stars (all hot and very fast rotators) give [Fe i/H] above 0.3 (E5, E34, E99). Anticipating the conclusions of our discussion, we note that the abundances for all rapid rotators suffer substantial uncertainties, regardless whether their abundances agree with the other stars of the cluster. In addition, for TO stars our method is not sensitive enough to constrain Teff properly, and we shall see that, when adopting photometric Teff with proper reddening, we recover Fe abundances in very good agreement with the solar-type stars and the giants.
In the following, we discuss: a) possible reasons for the overabundance measured among rapidly rotating stars at the TO; and b) possible reasons for the difference between spectroscopic and photometric Teff values.
4.2.1 Hot fast-rotating turnoff stars
Rapid rotation is a concern for abundance analyses based on equivalent widths, since, when the stars rotate fast, the selected lines may blend with nearby lines resulting in systematically higher equivalent widths. In addition, the measured scatter in [Fe/H] for fast rotators (0.3 dex) is about 3 times higher than for the best (slow rotating) stars in IC4651. This large dispersion does not seriously degrade the formal uncertainties of the derived Fe abundance, because more than 60 Fe I lines were used in the determination. Rather, the problem is that by excluding many lines in the analysis we are no longer performing a strict solar comparison. In addition, the solution becomes quite insensitive to variations in Teff, and the solution space becomes flat instead of showing a pronounced minimum.
We have confirmed this by artificially broadening the spectra of three stars (the Sun, E45 and E25) and repeating the analysis. We derive a spurously large microturbulence and an Fe abundance up to 0.1 dex higher than from the original spectra. Both these points are consistent with the data in Table 2, which shows that indeed for virtually all TO stars the microturbulence velocity is higher than the canonical values, and that the (typically fast-rotating) TO stars have [Fe/H]= 0.18, i.e. about 0.1 dex higher than the mean value derived from the more slowly-rotating dwarfs and giants. However, the systematic effects due to higher rotation do not explain the large differences between spectroscopic and photometric temperatures.
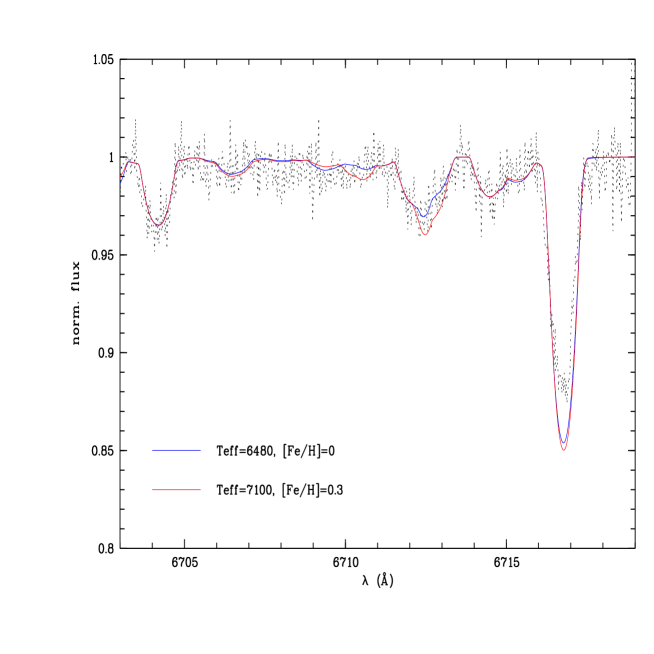
Finally, a synthetic and rotationally broadened spectrum for star E34 around the Li i 6708 Å doublet was computed using MOOG (Sneden sne (1973)) and Kurucz (kuru (1995)) model atmospheres. The observed spectrum of E34 is shown in Fig. 2, together with two different synthetic spectra. The figure clearly shows that we cannot discriminate between the two solutions, which differ by 600 K and 0.3 dex in [Fe/H].
Because of this uncertainty in the rapidly-rotating hot TO stars, we repeated the analysis using the photometric Teff derived with our best reddening estimate (cf. next section). The results are given in Fig. 3, where the Fe abundances of the 11 TO stars have been redetermined with the new photometric temperatures. The scatter in the Fe abundances is quite large (0.1 dex), but the mean ([Fe I/H]= 0.15) is now only slightly higher and in very good agreement with [Fe/H]= 0.10 found for the giants and solar-type stars.
| Star | Tphot | [Fe i] | [Fe ii] | ||
| E3 | 6550 | 3.9 | 2.1 | 0.27 | 0.16 |
| E56 | 6520 | 3.9 | 2.1 | 0.11 | -0.06 |
| E19 | 6280 | 3.9 | 2.1 | 0.02 | 0.02 |
| E99 | 6830 | 4.0 | 2.0 | 0.33 | 0.23 |
| E25 | 6680 | 4.0 | 2.0 | 0.00 | -0.02 |
| E5 | 6930 | 4.2 | 2.0 | 0.28 | 0.15 |
| T1228 | 6770 | 4.2 | 1.7 | 0.26 | 0.19 |
| E14 | 6860 | 4.2 | 1.9 | 0.23 | 0.18 |
| E34 | 6640 | 4.2 | 1.9 | 0.39 | 0.33 |
| E15 | 6540 | 4.2 | 1.7 | 0.08 | 0.06 |
| E79 | 6620 | 4.3 | 1.7 | 0.17 | 0.14 |
| Average | 0.15 | 0.13 | |||
| 0.1 | 0.1 |
4.2.2 Discrepancy between photometric and spectroscopic temperatures
The average difference between spectroscopic and photometric Teff is 290 and 100 K for the slow-rotating dwarfs and the giants, respectively. There are three possible explanations for the difference: i) the use of an incorrect color–Teff calibration; ii) systematic effects due to the adopted analysis code and model atmospheres; and iii) an error in the estimate of reddening.
i) Using a different colour system and/or calibration, such as B-V and the calibration of Soderblom et al. (sod93 (1993)), would not eliminate the discrepancy although, for some of the stars, it would result in differences of K with respect to the temperatures from b-y and the calibrations of Alonso et al. (1996, 1999). For example, Randich et al. (R02 (2002)) estimated Teff of 6061, 6016, and 6110 K for E7, E45, and T2105, still 250-300 K below our spectroscopic temperatures.
Thus, problems related to the (b-y) photometric scale are unlikely to be responsible for the discrepancy. We also point out that the spectroscopic temperatures of the main sequence stars cannot be strongly in error, given the excellent agreement in the [Fe/H] between giants and dwarfs; were the Teff from photometry truly too low by 250 K, the dwarfs would have subsolar [Fe/H] abundances ([Fe/H] ), in conflict with the giants and with the metallicity estimated from photometry.
ii) One could argue that the model atmospheres could be partly responsible for the discrepancy; in order to check this possibility, we have analyzed the Sun and E45 with MOOG (Sneden sne (1973)) and the Kurucz (kuru (1995)) model atmospheres. We find a dependence of the difference in the derived abundances (oursMOOG) on both the line excitation potential and EWs, due to the fact that Kurucz models are somewhat warmer and that damping is treated differently in the two codes; however, for the Sun we find an Fe abundance only 0.03 dex higher ((Fe i) = 7.60), and for E45 [Fe/H] is exactly the same as found by us (0.15). The values agree within 0.2 km/sec and Teff within 50 K. The use of different model atmospheres and codes therefore does not introduce substantial differences in our results.
iii) We are therefore only left with the possibility that the interstellar excess estimated from photometry is too low. By adding 0.02 mag to the E(b-y) by Meibom, the two Teff are brought almost into agreement. We conclude that E(b-y) = 0.091 or slightly larger for IC 4651. Note that such an increase in the reddening would not degrade the already acceptable agreement between spectroscopic and photometric temperatures for the giants, since their temperature scale is less sensitive than that of the dwarfs to b-y in this regime: with E(b-y)= 0.091, the spectroscopic and photometric temperatures of the six giants agree within 5 K.
Based on the above considerations and the more reliable and consistent abundances of the slowly-rotating giants and main sequence stars, we conclude that the Fe abundance of IC 4651 is [Fe/H]= +0.100.03.Using our higher value of E(b-y) would increase the photometric estimate of [Fe/H] by Meibom et al. (2002) by about 0.08 dex, still within the errors of both methods. The change in distance modulus is also within the errors and without consequence for our discussion.
5 Other elements
Individual element abundances for the stars in IC 4651, computed with the stellar parameters from the Fe analysis (Table 2), are given in Table 5. Table 6 lists mean abundances, element by element, for the Sun (both the canonical values from Anders & Grevesse 1989 and our results), the main-sequence stars, and the giants in IC 4651. When computing the mean abundance for the giants we excluded E95, since for the discrepant elements (such as Na), this star shares the abundance pattern of the dwarfs rather than the giants. The abundances we derive from the UVES solar spectrum are all within 0.1 dex of the canonical solar values, and we use them as the reference for the cluster stars.
We have checked the sensitivity of our abundances to the assumed stellar parameters by analyzing a giant (E60) and a dwarf star (E86) while varying Teff, log , and separately. The results are given in Table 4.
| El. | T100 | T200 | 0.3 | 0.3 |
|---|---|---|---|---|
| E60 | ||||
| Al I | -0.06 | -0.13 | 0.01 | 0.05 |
| Ca I | -0.10 | -0.21 | 0.02 | 0.12 |
| Cr I | -0.15 | -0.32 | -0.02 | 0.22 |
| Fe I | -0.05 | -0.08 | -0.03 | 0.13 |
| Fe II | 0.13 | 0.27 | -0.16 | 0.11 |
| Mg I | -0.03 | -0.04 | -0.01 | 0.02 |
| Na I | -0.08 | -0.17 | 0.01 | 0.08 |
| Ni I | -0.03 | -0.04 | -0.06 | 0.17 |
| Si I | 0.05 | 0.10 | -0.04 | 0.06 |
| Ti I | -0.15 | -0.30 | -0.01 | 0.14 |
| Ti II | 0.04 | 0.09 | -0.13 | 0.05 |
| E86 | ||||
| Al I | -0.03 | -0.07 | 0.01 | 0.01 |
| Ca I | -0.03 | -0.07 | 0.01 | 0.02 |
| Fe I | -0.05 | -0.12 | +0.01 | 0.05 |
| Fe II | 0.01 | 0.02 | -0.09 | 0.08 |
| Mg I | -0.03 | -0.07 | 0.01 | 0.01 |
| Na I | -0.03 | -0.07 | 0.01 | 0.01 |
| Ni I | 0.06 | -0.12 | 0.00 | 0.03 |
| Si I | -0.02 | -0.06 | 0.03 | 0.03 |
| Ti I | -0.08 | -0.16 | 0.01 | 0.01 |
| Ti II | -0.01 | -0.02 | -0.20 | 0.08 |
| Elem. | E45 | E45 | E7 | E7 | T2105 | T2105 | E86 | E64 | E25 | E12 | E98 | E60 | E812 | E95 | E8 |
|---|---|---|---|---|---|---|---|---|---|---|---|---|---|---|---|
| [Na I/H] | 0.02 | 0.06 | 0.14 | 0.11 | -0.10 | -0.03 | -0.18: | 0.10 | 0.08 | 0.34 | 0.30 | 0.28 | 0.35 | 0.03 | 0.27 |
| [Mg I/H] | 0.12 | 0.17 | 0.18 | 0.19 | 0.24 | 0.25 | 0.25 | 0.22 | 0.24 | 0.17 | 0.22 | 0.18 | 0.21 | 0.31: | 0.18 |
| [Al I/H] | 0.00 | 0.01 | 0.08 | 0.08 | 0.03 | 0.05 | 0.11 | -0.01 | 0.08 | 0.18 | 0.24 | 0.13 | 0.19 | 0.10 | 0.19 |
| [Si I/H] | 0.17 | 0.18 | 0.23 | 0.19 | 0.06 | 0.07 | 0.27 | 0.24 | 0.25 | 0.15 | 0.21 | 0.20 | 0.19 | 0.23 | 0.14 |
| [Ca I/H] | 0.15 | 0.15 | 0.15 | 0.15 | 0.12 | 0.18 | 0.19 | 0.14 | 0.21 | 0.12 | 0.11 | 0.04 | 0.09 | 0.17 | 0.09 |
| [Sc II/H] | -0.04 | -0.02 | -0.06 | -0.09 | -0.26 | -0.21 | -0.19 | 0.04 | 0.05 | 0.03 | 0.19 | 0.15 | 0.07 | -0.10 | 0.02 |
| [Ti I/H] | 0.14 | 0.16 | 0.19 | 0.14 | 0.25 | 0.27 | 0.18 | 0.35: | 0.33: | 0.17 | 0.25 | 0.24 | 0.20 | 0.10 | 0.23 |
| [Ti II/H] | -0.07 | -0.06 | 0.01 | 0.01 | -0.08 | -0.06 | 0.13 | 0.16 | 0.26: | 0.04 | 0.23 | 0.19 | 0.16 | 0.11 | 0.10 |
| [Ni I/H] | 0.09 | 0.15 | 0.13 | 0.16 | 0.03 | 0.07 | 0.09 | 0.16 | 0.20 | 0.14 | 0.28 | 0.24 | 0.15 | 0.05 | 0.20 |
| [Cr I/H] | 0.18 | 0.20 | 0.26 | 0.20 | 0.18 | 0.29 | 0.47: | 0.37: | 0.71: | 0.08 | 0.12 | 0.11 | 0.01 | -0.17 | 0.08 |
| Elem. | Sun | [X/H]MS | [X/H]giants | [X/H]Cluster | [X/Fe]MS | [X/Fe]giants | |
|---|---|---|---|---|---|---|---|
| A&G | Us | ||||||
| Fe i (100) | 7.52 | 7.57 | 0.11 | 0.10 | 0.11 | ||
| Fe ii (7) | 7.52 | 7.59 | 0.02 | -0.04 | / | ||
| Na i (2) | 6.33 | 6.28 | 0.02 | 0.29 | / | -0.09 | 0.19 |
| Mg i (2) | 7.58 | 7.53 | 0.24 | 0.19 | 0.21 | 0.13 | 0.09 |
| Al i (2) | 6.47 | 6.45 | 0.04 | 0.17 | 0.11: | -0.07 | 0.07 |
| Si i (5) | 7.55 | 7.45 | 0.18 | 0.18 | 0.18 | 0.07 | 0.08 |
| Ca i (17) | 6.36 | 6.38 | 0.15 | 0.10 | 0.13 | 0.04 | 0.00 |
| Sc ii (2) | 3.10 | 3.14 | -0.09 | 0.09 | 0.0: | -0.11 | 0.11 |
| Ti i (21) | 4.99 | 4.99 | 0.19 | 0.22 | 0.20 | 0.08 | 0.12 |
| Ti ii (5) | 4.99 | 4.88 | 0.02 | 0.14 | 0.08 | 0.00 | 0.18 |
| Ni i (15) | 6.25 | 6.23 | 0.12 | 0.20 | 0.16 | 0.01 | 0.10 |
| Cr i (2) | 5.67 | 5.72 | 0.22 | 0.08 | 0.15 | 0.11 | -0.02 |
5.1 Comments on Abundances
Titanium and Scandium: The Ti ii and Scii abundances do not follow that of Fe ii; Fe ii appears to be underabundant in giants with respect to dwarfs (see Table 2), but the opposite is true for Ti ii and Scii. While only two lines are available for Scii, the number of lines of are comparable for Ti ii and Fe ii, so there seems to be no simple explanation for this difference. If some overionization was present, we would indeed expect the ionized species to be more abundant in giants than in dwarfs, but this should be true for Fe ii as well. A possible cause might be the strong dependence of Fe ii on Teff and in the giants, as emerging from the error analysis of Table 4. Since Ti ii is much less sensitive to the atmospheric parameters other than gravity, some small mismatch in these may be enough to cause the different behaviour.
Magnesium: For Mg we only used the two lines at 6318.72 and 6319.24 Å.
Sodium: Na shows the largest difference between giants and dwarfs. In order to convince ourselves of the reality of this discrepancy, we have first checked how other effects, such as non-LTE, may affect our abundance computation. Gratton et al. (1999) published NLTE calculations for dwarfs and giants and showed that a small correction, of order 0.07 dex, is required for giants with log , such as those analysed here. A similar correction applies to the dwarfs, however, so NLTE is not the cause of the discrepancy. Our analysis of the effects of changing the stellar parameters shows that the only way to reduce this difference would be to lower the temperature scale for the giants by about 200 K. While temperatures 50 K cooler would help to bring the Fe ionization in balance in giants, values much larger would cause produce large discrepancies between dwarfs and giants in other elements, notably Ca, Ti, and Fe. We consider this possibility extremely unlikely and tentatively conclude that the difference in Na between giants and dwarfs is real, at the level of 0.2 dex. We note that the only subgiant in the sample, E95, has a Na abundance compatible with that of the dwarfs.
Aluminium: Al is stronger in giants than in dwarfs; the discrepancy is marginally within the errors, however. NLTE effects must also be taken into account for Al: According to Baumüller and & Gehren (1997), NLTE effects should increase the Na abundance in stars near solar metallicity when going from the main sequence to log = 3; they would therefore make the discrepancy even larger.
Chromium: In three stars (all dwarfs) we could measure only the line at 6362.88 Å. In the similar star T2105, this line gives an abundance about 0.2 dex higher than the other line used, at 6330.10 Å. The Cr I abundances given for these stars may therefore be about 0.2 dex higher than the real values and have not been used in the final computation.
Lithium: Li deserves particular attention, since the abundance is computed from only one line, and Li is expected to vary along the CMD. [Li/H] has been determined from the 6708 Å resonance doublet using MOOG; the equivalent width for this line was measured both automatically and manually for all the stars. In some cases, differences as large as 15 mÅ between the two measurements were found; in those cases, the manual measurements were repeated and found to be more reliable than the automatic ones; this is explained by the fact that the Li doublet is broader than normal single lines, so our version of DAOSPEC likely considered the Li line as a blend and underestimated its equivalent width.
S/N ratio estimates indicate upper limits to the measured equivalent widths as small as 1-2 mÅ in sharp-lined stars, but, because most of our stars rotate quite fast, we adopted conservative upper limits of 5 mÅ. For rapid rotators the measured equivalent width includes the contribution of the Fe 6707.46 line; for these stars, the measured EWs were corrected using the analytical approximation by Soderblom et al. (sod93 (1993)). B-V colors were corrected for reddening using our revised estimate of E(b-y)= 0.091, corresponding to E(B-V)= 0.13.
The Li abundance is very sensitive to the adopted Teff; we have computed it using both the spectroscopic Teff from the Fe analysis and the photometric Teff using the Alonso scale and E(b-y)= 0.091 (see above). For most stars the difference is negligible, and in no case will it influence our conclusions. We estimate the uncertainty in Teff to be about 200 K for dwarfs and TO stars and half that amount for the giants, corresponding to typical uncertainty of 0.2 dex in [Li/H] for all the stars. However, most of this is due to the uncertainty in E(b-y), and a change in E(b-y) would produce an almost constant shift of the Li abundances without affecting most of our conclusions, which are based on the pattern of changes in Li along the CMD.
Table 7 reports the Li equivalent widths and abundances for all the stars. Asterisks denote stars with unblended Li lines; for the other stars, the equivalent widths include the Fe I blend.
6 Discussion
6.1 Chemical composition of IC 4651
Our mean abundances for Fe and several other elements in IC4651 are all reported in Table 6. For most elements, accurate mean abundances for the whole cluster can be derived, given the very good agreement between the results for individual stars. In the following we will use the results for disk stars by Edvardsson et al. (1993) and Chen et al. (2000) as our reference in the comparisons.
6.1.1 elements: Mg, Si, Ti and Ca
[Mg/Fe] is the same for giants and dwarfs and slightly above Solar ([Mg/Fe]= 0.11). Considering that the cluster is metal rich, this fits the general trend of [Mg/Fe] in disk stars extremely well. In their discussion, Chen et al. (2000) conclude that the mechanisms of Mg production are not well understood, as some Mg seems to be produced much after SNe II cease to dominate the enrichment.
[Si/Fe] and [Ti/Fe] are also very well defined and slightly positive (0.07 - 0.08), like Mg. Together, the slight overabundance of all these elements is highly significant and fits the trend in field stars of comparable metallicity. In contrast, [Ca/Fe] is not significantly different from zero, so Ca seems not to share the overabundance of the other -elements.
Together, our results strongly indicate that none of the -elements is underabundant at this metallicity, so that the [/Fe] relation flattens out, or even increases, at high metallicity.
6.1.2 Sodium and aluminium
The behaviour of Na and Al is unfortunately less clean, mostly because of the abundance differences between giants and dwarfs. Our dwarf data would indicate that Al is slightly underabundant, at odds with what is found among field stars (Chen et al. 2000), while the low value of [Na/Fe] would completely agree with the field data, which are flat and scattered above the Solar [Fe/H]. We note also that low Na and Al are observed for the young stars in the Chen sample, which would be in better agreement with our data for the relatively young IC 4651. Given the discrepancy between giants and dwarfs, we can only conclude that the ratio of these elements to Fe is solar or slightly below for IC 4651.
For Na, we note that the dwarfs and the low-luminosity giant of the sample (E95) share the same low Na value, while all the other giants have much higher Na. We believe that this [Na/Fe] enhancement in the giants with respect to the dwarfs is real. A possible Na overabundance of the order of 0.2 dex has been identified also by Tautvaisiene et al. (2000) among the clump giants of M67, very similar to what we find in IC 4651 (0.28 dex). On the other hand, the same authors found no O deficiency nor any Al overabundance in their stars, showing that if the Na overabundance is due to internal nucleosynthesis plus mixing, then this process is not accompanied by the MgAl cycle. This would agree with other studies, which have shown that the MgAl cycle dominates at lower metallicity.
Na overabundances have been observed in A-F supergiants (Takeda & Takeda-Hiday 1994 and references therein). They are explained simply by a first-dredge up of 23Na, synthesized by the Ne-Na mode of H-burning while the star was on the main sequence (El Eid & Champagne 1995). Theory predicts that the post dredge-up enhancement of Na should increase with stellar mass so much less 23Na should be synthesized inside the present giant stars in IC4651 than in these A-F supergiants: Our 3.0M⊙ and 2.2M⊙ models (see §6.2.2) predict a Na enhancement of 0.3 dex and 0.12 dex, respectively, with respect to the initial main-sequence value.
Given the substantial uncertainty of the nuclear reactions involved in the 23Na production (Arnould et al. 1999) as well as the errors of our Na abundance determinations (0.15 dex for a Teff error of 100 K in the giants), we see no serious conflict between first dredge-up predictions and the observed Na abundances in the giant stars. We note, however, that if the reported difference in M67 is confirmed, this interpretation might be more problematic, given the substantially lower TO mass of the older M67.
6.1.3 The Fe group: Cr and Ni
With [Ni/Fe]= [Cr/Fe]= 0.05, both elements share the overabundance of Fe and the general trends found in field stars.
6.2 Lithium
6.2.1 Li abundances along the cluster sequence

In a detailed study of the intermediate-age open cluster NGC 3680, Pasquini et al. (2001) found, in addition to the standard features (i.e. the Li dip and the plateau for solar-type stars), that: a): Li reaches young Pop. I values on the bright side of the dip; b): Li drops dramatically in even brighter stars, as soon as they become slightly evolved; and c): Giants very close together in the CMD show substantial scatter in Li abundance, with the clump giants having a measurable amount of Li.
Given its similar age to NGC3680 (within 0.1-0.2 Gyr, Meibom et al. 2002), IC 4651 is a perfect object with which to test whether the results for NGC 3680 may apply to other clusters, and thus potentially to entire disk population of age 1.5-1.7 Gyr.
In Fig. 3 we plot the Li abundance vs. mV magnitude for both clusters (which are also at the same distance). The Li data for IC 4651 are from Table 7 (based on the photometric Teff), with an estimated uncertainty of 0.2 dex; the NGC 3680 data are from Pasquini et al. (2001). For comparison between the clusters this is preferable to the classical Li vs. Teff diagram because of the degeneracy of the latter in the critical turnoff region (Pasquini et al. 2001).
The different sections of the CMD are also indicated in Fig. 3. Moving from left to right, the diagram thus shows what happens in stars with increasing initial mass.
The Li abundance is an extremely tight function of , confirming that the pattern observed in NGC 3680 is indeed common to both clusters; viz.:
-
•
Stars fainter than the Li dip (the 3 solar-type stars E7, E45 and T2105 analysed by Randich et al. 2000) have roughly the same Li abundance, slightly below the younger Hyades stars at the same temperature. Note that our values differ from those by Randich et al. (2000) because of the substantially higher Teff values adopted in the present work. The general discussion of solar-type stars in clusters in Pasquini et al. (2000) and Randich et al. (2000, 2002) will not be repeated here.
-
•
The Li dip is extremely very well defined, although for some of our stars we can only give upper limits to the Li abundance.
-
•
Immediately above the dip, the slightly more luminous stars (E5, E25, and T1228) have the meteoritic Li abundance (e.g. the initial Li content of the solar system, [Li/H]3.3) or even higher. This is near the bluest point on the TO, before the redward “hook” in the isochrones. Given the uncertainties in Teff, we do not consider the apparent super-meteoritic value to be significant. It is clear, however, that these stars have not suffered any significant surface depletion of Li during their main-sequence lifetime.
-
•
In dramatic contrast, the Li abundance drops precipitously by a factor of 10 or more in the stars that are just 0.25 mag brighter (E99 and the slightly brighter E3, E19 and E56).
-
•
Finally, the giants exhibit an extremely interesting behaviour: Out of five stars, three have only upper limits while Li is clearly detected in the two others, which are located in the clump region of the CMD.
In the following subsection we return to these patterns, which appear to be signatures of non-standard mixing processes in the stars.
6.2.2 Comparison with the predictions from rotating stellar models
The study of Li in open clusters is a very powerful tool to investigate the dynamical phenomena in the stellar interiors (e.g., Pasquini 2000, Deliyannis et al. 2000, Randich et al. 2000). In Talon & Charbonnel (1998, hereafter TC98) and Palacios et al. (2003, hereafter PTCF03), measurements of Li abundances and rotational velocities in young open clusters ( Per, Pleiades, Ursa Major, Coma Berenices, and the Hyades) were used to test the predictions of rotating stellar models including the most recent theoretical developments concerning meridional circulation, turbulence by shear instability, and atomic diffusion (see the above papers for a detailed description of the treatment of rotational mixing).
TC98, in particular, showed that the hot side of the Li dip in these young clusters is well described by these models, which also successfully reproduce the He, C, and N anomalies in O-type and early B-type stars (Talon et al. 1997) and in O supergiants, as well as the B depletion in main-sequence B-type stars (see Maeder & Meynet 2000 for references). Charbonnel & Talon (1999, hereafter CT99) and PTCF03 extended the comparison between model predictions and observations of Li to evolved stars originating from the hot side of the dip. At that time, however, the necessary data along the subgiant branch were available only for field stars (Wallerstein et al. 1994, Lèbre et al. 1999, do Nascimento et al. 1999, Randich et al. 1999), while the data for open clusters concerned only bright giants (Gilroy 1989). The comparison between the models and the data was very satisfactory.
Our present analysis, together with the previous results for NGC 3680, fills several gaps in the observational picture and provides tighter constraints on the models. On the one hand, we now have lithium data for main-sequence stars in open clusters with an age intermediate between the very well-studied young population (younger than the Hyades) and the old cluster M67. On the other hand, our abundance determinations trace the behaviour of lithium along the subgiant branch more precisely. This allows us to test the rotating models as regards the age-dependence of the Li dip and the Li post-main-sequence evolution simultaneously.
In the following we focus our attention on the stars on the blue side of the Li dip, ignoring the main-sequence stars cooler than 6500 K. For these “solar-type stars” indeed it has already been shown (Pasquini et al. 1994, Randich et al. 2000, 2002) that current models do not match the Li and Be observations. TC98 discussed this problem in terms of an additional mechanism, possibly related to internal gravity waves, which transports angular momentum efficiently in these lower-mass stars while it is inefficient on the blue side of the dip (see also CT99 and TC03 for more details). New models for low-mass stars of the red side of the dip, including angular momentum transport by gravity waves in addition to the hydrodynamical processes induced by rotation, are not yet available.
Here, we compare the predictions of the CT99 and PTCF03 models for stars on the blue side of the dip with the Li data in IC 4651 in the classical way, i.e., as functions of Teff separately for the main-sequence and turnoff stars (Fig. 4) and for the evolved stars (Fig. 5). The small differences in the description of the rotation-induced mixing in the two sets of models (see PTCF03 for a detailed discussion) enable us to combine their predictions and compare them to the present data. The initial rotation velocity used in both studies was very similar (100 or 110 km s-1), and the stars were assumed to undergo magnetic braking leading to the observed rotation velocities at the age of the Hyades.
Main sequence and turnoff stars
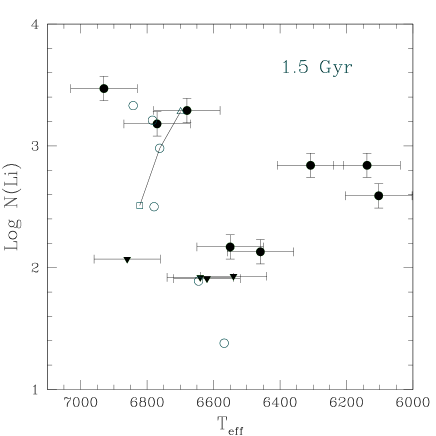
Fig. 4 compares the predictions of the models for an age of 1.5 Gyr to our observational data for the main-sequence and turnoff stars in IC 4651. Our photometric values of Teff and the corresponding log N(Li) are shown (black points: actual determinations; black triangles: upper limits). Open symbols show the model predictions at 1.5 Gyr. The open circles correspond to models with an initial rotation velocity of 110 km s-1. For the 1.5M⊙ model, this circle is for an initial of 100 km s-1, and it is connected to the predictions for an initial velocity of 50 km s-1 (open triangle) and 150 km s-1 (open square). These points provide an estimate of the expected dispersion at an age of 1.5 Gyr for stars inside the Li dip which have undergone relatively strong braking early on the main sequence; it should be lower for more massive stars with thinner convective envelopes, for which the braking is less efficient. As can be seen, the models that already explained the shape of the hot side of the Li dip in the young open clusters also successfully account for the Li behaviour at later ages.
We note that the rotating models have been computed without adhoc convective core overshooting. However, rotational mixing naturally extends the convective core compared to the classical case, and has a similar effect as overshooting on the main-sequence lifetime and the turnoff shape in the HRD (this also explains why models for a given initial mass, but different initial rotational velocities show a range in Teff at a given age, as seen in Fig. 4 for the 1.5M⊙ model). More extended grids of rotating models and corresponding isochrones now need to be computed and compared to colour-magnitude diagrams of open clusters with various ages.
Subgiant stars
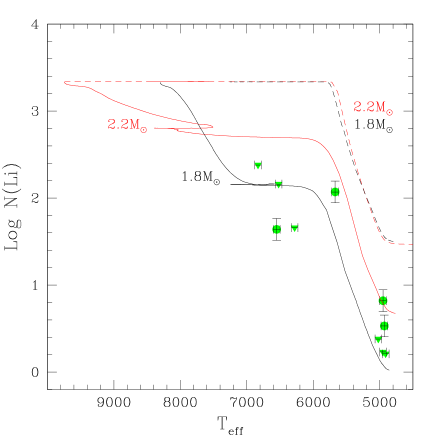
We now turn to our sample of post-turnoff stars in IC 4651. Fig. 5 compares their Li abundances as a function of Teff with stellar models from PTCF03. The dashed lines show the evolution of the surface Li abundance in standard (i.e. non-rotating) models for 1.8 M⊙ and 2.2 M⊙. In both cases, surface Li depletion only begins inside the Herzsprung gap at 5800 K and is simply due to dilution as the convective zone deepens. The observed drop in lithium at much higher Teff cannot be explained by just this classical effect. Exactly the same behaviour is observed in NGC 3680 stars and in other clusters with turnoff masses above 1.6 M⊙ (Gilroy 1989; Pasquini et al. 2001) and in field stars (see PTCF03 and references therein).
This points to a mechanism which is characteristic of stars originating from the hot side of the Li dip and is already efficient on the main sequence, even if its signature appears only as the stars start to cross the Hertzsprung gap (Vauclair 1991; Charbonnel & Vauclair 1992). By enlarging the Li-free regions inside these objects relative to the classical case, rotation-induced mixing actually prepares the stars for the Li abundance variations seen in later evolutionary phases. The predicted behaviour of their surface Li is shown in Fig. 5 (fulllines).
As can be seen, the rotating model for 1.8 M⊙ (the approximate turnoff mass of IC 4651) exhibits earlier surface Li depletion than in the classical case (i.e., at higher Teff). This model, computed with an initial rotation velocity of 110 km s-1 as described previously, also explains the data for field subgiant stars, as discussed in CT99 and PTCF03 (see Fig. 10 of PTCF03). The present comparison shows that it also nicely matches the data for the subgiant stars in IC 4651. As already discussed for our main-sequence stars, one expects a dispersion in initial which will account for the observed dispersion in the sample.
Giant stars
We end our discussion with the giant stars in IC 4651, which are also included in Fig. 5 (data points at 4900-5000K). As indicated by isochrone fits to the cluster (see e.g Meibom et al. 2002), these stars have masses higher than 1.8 M⊙ (the exact mass range depending on the physics included in the various sets of models). As can be seen, standard models for these objects lead to post-dilution Li abundances that are much higher than observed. The rotating models, however, predict a total Li depletion after dredge-up that is much larger than in the standard case, and again fit the observations very satisfactorily. The conclusions by CT99 and PTCF03, that the rotating models can explain the mean Li depletion and abundance dispersion in evolved stars above 1.4 M⊙ in the field and in open cluster are thus confirmed.
Cluster giants were discussed extensively by Pasquini et al. (2001), who speculated that clump giants could show more Li than stars on the first ascent of the RGB. Our observations of IC 4651 could possibly support this hypothesis. Indeed also in this cluster we observe only upper limits for the stars that are found away from the clump, which are lower than our typical detections in the stars in the clump region. Again, rotating models could provide a plausible explanation: in a given cluster, the clump giants had slightly higher initial masses than the RGB stars, and both theory and observations imply that they have undergone more modest braking while on the main sequence; thus, retaining more Li. This can be seen in Fig. 5, where the Li abundance after dredge-up in the 2.2 M⊙ rotating model is higher than in the 1.8 M⊙ model and fits the clump data perfectly. However, in a given cluster the difference in masses between RGB and clump stars can be at most of 0.1 M⊙, which does not seem enough to justify the difference.
The real point is that in the considered clusters it is very difficult to firmly establish which really are the clump stars. Antony-Twarog et al. (2004) conclude for instance that the high Li stars in NGC3680 could well be RGB objects rather than clump stars. In view of these considerations we consider the previous hypothesis as rather unlikely.
Another possibility is that some Li is produced after the end of the first dredge-up. The RGB bump is the most attractive phase where this might take place, as shown by Charbonnel & Balachandran (2000). At that time, the outward-moving hydrogen burning shell burns through the mean molecular weight discontinuity created by the first dredge-up. An extra-mixing process can then easily connect the 3He-rich envelope material to the outer regions of the hydrogen burning shell, enabling Li production to occur. Very high lithium abundances can then be reached, as confirmed by the existence of the so-called “lithium-rich giants”. This phase is extremely short-lived and is followed by a phase where deeper mixing destroys the freshly synthesized Li and lowers the carbon isotopic ratio (e.g., Charbonnel et al. 1998). Palacios et al. (2001) discussed this extra-mixing process in the framework of rotation-induced mixing and called this episode the “lithium flash”.
In the present context, the fact that the giant stars in NGC 3680 and IC 4651 have higher Li abundances than their counterparts in NGC 752 (see Pasquini et al. 2001) may be significant. As discussed by Anthony-Twarog & Twarog (2004), the giants in NGC 3680, and possibly also in IC 4651, could be predominantly first-ascent giants in the bump phase, while the lithium-poor giants in NGC 752 would be clump stars. It is worth noting, however, that these objects are just in the critical mass range where He ignition passes from a degenerate-core flash to a quiescent process. The He flash occurs in less massive stars (found in older clusters like NGC 3680 and IC 4651), which will indeed go through the RGB bump and undergo some Li enrichment. The slightly more massive stars in younger clusters like NGC 752 will ignite He before going through the bump, and thus without undergoing the Li flash. An analysis of the ratio and Be abundance in the giants of these three clusters will allow to test if this explanation is correct.
7 Conclusions
Our superb high resolution, high S/N ratio spectra from the ESO VLT/UVES of 23 stars in the intermediate-age open cluster IC 4651 have enabled us to perform an accurate chemical analysis of stars in critical phases along the CMD of this cluster. Abundances of the Fe-peak and elements and Li have been derived and interpreted with the help of state-of-the-art evolutionary models incorporating rotational mixing.
We find that the reddening towards the cluster was previously slightly underestimated and we derive a new value of E(b-y)= 0.091. We confirm that the Fe abundance of IC 4651 is supersolar ([Fe/H]= 0.10]), and that the cluster shows a small -element enhancement. For most elements, the abundances of main-sequence and giant stars are in excellent agreement, but Na is overabundant in the giant stars with respect to the dwarfs. We interpret this as evidence for dredge-up of Ne processed material.
We discuss Li extensively: The trends of Li abundance vs. mass and stage of evolution follow very closely the dramatic variations observed in the similar cluster NGC 3680 (Pasquini et al. 2001), confirming that our results for these clusters are typical of disk stars at an age of 1.6-1.8 Gyr. The observed behaviour of Li in stars more massive than those in the Li dip is very well reproduced by the most recent stellar evolution models which include rotational mixing. Finally, the pattern of Li depletions in the giant stars is still quite puzzling, and its interpretation critically depends on our ability to discriminate between first-ascent RGB and clump stars.
Further analysis of other elements in IC 4651 is in progress, but the present work has already made IC 4651 a member of the tiny club of open clusters with precise, detailed spectroscopic abundances.
Acknowledgements.
We thank S. Meibom for the opportunity to select our programme stars from his thesis in advance of publication, P. Stetson for similarly providing DAOSPEC before publication, and J. Andersen for fruitful discussions and comments on an earlier draft of the paper. BN thanks the Carlsberg Foundation, the Danish Natural Science Research Council, the Swedish Research Council, and the Nordic Academy for Advanced Study for financial support. We Finally thank the referee, B. Anthony-Twarog, for useful comments.References
- (1) Alonso, A., Arribas, R., Martinez-Roger, C. 1996, A&AS, 117, 227
- (2) Alonso, A., Arribas, R., Martinez-Roger, C. 1999, A&AS, 140, 261
- (3) Anders, E., and Grevesse, N. 1989, GeoCoA, 53, 197
- (4) Anthony-Twarog, B. J., & Twarog, B. A. 1987, AJ, 94, 1222
- (5) Anthony-Twarog, B.J., Mukherjee, K., Twarog, B.A., Caldwell, N. 1988, AJ 95, 1453
- (6) Anthony-Twarog, B.J., Twarog, B.A., 2000, AJ, 119, 2282
- (7) Anthony-Twarog, B.J., Twarog, B.A., 2004, AJ, 126, 1000
- (8) Arnould, M., Goriely, S., Jorissen, A., 1999, A&A, 347, 572
- (9) Ballester, P., Modigliani, A. et al., 2000, The Messenger 101, 31
- (10) Baumüller, D., Gehren, T., 1997, A&A 325, 1088
- (11) Boesgaard, A.M., Tripicco, M.J., 1986, ApJ 303, 724
- (12) Chaboyer B., Demarque P., Guenther D.B., Pinsonneault M.H., 1995, ApJ 446, 435
- (13) Charbonnel, C., Balachandran, S., 2000, A&A, 359, 563
- (14) Charbonnel, C., Talon, S., 1999, A&A, 351, 653
- (15) Charbonnel, C., Vauclair, S., 1992, A&A, 265, 55
- (16) Chen, Y.Q., Nissen, P.E., Zhao, G., Zhang, H.W., Benoni, T., 2000, A&AS 141, 491
- (17) Dekker, H., D’ Odorico, S., Kaufer, A., Delabre, B., Kotzlowski, H., 2000, SPIE 4008, 534
- (18) Deliyannis, C.P., Pinsonneault, M., Charbonnel, C., 2000, Proceedings of IAU Symposium 198 “The light elements and their evolution”, Eds. L. da Silva, R. de Medeiros, & M Spite, p. 61
- (19) do Nascimento, J.D., Charbonnel, C., Lèbre, A., de Laverny, P., de Medeiros, 2000, A&A, 357, 931
- (20) Edvardsson, B., Andersen, J., et al. 1993, A&A 275, 101
- (21) Eggen, O.J. 1971, ApJ 166, 87
- (22) El Eid, M.F., Champagne, A.E., 1995, ApJ, 451, 298
- (23) Gilroy, K.K., 1989, ApJ, 347, 835
- (24) Girardi, L., Bressan, A., Bertelli, G., Chiosi, C. 2000, A&AS 141, 371
- (25) Gratton, R.G., Carretta, E., Eriksson, K., Gustafsson, B. 1999, A&A 350, 955
- (26) Gratton, R. 2000, ASP Conf. Ser. 198, p. 225
- (27) Gustafsson, B., Bell, R.A., Eriksson, K., Nordlund, A.. 1975, A&A 42, 407
- (28) Kupka, F., Piskunov, N.E., Ryabchikova, T.A., Stempels, H.C., Weiss, W.W., 1999, A&AS 138, 119
- (29) Kurucz R.L. 1995, ApJ, 452, 102
- (30) Lèbre, A., de Laverny, P., de Medeiros, J.R., Charbonnel, C., da Silva, L., 1999, A&A, 345, 936
- (31) Lindoff, U. 1972, A&AS, 7, 231
- (32) Maeder, A., Meynet, G., 2000, ARA&A, 38, 143
- (33) Meibom, S. 2000, A&A 361, 929 interiors”, IAU Symposium 181, poster volume, Eds. Provost J. & Schmider F.X.
- (34) Meibom, S., Andersen, J., Nordström, B. 2002, A&A 386, 187 A&A, 375, 851
- (35) Nordström, B., Andersen, J., Andersen, M.I., 1997, A&A 322, 460
- (36) Palacios, A., Charbonnel, C., Forestini, M., 2001, A&A, 375, L9
- (37) Palacios, A., Talon, S., Charbonnel, C., Forestini, M. 2003, A&A 399, 603
- (38) Pancino, E., Pasquini, L., Hill, V., Ferraro, F., Bellazzini, M. 2002, ApJ 568, L101
- (39) Pasquini, L., Liu, Q., Pallavicini, R. 1994, A&A 287, 191
- (40) Pasquini, L. 2000, Proceedings of IAU Symposium 198 “The light elements and their evolution”, Eds. L. da silva, R. de Medeiros, & M Spite, p. 269
- (41) Pasquini, L., Randich, S., Pallavicini, R. 2001, A&A 374, 1017
- (42) Randich, S., Pasquini, L., Pallavicini, R. 2000, A&A 356, L25 A&A, 361, 1011
- (43) Randich, S., Gratton, R.G., Pallavicini, R., Pasquini, L. 1999, A&A 348, 487
- (44) Randich, S., Primas, F., Pasquini, L., Pallavicini, R. 2002, A&A 387, 222
- (45) Sneden, C.A. 1973, ApJ, 184, 839
- (46) Soderblom, D.R., Jones, B.F., Balachandran, S., et al. 1993, AJ, 106, 1059
- (47) Spite, M. 1967, Annales d’ Astrophysique, 30, 211
- (48) Stetson, P., Pancino, E. et al. 2004, in preparation.
- (49) Talon, S., Charbonnel, C., 1998, A&A, 335, 959
- (50) Talon, S., Charbonnel, C., 2003, A&A, 405, 1025
- (51) Talon, S., Zahn, J.P., Maeder, G., Meynet, A., 1997, A&A 322, 209
- (52) Takeda, Y., Takeda-Hiday, M., 1994, PASJ, 46, 395
- (53) Tautvaisiene, G., Edvardsson, B., Tuominen, I., Ilyin, I 2000, A&A 360, 499
- (54) Tosi, M. 2000, in “The evolution of the Milky way: stars vs. clusters”, F. Matteucci and F. Giovannelli eds., p. 505 (Kluwer)
- (55) Vauclair, S., IAU Symp. 145, Evolution of Stars: The photospheric abundance connection, Eds. G. Michaud & A. Tutukov, 327
- (56) Wallerstein, G., Böhm-Vitense, E., Vanture, A.D., Gonzalez, G., 1994, AJ, 107, 221