The extended star formation history of Centauri††thanks: Based on observations obtained at the European Southern Observatory, Chile (Observing Programme 69.D–0172).
For the first time, the abundances of a large sample of subgiant and turn-off region stars in Centauri have been measured, the data base being medium resolution spectroscopy from FORS2 at the VLT. Absolute iron abundances were derived for 400 member stars from newly defined line indices with an accuracy of dex. The abundances range between [Fe/H] dex, resembling the large metallicity spread found for red giant branch stars. The combination of the spectroscopic results with the location of the stars in the colour magnitude diagram has been used to estimate ages for the individual stars. Whereas most of the metal-poor stars are consistent with a single old stellar population, stars with abundances higher than [Fe/H] dex are younger. The total age spread in Cent is about 3 Gyr. The monotonically increasing age-metallicity relation seems to level off above [Fe/H] dex. Whether the star formation in Cen occured continuously or rather episodically has to be shown by combining more accurate abundances with highest quality photometry.
Key Words.:
stars: abundances – globular clusters: individual: Cen, M55 – galaxies: dwarf – galaxies: nuclei1 Introduction
Centauri is the most outstanding stellar cluster in our Milky Way in many respects. It’s the most massive and flattened cluster, and revolves the Milky Way in a retrograde orbit, unlike most other Galactic globular clusters. Many photometric and spectroscopic studies have confirmed a wide spread in metallicity among its stars. This concerns all observed elements (see the review by Smith smith04 (2004)). It seems that the stars in Cen can be divided into three main sub-populations: 1) a metal-poor population ([Fe/H] dex), comprising about 70% of all stars; 2) an intermediate metallicity population ([Fe/H] dex) with 25% of the stars; and 3) a distinct population (5%) of metal-rich stars ([Fe/H] dex). These sub-populations exhibit different behaviours in their spatial distribution and kinematical properties. For references and a recent summary on the properties of Cen, see the contributions in the conference proceedings by van Leeuwen et al. (vanl02 (2002)).
Many ideas have been brought forward to explain Cen. The most promising formation scenarios assume an extragalactic origin: it might be the nucleus of a disrupted dwarf galaxy (first suggested by Zinnecker et al. zinne88 (1988)), or the merger product of a super-cluster conglomerate that was created in an interaction event of our galaxy with another star-forming galaxy (Fellhauer & Kroupa fell03a (2003)).
An important parameter that can help to uncover the formation history of Cen is the relative age of the different stellar populations. Until now, only rough estimates of their ages have been made, using broad and narrow band photometry (Hilker & Richtler hilk00b (2000), Rey et al. rey04 (2004), Hughes et al. hugh04 (2004)). These studies suggest a time scale of chemical enrichment of up to 6 Gyr. Hilker & Richtler (hilk00b (2000), hilk02a (2002)) argued for an extended formation period of Cen in order to explain the tight correlation between CN-band strengths and iron abundances. Since nitrogen is predominantly provided by the debris of AGB stars and iron by SNe II with greatly different evolutionary timescales, a natural explanation would be multiple star formation events, triggered by gas accretion from outside Cen and interrupted by long periods of quiescence. Also the abundance pattern of s- and r-process elements demand the contribution of low-mass AGB stars (Smith et al. smith00 (2000)). Only the most metal-rich stars seem to be enriched by SNe Ia (Pancino et al. panc02 (2002)).
In this paper, we present first results of a large spectroscopic survey, dedicated to abundance measurements of subgiant branch (SGB) and main sequence turn-off (MSTO) region stars. This is the most age-sensitive region in the CMD. With the metallicity of a star in hand, its age can be estimated by comparing its position in the CMD with appropriate isochrones. We demonstrate that the suspected age spread among the stellar sub-population in Cen definitely exists.
2 Observations and data analysis
The observations were performed in May 2002 with the VLT/UT4 at Paranal (ESO), Chile. The instrument in use was the FORS2 camera with the mask exchange unit MXU, and a 44 k MIT CCD attached.
About 620 stars, selected from Strömgren photometry by Hilker & Richtler (hilk00b (2000)), were observed through 11 slit masks in 5 fields around Cen. Additionally, spectra of 17 standard stars (Cayrel de Strobel et al. cayr01 (1996)) and MSTO and SGB stars in M55 have been taken. Two grisms per mask were used: 1400V+18 and 600I+25 in second order. The first grism has a dispersion of 0.62 Å pix-1 and covers a wavelength range of 4560-5860 Å, the specifications of the second one are 0.58 Å pix-1 and 3690-4880 Å. Together with the seeing and a slit width of 1″, the resulting resolution is 2-2.5 Å.
The CCD frames were processed with standard IRAF routines. The signal-to-noise of the wavelength calibrated, rebinned (1Å/pixel) spectra varied between 30 and 100 per pixel depending on the considered wavelength range and the luminosity of the star.
Out of the 620 observed stars, 447 are, according to their radial velocities and position in the CMD, SGB and MSTO region stars of Cen. In M55, 38 member stars were observed in the MSTO/SGB region.
The determination of abundances was performed by measuring the pseudo-equivalent widths of several absorption lines. For that, line indices have been defined analogous to the definition of Lick indices, but with much smaller bandwidths. The uncertainties of the indices have been estimated from the noise in the continuum and sky spectra. For the further analysis, the spectra have been classified by their quality (good/bad signal-to-noise, right/wrong tracing, good/bad sky subtraction, etc.). About 430 spectra passed the quality check as good and best.
The equivalent widths of the Balmer indices Hδ and Hγ have been combined to define an average Balmer index H. The iron abundances of the stars have been deduced from the average of 6 strong iron absorption lines between 4000 and 5300 Å and a magnesium line at 5138 Å. Prior to combination all indices have been scaled in such a way that the average line strength takes the value 1 at H. This average index Fe has been used in the further analysis. The effect of temperature and gravity on Fe has been tested by simulating the measurements of Fe and H on synthetic spectra with known parameters (taken from Bailer-Jones bail00 (2000)). Whereas the dependence of Fe on is small, Fe increases notably with decreasing within the temperature range of SGB stars.
However, the temperature effect alone cannot explain the large scatter in Fe at all H values/colours (see Fig. 1). This scatter is mostly due to the intrinsic iron abundance spread of the stars in Cen.
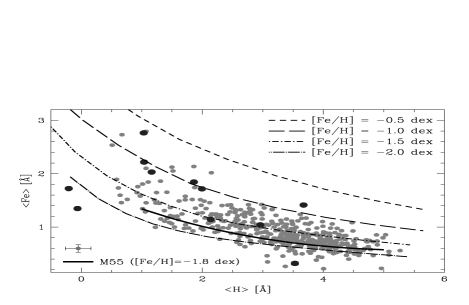
In order to find the absolute [Fe/H] values of the MSTO and SGB stars, their distribution in the H-Fe diagram (Fig. 1) has been compared with that of the standard stars, the M55 stars, and the iso-metallicity curves of the synthetic spectra. All these calibrators are consistent with each other. To each star a [Fe/H] value has been assigned by establishing an analytical relation between H and Fe, based on the data points of the calibrators. A polynomial of 4th order in both coordinates gives an accurate fit with an rms of 0.02. The error in [Fe/H] was propagated from the measurement errors of the line indices. Typical errors are in the range 0.1-0.2 dex. This is the so far highest accuracy in iron abundance determinations for MSTO/SGB stars in Cen. A direct comparison of the spectroscopic abundances of 165 MSTO stars with their determined Strömgren metallicities (Hilker & Richtler hilk00b (2000)) reveals a scatter of about 0.5 dex in the photometrically deduced abundances at any [Fe/H] value. Moreover, the Strömgren colours have considerable photometric errors in the turn-off domain and in addition are not only sensitive to iron but also to nitrogen.
Further details of the observations and data analysis will be given in Kayser et al. (2004, in prep.).
3 Relating metallicities with ages
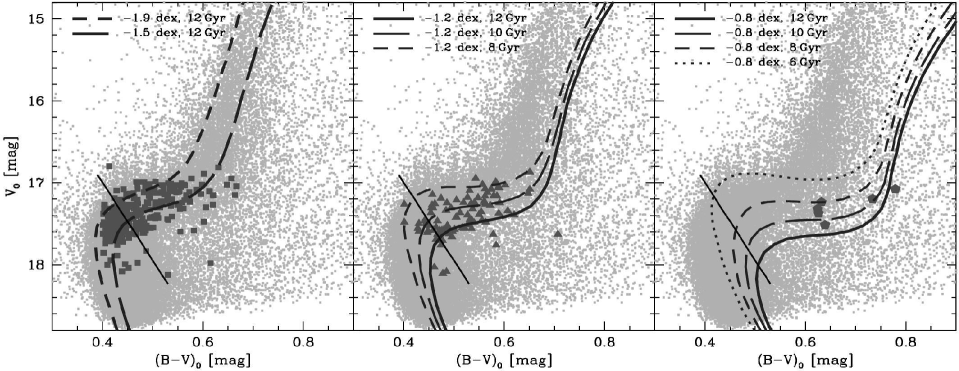
Having the [Fe/H] values for our sample stars, one can identify their position in a CMD and fit them by appropriate isochrones. For our purposes we used the wide-field data by Rey et al. (rey04 (2004)), corrected for reddening with mag. We used the Yonsei-Yale isochrones (Kim et al. kim02 (2002)) for the age determination. The distance modulus to Cen was assumed to be mag (van Leeuwen et al. vanl02 (2002)).
In Fig. 2, the distribution of stars for three metallicity ranges is shown. The metal-poor population ([Fe/H] dex) is mainly located between the isochrones of and dex and 12 Gyr. The -abundance is assumed to be [/Fe] dex. More metal-rich stars ([Fe/H] dex) are not consistent with an isochrone of 12 Gyr, but rather scatter around isochrones that are up to 2 Gyr younger. Finally, the most metal-rich stars ([Fe/H] dex) are distributed between isochrones of 9 to 11 Gyr when assuming a metallicity of dex and [/Fe] dex (e.g. Pancino et al. panc02 (2002)). From this analysis alone it is clear that the different sub-populations in Cen do not share the same age.
To establish an age-metallicity relation, the age of each star was extrapolated from an isochrone grid (Kim et al. kim02 (2002)) taking its metallicity as determined from Fig. 1. The grid steps were 0.5 Gyr in age and 0.1 dex in metallicity. The errors in the age determination for each star have been estimated by taking isochrones of its maximum and minimum metallicity as defined by the [Fe/H] error.
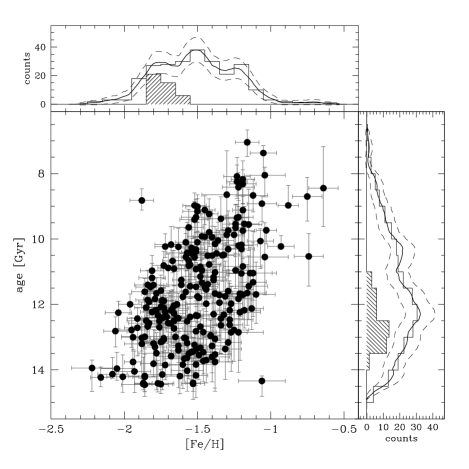
In Fig. 3, the age-metallicity relation for about 250 SGB stars (located redwards the diagonal line in Fig. 2) are shown. As a comparison the histograms of 14 SGB stars of M55 are also shown. These stars are supposed to have a single age ( Gyr) and metallicity ( dex), and thus show the accuracy of the age and metallicity determination. Whereas the stars of Cen in the range [Fe/H] dex () might be consistent with a single old age of Gyr, the more metal-rich stars are significantly younger. The mean age of stars with [Fe/H] () is Gyr, and for the most metal-rich stars ([Fe/H], ) Gyr. In Table 1 the average ages of the different sub-populations in Cen are summarized in dependence of the adopted distance modulus and reddening value.
4 Discussion and Conclusions
The abundance measurements of MSTO/SGB stars in Cen have shown that the large metallicity spread seen for the RGB stars also exists for MSTO stars, as expected. Although our spectroscopic sample may not be statistically complete due to selection effects, we see that the stellar population in the MSTO/SGB region is dominated by metal-poor stars (also consistent with the RGB results). There might exist a small number of very metal-poor stars ([Fe/H]). Still it has to be shown whether these stars form a genuine cluster population or, for example, have been accidentally caught by Cen.
The more metal-rich stars are definitely younger than the dominant metal-poor population. This is the first time that the suspected age spread has been confirmed by direct accurate abundance measurements in the age-sensitive MSTO/SGB region. Although the absolute ages determined with the Yonsei-Yale isochrones changes when using different reddening and/or distance modulus values, the overall trend of metal-rich stars being younger than metal-poor ones does not change (see average ages of sub-populations in Table 1).
An interesting feature appears at the metallicity of [Fe/H] dex. Whereas stars more metal-poor than dex follow a linearly increasing age-metallicity relation, stars above this metallicity are not getting younger any more, but rather show the same age as stars around dex. Due to the low number statistics it is not clear whether these stars are compatible with a single age or whether they have a significant age spread.
Whereas the existence of an age-metallicity relation is established, its meaning and detailed properties still remain obscure. The width, for example, needs confirmation. At a metallicity of 1.5 dex, we find stars covering a large age interval. If this is true, self-enrichment of Cen must have had an extremely local character, which contradicts cluster-wide correlations between different elements. This adds to the difficulty of how a considerable amount of gas could have been retained for some Gyrs in spite of the enormous star formation activity. A more plausible scenario would be the accretion of gas from outside Cen, resulting in many star formation periods as sketched by Hilker & Richtler (hilk00b (2000)). The next step should be the investigation of abundance correlations among turn-off and main-sequence stars, particularly the correlation between [Fe/H] and s-process elements (Smith smith04 (2004)). The Strömgren photometry indicates that already among the metal-poor population, the nitrogen enrichment was much faster than the enrichment of Ca, which is hard to explain with pure self-enrichment of Cen.
Recent deep photometric investigations of Cen with the HST revealed the existence of multiple subgiant branches, turn-offs and a bifurcated main sequence (Ferraro et al. ferro04 (2004); Bedin et al. bedi04 (2004)). Our results are in some contradiction to one of the suggestions by Ferraro et al. who propose that the SGB that seems to belong to the most metal-rich population of the RGB ([Fe/H]) can be best fitted by an isochrone as old as the one for the metal-poor population. However, the exact shape of this SGB cannot be reproduced by their set of isochrones, perhaps indicating that some kind of abundance anomaly might be present. Indeed, the reddest most metal-rich star (see Fig. 2) does not seem to be compatible with any of the isochrones, and thus mimics an old age. We note that our sample of most metal-rich stars is very small (5 stars) and has an average metallicity of about dex. Unfortunately, our data have no overlap with the existing HST data.
Even more puzzling, the upper MS is bifurcated in such a way that about 25% of its stars lie bluewards to the bulk of MS stars (Bedin et al. bedi04 (2004)). This would normally be interpreted as a metal-poor stellar population. However, the ratio of metal-poor to metal-rich stars is just the opposite. If the very blue MS represents the more metal-rich population this would imply either an extraordinary high helium abundance of these stars or a distance gap between the populations. Bedin et al. suggest that the intermediate metallicity population could be located about 1.6 kpc behind the metal-poor stars. This corresponds to 0.57 mag in distance modulus. Shifting the dex isochrones (Fig. 2) by this amount to fainter magnitudes would decrease the ages of the intermediate metallicity stars by another 2-3 Gyr, thus even increasing the age spread within Cen. On the other hand, if the He content of these stars is very high, this would shift its MS to bluer colours, and hardly would affect the position of the SGB. Thus, the age estimates would not change.
| mag] | [mag] | [Gyr] | [Gyr] | [Gyr] |
|---|---|---|---|---|
| 13.85 | 0.11 | |||
| 14.00 | 0.11 | |||
| 13.70 | 0.11 | |||
| 13.85 | 0.13 | |||
| 13.85 | 0.09 |
Although an age spread among the different populations in Cen has been confirmed by our data and an age-metallicity relation has been established, the population puzzle in Cen needs further observational and theoretical input. With the new photometric data available (HST/VLT), we now have the possibility to accurately select SGB and upper MS stars from a certain sub-population for further spectroscopic analysis.
Acknowledgements.
The authors are very grateful to S.-C. Rey for providing the data. T.R. acknowledges support by the FONDAP Center for Astrophysics, Conicyt 15010003. We also thank C.A.L. Bailer-Jones for calculating synthetic spectra at our request, and thanks to the anonymous refere for his useful comments.References
- (1) Bailer-Jones, C.A.L. 2000, A&A, 357, 197
- (2) Bedin, L.R., Piotto, G., Anderson, J., et al. 2004, ApJ, 605, L125
- (3) Cayrel de Strobel, G., Soubiran, C., & Ralite, N. 2001, A&A, 373, 159
- (4) Fellhauer, M. & Kroupa, P. 2003, Ap&SS, 284, 643
- (5) Ferraro, F.R., Sollima, A., Pancino, E., et al. 2004, ApJ, 605, L29
- (6) Hilker, M., & Richtler, T. 2000, A&A, 362, 895
- (7) Hilker, M., & Richtler, T. 2002, in Centauri: A Unique Window into Astrophysics, eds. F. van Leeuwen, G. Piotto, & J.D. Hughes, (San Francisco: ASP), p. 59
- (8) Hughes, J.D., Wallerstein, G., van Leeuwen, F., & Hilker, M. 2004, AJ, 127, 980
- (9) Kim, Y.-C., Demarque, P., Yi, S.K. & Alexander, D.R. 2002, ApJS, 143, 499
- (10) Pancino, E., Pasquini, L., Hill, V., Ferraro, F.R., & Bellazzini, M. 2002, ApJ, 568, L101
- (11) Rey, S.-C., Lee, Y.-W., Ree, C.H., et al. 2004, AJ, 127, 958
- (12) Smith, V.V. 2004, Carnegie Observatories Astrophysics Series, Vol. 4: Origin and Evolution of the Elements, ed. A. McWilliam and M. Rauch (Cambridge: Cambridge Univ. Press)
- (13) Smith, V.V., Suntzeff, N.B., Cunha, K., et al. 2000, AJ, 119, 1239
- (14) van Leeuwen, F., Hughes, J.D., & Piotto, G., ed. 2002, Centauri: A Unique Window into Astrophysics (San Francisco: ASP)
- (15) Zinnecker, H., Keable, C.J., Dunlop, J.S., Cannon, J.D., & Griffiths, W.K. 1988, in “Globular Cluster Systems in Galaxies”, IAU Symp. 126, eds. J.E. Grinlay & A.G. Davis Philip, Kluwer, Dordrecht, p. 603