IRAC Imaging of the Lockman Hole
Abstract
IRAC imaging of a area in the Lockman Hole detected over 400 galaxies in the IRAC 3.6m and 4.5m bands, 120 in the 5.8m band, and 80 in the 8.0m band in 30 minutes of observing time. Color-color diagrams suggest that about half of these galaxies are at redshifts with about a quarter at higher redshifts (1.3). We also detect IRAC counterparts for 6 of the 7 SCUBA sources and all 9 XMM sources in this area. The detection of the counterparts of the SCUBA sources and galaxies at demonstrates the ability of IRAC to probe the universe at very high redshifts.
1 Introduction
Much effort has gone into deep optical imaging with hope of detecting galaxies at high redshifts (Koo & Kron, 1992; Ellis, 1997). Obtaining redshifts for faint, optically selected galaxies require long observations on 8-meter class telescopes, but most of the galaxies identified are at intermediate redshifts (z1) (Cowie et al., 1996; Cohen et al., 1999; Cimatti et al., 2002). Applying faintness criteria to visible-wavelength (UBVRI) surveys is not an efficient way of selecting high-redshift galaxies unless color selection methods such as the Lyman break technique (Steidel et al., 2003) or extreme red color selection (Thompson et al., 1999) are applied. Furthermore, optical studies of high redshift galaxies are heavily affected by dust extinction because rest-frame UV photons are being observed (Steidel et al., 2003).
By contrast, far-infrared and submillimeter surveys are efficient tools for generating samples of high-redshift starburst galaxies. For example, SCUBA on the JCMT has made it possible to carry out deep extragalactic surveys in the submm band. Now it is known that most SCUBA sources are ultra luminous infrared galaxies (ULIRG) at high redshifts. They are detected in the submillimeter band, because the infrared luminosity peak at about 100–200 µm shifts to the submillimeter and millimeter band at z2 (Chapman et al., 2003; Ivison et al., 2002; Smail et al., 2002).
Little is known about the properties of mid-infrared selected samples, although in principle they should have many advantages. Mid-infrared observations of high-redshift galaxies detect light emitted at 1-2 µm near the peak of the stellar emission. At these wavelengths the emission is only modestly affected by dust extinction. The difficulty is that a space observatory is essential for sensitive mid-infrared observations. The Infrared Space Observatory (ISO) (Kessler, 1996) carried out the first deep infrared extragalactic surveys and detected galaxies at redshifts up to in the mid–infrared bands (Oliver et al., 1997; Elbaz et al., 1999; Aussel et al., 1999; Genzel & Cesarsky, 2000; Dole et al., 2001; Sato et al., 2003). With its combination of high sensitivity and high spatial resolution in four mid-infrared bands, the Infrared Array Camera (IRAC) (Fazio et al., 2004) on the Spitzer Space Telescope (SST) can carry out deeper and larger surveys and should be able to detect galaxies at (Barmby et al., 2004).
This Letter reports the results of a SST survey carried out during the SST In-Orbit-Checkout (IOC) period. Observations were taken as one of the Early Release Observations to demonstrate the sensitivity of Spitzer and its capability of detecting galaxies at high redshifts. The program included both IRAC and MIPS observations of the same Lockman Hole field. Egami et al. (2004) and Le Floc’h et al. (2004) present the results of the MIPS observations of the same field. The survey area centered on RA(J2000)=10:51:56, DEC(J2000)=57:25:32 has been covered by surveys at many other wavelengths, including SCUBA, XMM, and deep optical/NIR imaging. Of seven SCUBA sources in the survey area, IRAC detected six in the 3.6 and 4.5 µm bands and four in the 5.8 and 8.0 m bands. IRAC also detected mid-infrared counterparts of all 9 XMM sources. Analysis of the Spitzer counterparts of the SCUBA, XMM and MAMBO sources are presented by Egami et al. (2004), Alonso-Herrero et al. (2004) and Ivison et al. (2004).
2 Observations and data reduction
The observations111Spitzer Program ID 1077, executed 2003 November 20 covered one field-of-view in all four IRAC bands. The observations used the 30-s frame time and 25 dithers per pointing, giving an exposure time (i.e., effective on-chip charge accumulation time after accounting for readout overheads) of 670 s in each band. We used a shorter frame time and many dithers to be able to reject cosmic-rays effectively. Because of the dithering, the area covered to full depth was .
Data processing began with the Basic Calibrated Data (BCD) delivered by the Spitzer Science Center (SSC). These data include flat-field corrections, dark subtraction, and linearity and flux calibrations. Additional steps included pointing refinement, distortion correction, and mosaicking. Cosmic rays were rejected during the last step by sigma-clipping.
Source extraction used DAOPHOT because the images are so crowded in the 3.6m and 4.5m bands even for the short observations reported here. Given the 18 FWHM of the point spread function (Fazio et al., 2004) in both bands, almost all faint sources are point-like. We used a signal/noise ratio of 2.5, and a PSF with full-widths at half-maximum (FHWM) of 18, 18, 20, and 20 in the 3.6, 4.5, 5.8, and 8.0 µm bands respectively as parameters for DAOPHOT.
Star/galaxy separation was based on morphology in deep R-band images taken with the Suprime camera on the Subaru Telescope and on a ( vs ) color-color diagram (Huang et al., 1997; Wilson et al., 2001). We identified 13 stars in the field with . Though fainter stars may be missed, their density is extremely low (Glazebrook et al., 1994). Table 1 gives the numbers of galaxies and stars detected in each band along with the limiting flux. The number of galaxies detected in the MIPS 24m band (Egami et al., 2004; Le Floc’h et al., 2004) is also in Table 1. Fewer sources were detected in the two long wavelength bands because of the high zodiacal background at those wavelengths. All objects detected at 5.8 or 8.0 µm are detected at both 3.6 and 4.5 µmṪhere are about 25000 “beams” in the field, and the 3.6 µm source counts thus correspond to 57 beams per source.
3 The Properties of Galaxies Detected by IRAC
With no redshifts available for most of the IRAC galaxy sample, we rely on color-color diagrams to estimate redshifts. In the rest near-infrared wavelength range, the most important spectral feature is the 1.6 m bump, which is caused by the H- opacity minimum in the atmospheres of cool stars. This feature is seen in the spectral energy distributions (SEDs) of all galaxies except AGN-dominated ones and has long been considered a photometric redshift indicator (Wright et al., 1994; Simpson & Eisenhardt, 1999; Sawicki, 2002). At , the bump shifts beyond the band, and . For , the bump passes 3.6 µm, and . Local, dusty starburst galaxies such as M82 also have red colors with , and we need to require to identify them.
Figures 1 and 2 show the IRAC data along with the tracks followed by typical galaxy SEDs as redshift increases, and Table 2 summarizes the observed galaxy number distribution as a function of color, which imply redshift. Figure 1 shows that the observed colors are consistent with the model tracks. The most-populated redshift bin in Table 2 for all four IRAC bands is . This bin includes about 50% of all detected IRAC galaxies. Figure 1 shows a few sources with very red K-[3.6] color. Wilson et al. (2004) found that these sources are actually the same extreme red objects as those detected in optical-near-infrared surveys using the (R-K)5 color selection.
The color-color diagrams will not give accurate redshifts for AGN, which do not exhibit the 1.6m bump in their SEDs. X-ray observation is a good way of detecting AGN. This field has 9 XMM sources (Hasinger et al., 2001), whose colors are plotted along with other galaxies in Figures 1 and 2. These 9 sources probably represent most of the AGN in the field and constitute only a few percent of the galaxies detected. Thus they should not affect our statistics on redshift distribution.
Unlike the XMM sources, whose color distribution fills the entire color space in Figures 1 and 2, most of the SCUBA source counterparts have colors indicating . Using the deep radio counterpart positions to identify the SCUBA sources in the optical and Spitzer images, Egami et al. (2004) did a detailed analysis of SED for the SCUBA sources. They found that LE 850.1222The full names according to SINBAD are of the form [SFD2002]LHE N., LE 850.4, LE 850.7, and LE 850.14 have the 1.6µm bump in their SEDs. This implies that their SEDs are dominated by stellar light, and thus their IRAC colors following the galaxy color tracks well in Figures 1 and 2 with expected redshfits . This is consistent with most of the SCUBA sources being dusty galaxies at (Chapman et al., 2003; Egami et al., 2004). LE 850.8 is the only object for which we have both SCUBA and XMM detection. Egami et al. (2004) found that LE 850.8 has a power-law continuum. Its IRAC colors are not close to any of the tracks in Figures 1 and 2. Another SCUBA source, LE 850.18, also has colors not close to any of the tracks and a power-law SED (Egami et al., 2004). In the deep R-band image, however, there are more than 2 objects within radius centered on the radio counterpart positions for both LE 850.8 and LE 850.18. IRAC will not be able to resolve them if all components emit in the IRAC bands. Hence we suspect foreground contamination in the IRAC flux densities in both cases and are cautious in using IRAC colors to classify both objects.
There are 32 sources in this field detected in the MIPS 24 µm band at or above the 5-sigma confidence level. Their IRAC counterparts show that half of the MIPS sources are at . Given the 5 limiting flux of 200 Jy, these MIPS sources at have a minimun infrared luminosity of 1012 L⊙, thus are LIRGs and ULIRGs (Le Floc’h et al., 2004).
The extragalactic background light (EBL) from both resolevd and unresolved extragalactic sources is an indicator of the total luminosity of the Unverse (Madau & Pozzetti, 2000). Because the intermediate redshift galaxy population contributes most to the EBL (Elbaz et al., 2002), integral resolved galaxy light (IGL) in a deep survey should give a good lower limit on the EBL. Table 3 shows the results of integrating the fluxes, , from IRAC counterparts of objects identified by SCUBA (Scott et al., 2001), XMM (Hasinger et al., 2001), and MIPS 24 µm images (Egami et al., 2004; Le Floc’h et al., 2004). The IGL at the 5.8 µm and 8.0 µm are 1.31 and 1.02 nW m-2 sr-1, very close to the ISO LW2 (6.75 µm) IGL, 1.70.5 nW m-2 sr-1 (Altieri et al., 1999; Elbaz et al., 2002). Given that the XMM sources in this field are neither stars or clusters, it is safe to assume that most of them are AGN (Lehmann et al., 2000; Alonso-Herrero et al., 2004). The light contributed by the XMM sources is constant in all four IRAC bands because of the flat SED of AGN in the mid-infrared. Because the total light decreases with wavelength, the XMM source contribution increases from 3.7% at 3.6 m to 13.6% at 8 m. This is consistent with the 155% XMM source contribution found by the ISO survey (Fadda et al., 2002). As shown in Figure 2, most of the MIPS 24 µm sources are at intermediate and high redshifts. Most of them must be LIRG’s or even ULIRG’s (Egami et al., 2004). The starburst light percentage increases from 20% at 3.6 m to 62% at 8 m. AGN and starburst galaxies together contribute about two thirds of the IGL at 8 m. The bulk of the light at 3.6 m and 4.5 m appears to come from evolved stars in galaxies, while the 8 m and 24 m light traces the star forming regions in galaxies. This explains the large contribution of the 24m selected sample to the 8m IGL.
4 CONCLUSIONS
Even with only 30 minutes observing time, IRAC detected 419 galaxies in a area in the Lockman Hole. Based on their colors, most of the detected galaxies are likely to be at intermediate redshifts , but 25% appear to be at . 30% of the 5.8 m sources and 50% of the 8.0 m sources show colors indicating higher redshifts (z1.3). The counterparts of the SCUBA sources have colors consistent with galaxies at . The integrated galaxy light seen in our sample is consistent with 1.70.5 nW m-2 sr-1 derived using the ISO survey data at the 6.75 m. The AGN fraction, as revealed by XMM, increases from 3.7% in the 3.6 m band to 13.6% in the 8.0 m band. The MIPS population, most of which are starburst galaxies at intermediate redshifts, contributes up to 60% in the 8.0m band.
References
- Alonso-Herrero et al. (2004) Alonso-Herrero et al. 2004, ApJ, submited.
- Altieri et al. (1999) Altieri, B., Metcalfe, L., & Kneib, J. P., et al. 1999, A&A, 343, L65
- Aussel et al. (1999) Aussel, H., Elbaz, D., & Cesarsky, C. J. 1999, Ap&SS, 266, 307
- Barmby et al. (2004) Barmby, P., Huang, J.-S., Fazio, G. G., at al. 2004, ApJ, submitted
- Chapman et al. (2003) Chapman, S. C., Blain, A. W., Ivison, R. J., & Smail, Ian R. 2003, Nature, 422, 369
- Cimatti et al. (2002) Cimatti, A., Mignoli, M., Daddi, E., et al. 2002, A&A, 392, 395
- Coleman et al. (1980) Coleman, G. D., Wu, C.-C., & Weedman, D. W. 1980, ApJS, 43, 393
- Cohen et al. (1999) Cohen, J G., Hogg, D W., Pahre, M A., Blandford, R, Shopbell, P L., & Richberg, K 1999, ApJS, 120 171
- Cowie et al. (1996) Cowie, L. L., Songaila, A., Hu, E. M., & Cohen, J. G. 1996, AJ, 112, 839
- Dole et al. (2001) Dole, H., Gispert, R., Lagache, G., et al. 2001, A&A, 372, 362
- Dole et al. (2004) Dole, H. et al 2004, ApJ, submitted
- Egami et al. (2004) Egami, E. et al 2004, ApJ, submitted
- Elbaz et al. (1999) Elbaz, D., Cesarsky, C. J., Fadda, D., et al. 1999, A&A, 351, 37
- Elbaz et al. (2002) Elbaz D., Cesarsky, C. J., Chanial, P., Aussel, H., Franceschini, A., Fadda, D., & Chary, R. R. 2002, A&A, 384, 848
- Ellis (1997) Ellis, R. S. 1997, ARA&A, 35, 389
- Fadda et al. (2002) Fadda, D., Flores, H., Hasinger, G., Franceschini, A., Altieri, B., Cesarsky, C. J., Elbaz, D., & Ferrando, Ph. 2002, A&A, 383, 838
- Fazio et al. (2004) Fazio, G. G. et al 2004, ApJ, submitted (performance)
- Genzel & Cesarsky (2000) Genzel, R, Cesarsky, C. J. 2000, ARA&A, 38, 761
- Glazebrook et al. (1994) Glazebrook, K., Peacock, J. A., Collins, C. A., & Miller, L. 1994, MNRAS, 266, 65
- Granato et al. (2000) Granato, G. L., Lacey, C. G., Silva, L., Bressan, A., Baugh, C. M., Cole, S., & Frenk, C. S. 2000, ApJ, 542, 710
- Hasinger et al. (2001) Hasinger, G., Altieri, B., Arnaud, M., et al. 2001, A&A, 365, 45
- Huang et al. (1997) Huang, J.-S., Cowie, L. L., Gardner, J. P., Hu, E. M., Songaila, A.,& Wainscoat, R. J. 1997, ApJ, 476, 12
- Ivison et al. (2002) Ivison, R. J., Greve, T. R., Smail, Ian, et al. 2002, MNRAS, 337, 1
- Ivison et al. (2004) Ivison, R. J., Greve, T. R., et al. 2004 ApJ, submitted
- Kessler (1996) Kessler, M. F. 1996, AAS, 188, 5201
- Koo & Kron (1992) Koo, D. C. & Kron, R. G 1992, ARA&A, 30, 613
- Lehmann et al. (2000) Lehmann, I., Hasinger, G., Schmidt, M., Gunn, J. E., Schneider, D. P., Giacconi, R., McCaughrean, M., Trumper, J., & Zamorani, G. 2000, A&A, 345, 35L
- Le Floc’h et al. (2004) Le Floc’h et al. 2004, submmited
- Lu et al. (2003) Lu, Nanyao, Helou, George, Werner, Michael W., et al. 2003, ApJ, 58, 199
- Kauffmann & Charlot (1998) Kauffmanm, G. & Charlot, S. 1998, MNRAS, 297, L23
- Madau & Pozzetti (2000) Madau, P. & Pozzetti, L. 2000, MNRAS, 312, L9
- Oliver et al. (1997) Oliver, S. J., Goldschmidt, P., Franceschini, A., et al. 1997, MNRAS, 289, 471
- Pozzetti et al. (2003) Pozzetti, L., Cimatti, A., Zamorani, G., et al. 2003, A&A, 402, 837
- Sato et al. (2003) Sato, Y., Kawara, K., Cowie, L. L., Taniguchi, Y., Sanders, D. B., et al. 2003, A&A, 405, 833
- Scott et al. (2001) Scott, S. E., Fox, M. J., Dunlop, J. S., et al. 2002, MNRAS, 331, 817S
- Sawicki (2002) Sawicki, M 2002, AJ, 124, 3050
- Simpson & Eisenhardt (1999) Simpson, C, Eisenhardt, P 1999 PASP, 111, 691
- Smail et al. (2002) Smail, Ian, Ivison, R. J., Blain, A. W., & Kneib, J.-P. 2002, MNRAS, 331, 495
- Steidel et al. (2003) Steidel, C C., Adelberger, K L., Shapley, A E., Pettini, M, Dickinson, M, & Giavalisco, M 2003, ApJ, 2003, 592, 728
- Sturm et al. (2000) Sturm, E., Lutz, D., Tran, D., Feuchtgruber, H., Genzel, R., Kunze, D., Moorwood, A. F. M., Thornley, M. D., 2000, A&A, 358, 481
- Thompson et al. (1999) Thompson, D., Beckwith, S. V. W., Fockenbrock, R., Fried, J., Hippelein, H., Huang, J.-S., von Kuhlmann, B., Leinert, Ch., Meisenheimer, K., Phleps, S., Röser, H.-J.,Thommes, E., & Wolf, C. 1999, ApJ, 523, 100
- Wilson et al. (2001) Wilson, G, Kaiser, N, Luppino, G. A., Cowie, L. L. 2001, ApJ, 555, 572
- Wilson et al. (2004) Wilson, G, Huang, J.-S., et al. 2004, ApJ, submitted
- Wright et al. (1994) Wright, E. L., Eisenhardt, P., & Fazio, G. 1994, AAS, 184, 2503
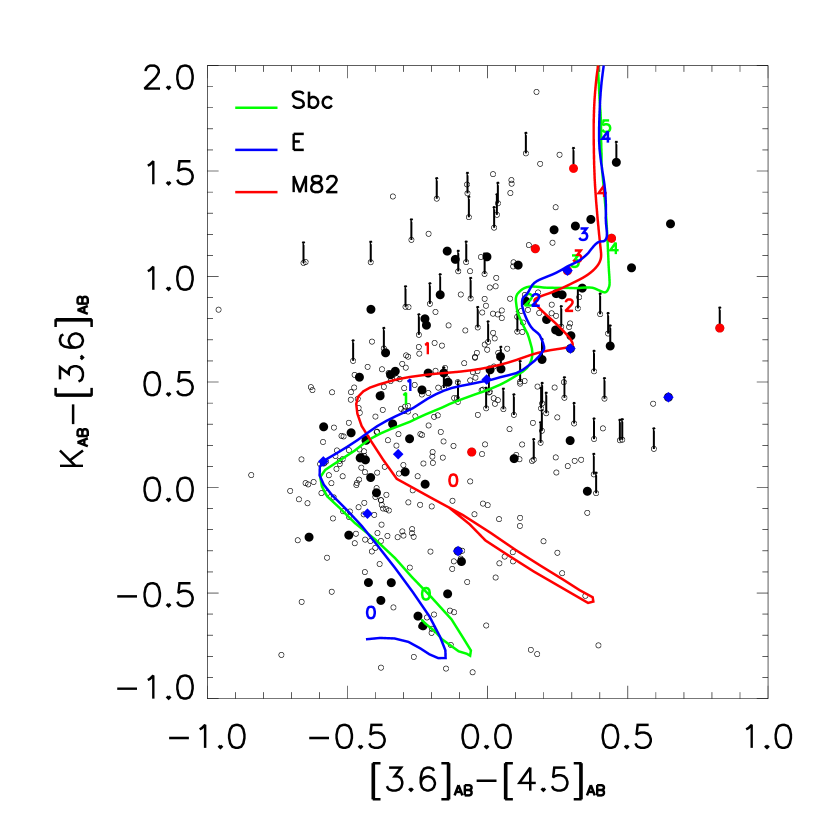
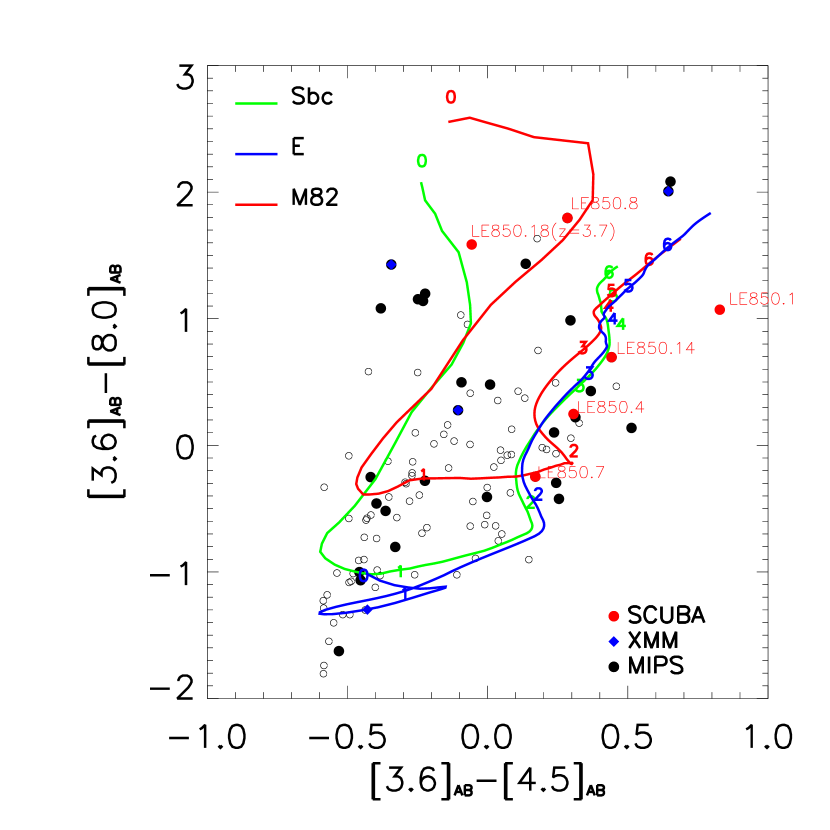
Table 1
Number of Objects detected in the IRAC bands
| Band | Galaxies | Stars | Total | Mag Limit(5,AB) |
|---|---|---|---|---|
| 3.6m | 419 | 13 | 432 | 23.73 |
| 4.5m | 403 | 13 | 413 | 23.77 |
| 5.8m | 120 | 5 | 125 | 21.90 |
| 8.0m | 80 | 5 | 85 | 21.68 |
| 24.0m | 32 | 0 | 32 | 18.15 |
Table 2
Galaxies in each IRAC Color Bin
| Estimated Redshift | 3.6m | 4.5m | 5.8m | 8.0m | 24m | ||
|---|---|---|---|---|---|---|---|
| 113 | 122 | 35 | 24 | 16 | |||
| 191 | 176 | 57 | 34 | 8 | |||
| 101 | 81 | 27 | 22 | 8 | |||
| 14 | 24 | 1 | 0 | 0 |
Table 3
Integrated Galaxy Light Iν (nW m-2 sr-1) in the IRAC Bands
| 3.6m | 4.5m | 5.8m | 8.0m | |
|---|---|---|---|---|
| All galaxies detected | 3.47 | 2.43 | 1.31 | 1.03 |
| SCUBA counterparts | 0.05 | 0.05 | 0.05 | 0.04 |
| XMM counterparts | 0.13 | 0.12 | 0.13 | 0.14 |
| MIPS counterparts | 0.68 | 0.52 | 0.43 | 0.62 |