Characterization of Extragalactic 24micron Sources in the Spitzer First Look Survey
Abstract
In this Letter, we present the initial characterization of extragalactic 24 sources in the Spitzer First Look Survey (FLS) by examining their counterparts at 8 and -band. The color-color diagram of 24-to-8 vs. 24-to-0.7 is populated with sources brighter than the 3 flux limit of 110Jy. The data covers a total area of 3.7 sq.degrees. The 24-to-0.7 colors of these sources span almost 4 orders of magnitudes, while the 24-to-8 colors distribute at least over 2 orders of magnitudes. In addition to identifying 30% of the total sample with infrared quiescent, mostly low redshift galaxies, we also found that: (1) 23% of the 24 sources (1200 per sq.degrees) with and are probably infrared luminous starburst galaxies with at . In particular, 13% of the sample (660 per sq.degrees) are 24 detected only, with no detectable emission in either 8 or -band. With such extremely red IR/visible and mid-IR colors, these sources are the candidates for being ULIGs at . (2) 2% of the sample (85 per sq.degrees) have extremely red mid-infrared to optical color () and fairly moderate 24-to-8 color (), and they are likely candidates for being dust reddened AGNs, like Mrk231 at . (3) We anticipate that some of these sources with extremely red colors may be new types of sources, since they can not be modelled with any familiar type of spectral energy distribution. We find that close to 38% of the 24 sources have optical fainter than 23.0 vega magnitude, and 17% of these have no detectable optical counterparts brighter than limit of 25.5mag. Optical spectroscopy of these optical extremely faint 24 sources would be very difficult, and mid-infrared spectroscopy from the Spitzer would be critical for understanding their physical nature.
1 Introduction
The far-IR background detected by COBE (Puget et al. 1996; Fixsen et al. 1998) peaks around m with energy comparable to the optical/UV background. This implies that 50% of the integrated rest-frame optical/UV emission is thermally reprocessed by dust and radiated at mid to far-infrared. Thus, dust enshrouded galaxies with high IR/visible ratios, particularly Ultraluminous Infrared Galaxies (ULIRGs, L⊙, a few), make a significant contribution to the total energy budget and star formation over the history of the Universe. Deep surveys based on the rest-frame UV/optical do not provide a complete census of galaxy populations, and their measurements of luminosity and SFR are only lower limits (Meurer, Heckman & Calzetti 1999; Yan et al. 1999). Deep ISO and sub-mm SCUBA observations have shown that the integrated luminosity density from dusty sources peak around , roughly a factor of 4 - 5 higher than those measured from the rest-frame optical surveys (Serjeant et al. 2000; Elbaz et al. 1999; Gruppioni et al. 2003; Blain et al. 1999). This peak in the SFR appears to be relatively flat out to (Franceschini et al. 2001; Franceschini et al. 2002; Elbaz et al. 2002; Lagache et al. 2003).
While ISO deep surveys probe primarily galaxies at (Genzel & Cesarsky 2000), and sub-mm SCUBA observations are limited to a small number of high luminosity dusty sources at (Chapman et al. 2003), the dusty universe at is largely unexplored by systematic surveys in the mid-to-far infrared wavelength. The 24 imaging camera on the Spitzer Space Telescope (Werner et al. 2004) provides us the first opportunity to do this. IRAS and ISO studies have shown that mid-infrared emission is a good indicator of the bolometric IR luminosity (Soifer et al. 1987; Surace et al. 1998; Elbaz et al. 2002; Chary & Elbaz 2001). At , the 24 band samples redshifted, rest-frame 6–12m emission from polycyclic aromatic hydrocarbons (PAH) and very small dust grains in dusty galaxies, making it the most sensitive window to probe the high-redshift infrared bright galaxies.
In this Letter, we make the first attempt to characterize the properties of 24 selected galaxies within the Spitzer First Look Survey (FLS)111see http:// ssc.spitzer.caltech.edu/fls for details. This paper studies the distribution in the 24-to-8 and 24-to-0.7micron (R(24,8) and R(24,0.7)222here we define R(24,8) , and R(24,0.7) ) color-color diagram of 18,734 24 selected sources over an area of 3.7 square degree. The R(24,8) and R(24,0.7) colors are indicative of the intrinsic slopes of the spectral energy distribution (SED) as well as dust extinction and K corrections. This Letter pays special attention to the populations with extremely red 24-to-8 and 24-to-0.7 colors, and estimate their surface densities. Throughout this paper, we adopt km/s/Mpc, and . The magnitude system is in vega.
2 Observations and Data Reduction
2.1 Image Reduction and Source Extraction
Table 1 summarizes all of the data went into the analyses in this Letter. Specifically, the 24 flux cutoff of 110Jy is for SNR of 3, which is computed at the peak pixel. This is a conservative measurement in comparison with the SNR calculated through a large aperture. After the reliable sources were selected with this conservative flux limit, we can use lower SNR (2) to estimate the flux limits for sources not detected in the 8 and band. The Spitzer data were taken with the IRAC and MIPS cameras (Fazio et al. 2004; Rieke et al. 2004). The 8 and 24 data cover an area of 3.7 square degrees, where these two datasets overlap. Both IRAC and MIPS raw data were processed and mosaiced together by the pipeline provided by the Spitzer Science Center (SSC). Additional corrections to the Basic Calibrated Data (BCD) images were included, see Lacy et al. (2004) and Fadda et al. (2004) for details. The 8 source catalog is generated using SExtractor (Bertin & Arnout 1996). We used the photometry within a diameter aperture. The total fluxes are obtained by applying the appropriate aperture corrections, which are scaled to the diameter aperture. This is at most around 30% (Lacy et al. 2004). The 24 source catalog was generated using StarFinder (Diolaiti et al. 2000). The aperture correction for obtaining the total 24 flux is 10% (Fadda et al. 2004a). The R-band images were taken with the MOSAIC-1 camera on the 4 m telescope at the Kitt Peak National Observatory. The reduced and stacked images as well as source catalogs have been publicly released, and the detailed description of the observations, data reduction and catalogs can be found in Fadda et al. (2004b).
2.2 Bandmerged Catalog
We cross-identified the 24 sources in the 8 and -band by simple positional matching. The IRAC astrometry was fine-tuned using the reference positions from the 2MASS point sources. The MIPS 24 images were aligned with the VLA 20cm radio positions. The mean positional differences between and 24 for bright and unsaturated sources are 0.1 with a rms of 0.4 in both right ascension and declination. Similarly, we found the and between the IRAC 8 and -band images. We use matching radii, generously chosen to allow somewhat larger astrometric uncertainties for fainter sources. Multiple matches between the 24 and 8 catalogs are neglible, less than 0.05%. The fraction of multiple matches between the 24 micron and R-band catalogs is higher, about 7%. In these cases, we choose the closest matches in the positional centroids between the two bands. Stellar contamination for a 24 selected sample is expected to be low since we are sampling the tail of the Rayleigh-Jeans energy distribution and the FLS galactic latitute is 37∘. Stars brighter than of 20 mag can be easily identified on the -band images. For sources with , we used the stellarity index ( sources are stars) measured with SExtractor. The total stellar contamination is estimated to be only 7.5%. We have visually spot-checked the final catalog on the image display.
3 Results
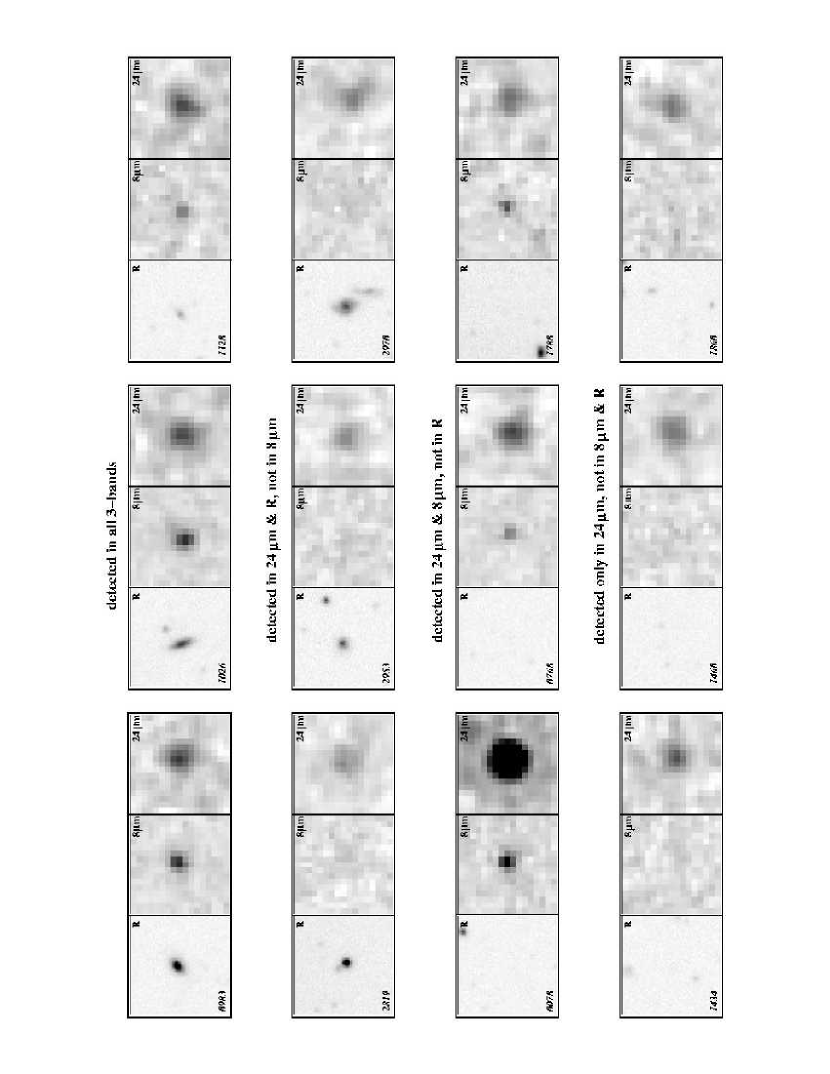
We have a total of 18,734 sources, which are detected at 24 with fluxes brighter than 110Jy. Of these, close to half of them have good detections in all three bands. The remaining half of the 24 sources have no detections in one or both of the 8 and bands. Plate 1 gives the 2-dimensional stamp images of a set of representative examples. As shown, some bright 24 sources have no counterparts at either 8 or band. These cases will be discussed in detail below.
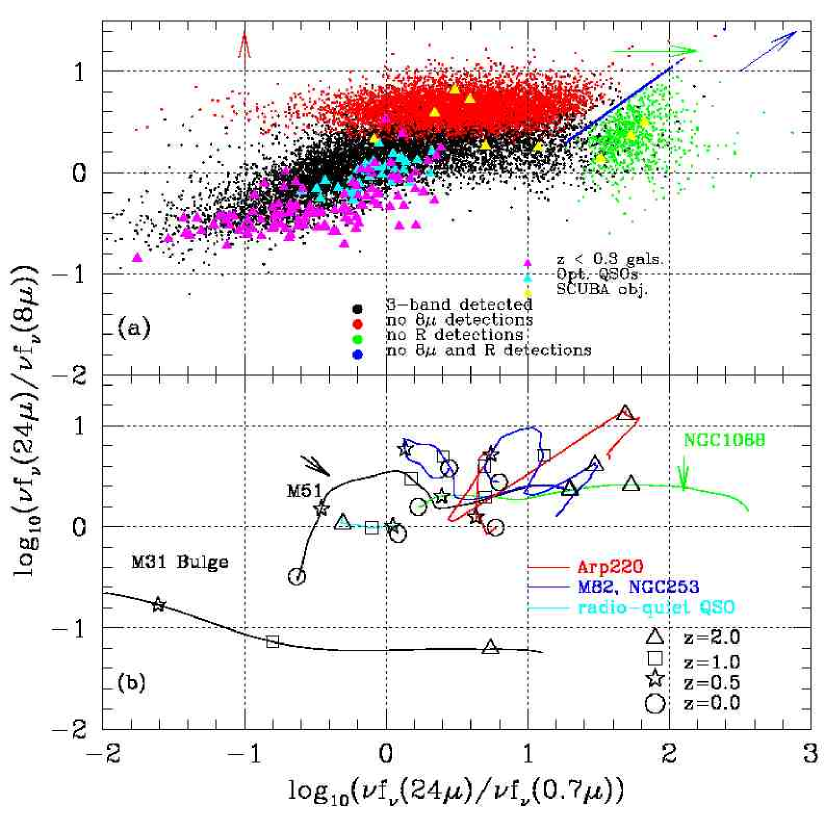
The main result of this Letter is presented in Figure 2a, showing the 24-to-8 and 24-to-0.7 color-color distribution of our sources. Figure 2b presents the expected color-color tracks as a function of redshifts computed from known types of SED templates. Figure 2a shows a broad correlation between higher IR/visible ratios and IR colors, indicative of more intensely heated dust, similar to the trends seen in the IRAS data (Soifer & Neugebauer 1991). Using this figure, we can crudely classify various types of 24 selected sources by comparison with the expected colors of known SED templates as well as with known objects in the FLS region. The SED templates include Arp220 and M82 (Silva et al. 1989; Chary & Elbaz 2001), NGC253 (Fadda et al. 2002), radio-quiet QSO, M51 & NGC1068 (Dale et al. 2001; Dale & Helou 2002). To show the colors of an early type galaxy, we construct the SED for the bulge of M31 within an aperture of diameter using the near-IR and IRAS data published in Soifer et al. (1986). The optical part of the SED for M31 bulge was taken as a 10 Gyr old elliptical SED from Bruzual & Charlot333ftp://gemini.tuc.noao.edu/pub/charlot/bca5, then scaled and matched with the infrared part to produce a full SED covering from 0.1 — 100 m.
3.1 Infrared Quiescent Sources
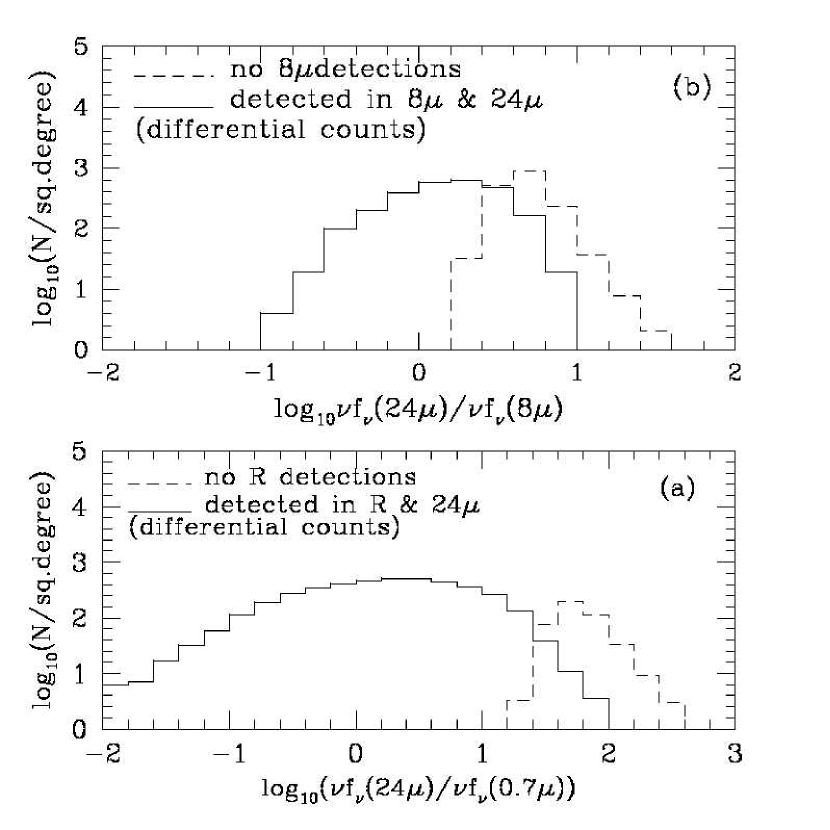
Comparing Figure 2a and 2b, the color-color distribution can be crudely classified into two extreme regions — the infrared quiescent region where and , the infrared luminous region with and . The region between these two probably contains a mixture of starbursts and normal galaxies at various redshifts. In Figure 2a, the black points occupy the most of the first region. These are 24 sources which have significant detections at 8 as well as -band. Comparing with the model color-color tracks, we infer that the sources with and are primarily normal, infrared faint galaxies at low redshift () and optically selected QSOs with a wider redshift distribution. Figure 3a,b show the differential number counts as functions of colors, and . A little less than 30% of the total population are infrared quiescent spirals and early type galaxies at low redshifts as well as optically selected QSOs. The galaxies with extremely low 24-to-8micron flux ratio are old bulges, such as M31. Their colors can not be explained by pure interstellar dust emission, and they must have substantial stellar photospheric and dust envelope contributions coming into the 8 band.
To test further this interpretation of Figure 2a, we have used the NED extragalactic database and identified the sources in our catalog with the low redshift galaxies (magenta triangles) and optically selected QSOs (cyan triangles) from the Sloan Digital Sky Survey444http://www.sdss.org. The locations of these sources with known types and redshifts in Figure 2a generally confirm our interpretation. The cyan points in Figure 2a can be well explained by the computed colors of a radio-quiet QSO SED template in Figure 2b. These optically selected QSOs have fairly flat SEDs (Neugebauer et al. 1987; Sanders et al. 1989), therefore, their colors are around and with very little change with redshifts. One specific example is a sloan QSO at , with the fluxes of 744Jy, 98 Jy and 27 Jy at the 24, 8 and 0.7m respectively, thus and .
3.2 The Nature of the Extreme 24 Populations
Figure 2a illustrates the colors of four types of sources marked with small black, red, green and blue points. The objects indicated with black points have been discussed before. The red points consist 31% of the 24 sources, which are detected only in -band, but not at the 8-band. The green points represent 4%, with detections only in 8, but no counterparts in brighter than 2 limit of 25.5mag. Finally, 13% of the sample (660 objects per sq.degree) are not detected in either 8 or , shown as small blue points in Figure 2a. The mean fluxes of the objects marked as red, green and blue points are roughly between 230-360Jy. One of the most interesting sources revealed by the 24 images are ones which have and in Figure 2a. These sources are candidates for being luminous starburst galaxies at . Using this color-color cut, we estimate that 23% (1200 per sq.degree) of our 24 sample are such objects. In particular, those sources detected only at 24 (blue points) are likely to be ULIGs at (660 per sq.degrees). At , our 3 24 flux limit of 110Jy corresponds to the observed luminosity of . If we ignore the filter difference between the Spitzer 24 and the IRAS 12 (the 24 bandwidth is about half of the 12 filter), the observed 24 luminosity is roughly the rest-frame IRAS 12 luminosity. The total infrared luminosity is correlated with IRAS 12m luminosity , in the form of , as derived from the IRAS Revised Bright Galaxy Sample (Soifer et al. 1987; Chary & Elbaz 2001). This implies that the starbursts should have . As suggested by the 24 source counts (Marleau et al. 2004), the FLS data may reach starburst population. Our flux limit implies that at , the infrared luminosity should be brighter than .
Another interesting population are sources with but with a fairly constant . Figure 2b suggests that these sources are likely to be dust heavily reddened AGNs like NGC 1068, or Mrk231 at . These sources could be separated from the general population using the IRAC 8-to-4.5 and 5.8-to-3.5micron color-color selection (Lacy et al. 2004). The surface density of these dusty AGNs are on the order of 85 per sq.degree, and they constitute 2% of the total 24 population. To confirm our prediction that we can use vs. to select high redshift, infrared luminous galaxies, we mark on Figure 2a the several 24 sources detected with the SCUBA at 850 (see Frayer et al. 2004 for detail). These SCUBA sources could be at , as shown in Chapman et al. (2003). Our computed color-color tracks in Figure 2 is to illustrate in a broad sense what range of colors each type of sources should have. A small number of sources with extremely red 24-to-8 and 24-to-R colors can not be all explained by models with known type of SEDs. This could be suggestive of potentially new classes of objects.
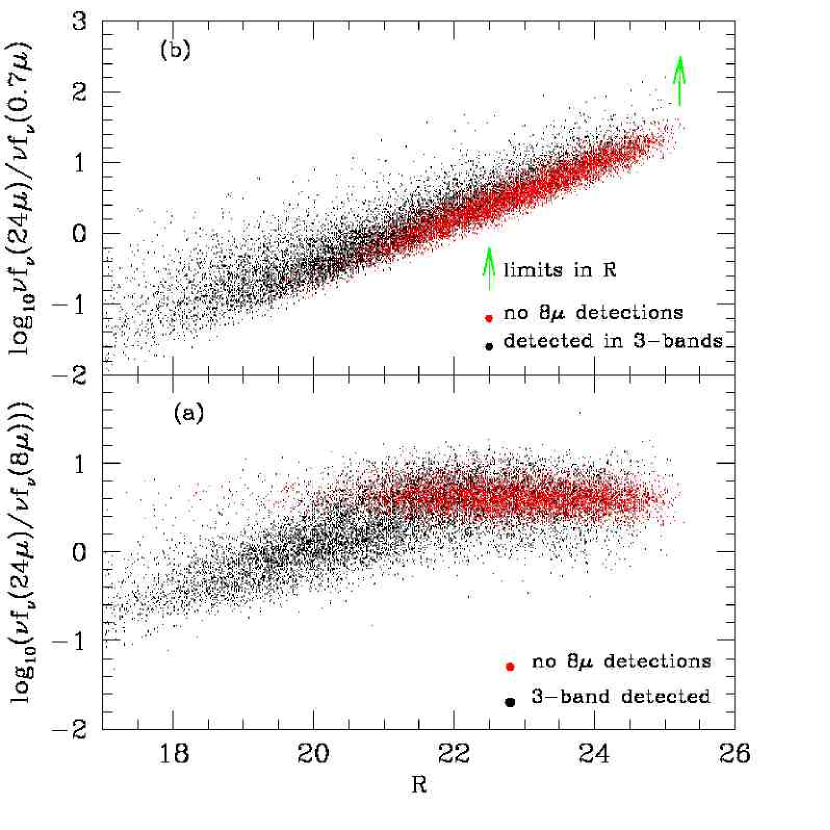
We examine the optical brightness of 24 selected sources in Figure 4, showing the and as a function of magnitude for the 24 sources. Close to 36% of the 24 sources have magnitudes fainter than 23.0mag. Such a faint optical magnitude might suggest that they are at , supported by the measurements from optical band selected redshift surveys (Lilly et al. 1996; Cohen et al. 2001). Many of these sources are well within the brightness regime of the 10 meter classes telescopes for obtaing the optical spectroscopic redshifts. However, the 24 sources without counterparts fainter than 2 of 25.5mag will be difficult to follow-up with the optical spectroscopy. The redshifts and physical natures of these sources could be measured using the mid-infrared spectrograph (IRS) from the Spitzer InfraRed Spectrometer. Particularly, for sources with 24 fluxes brighter than 750Jy, the IRS would be sensitive enough to obtain good SNR low resolution spectra covering 5 to 38 with a total of (1-2) hours of integration. We have a total of 46 sources which have 24 fluxes brighter than 750Jy and -band magnitude fainter than 25.0mag.
This work is based in part on observations made with the Spitzer Space Telescope, which is operated by the Jet Propulsion Laboratory, California Institute of Technology under NASA contract 1407. Support for this work was provided by NASA.” We also made use of the NASA/IPAC Extragalactic Database (NED) which is operated by the Jet Propulsion Laboratory, California Institute of Technology, under contract with the National Aeronautics and Space Administration.
| (m) | 0.7 | 8.0 | 24.0 |
|---|---|---|---|
| FWHM () | 1.0 | 2.2 | 5.5 |
| Flux Limits | 25.5magaaHere of 25.5mag is a 2 limit within a diameter aperture. The 8 flux 20Jy is a 2 limit, included aperture correction. The 24 flux 110Jy is a flux cutoff where the SNR at the peak pixel is greater than or equal to 3. See the text for details. | 20JyaaHere of 25.5mag is a 2 limit within a diameter aperture. The 8 flux 20Jy is a 2 limit, included aperture correction. The 24 flux 110Jy is a flux cutoff where the SNR at the peak pixel is greater than or equal to 3. See the text for details. | 110JyaaHere of 25.5mag is a 2 limit within a diameter aperture. The 8 flux 20Jy is a 2 limit, included aperture correction. The 24 flux 110Jy is a flux cutoff where the SNR at the peak pixel is greater than or equal to 3. See the text for details. |
| (ergs/s/cm2) | 1.3e-15bbJy (Neugebauer 1997, private communication) | 3.75e-15 | 24e-15 |
| Exp. Time (sec) | 1800 | 60 | 80 |
References
- blain (1999) Blain et al. 1999, MNRAS, 302, 632.
- Chapman (2003) Chapman, S. et al. 2003, Nature, 422, 695
- chary (2001) Chary & Elbaz 2001, ApJ, 556, 562
- cohen (2001) Cohen, J. et al. 2001, AJ, 121, 2895
- dale (2002) Dale, D. & Helou, G. 2002, ApJ, 576, 159
- dale (2001) Dale, D. et al. 2001, ApJ, 549, 215
- Diolaiti (2000) Diolaiti, E. et al. 2000, SPIE, 4007, 879
- elbaz (1999) Elbaz, D. et al. 1999, A&A, 351, 37
- elbaz (2002) Elbaz et al. 2002, A&A, 384, 848.
- fadda (2002) Fadda et al. 2002, A&A, 383, 838
- Fadda (2004a) Fadda, D., et al. 2004a, in this volume
- Fadda (2004b) Fadda, D., Jannuzi, B., Ford, A., & Storrie-Lombardi, L.J., 2004b, AJ, in press [astro-ph/0403490]
- fazio (2004) Fazio, G. et al. 2004, in this volume
- fixsen (1998) Fixsen, D.J., et al. 1998, ApJ, 508, 123
- Franceschini (2001) Franceschini et al. 2001, A&A, 378, 1
- Franceschini (2002) Franceschini et al. 2002, ApJ, 568, 470.
- genzel (2000) Genzel & Cesarsky 2000, ARA&A, 38, 761.
- gruppio (2000) Gruppioni, C. et al. 2003, MNRAS, 341, 1
- lacy (2004) Lacy, M. et al. 2004, ApJ, in this volume
- lagache (2003) Lagache et al. 2003, MNRAS, 338, 555.
- lilly (1998) Lilly, S. et al. 1996, ApJL, 460, 1
- Meuer (1999) Meuer, Heckman & Calzetti 1999, ApJ, 521, 64.
- marleau (2004) Marleau, F. et al. 2004, in this volume
- gxn (1987) Neugebauer, G., Green, R.F. et al. 1987, ApJS, 63, 615
- Puget (1996) Puget et al. 1996, A&A, 308, L5.
- Rieke (2004) Rieke, G., et al. 2004, in this volume
- serjeant (2000) Serjeant et al. 2000, MNRAS, 317, 29.
- silva (1998) Silva et al. 1998, ApJ, 509, 103.
- sander (1989) Sanders, D.B., Phinney, E.S., Neugebauer, G., Soifer, B.T., Matthews, K., 1989, 347, 29
- soifer (1987) Soifer, B.T., Sanders, D.B., Madore, B.F. et al. 1987, ApJ, 320, 238.
- soifer (1986) Soifer, B.T., Rice, W.L., Mould, J.R., Gillett, F.C., Rowan-Robinson, M., habing, H.J, 1986, ApJ, 304, 651
- soifer (1991) Soifer, B.T., Neugebauer, G., 1991, AJ, 101, 354.
- surace (1998) Surace, J., 1998, Ph.D thesis, University of Hawaii.
- werner (2004) Werner, M. et al. 2004, in this volume
- yan (1999) Yan et al. 1999, ApJ, 519, L47.