ESO 3060170 — a massive fossil galaxy group with a heated gas core?
Abstract
We present a detailed study of the ESO 3060170 galaxy group combining Chandra, XMM-Newton and optical observations. The system is found to be a fossil galaxy group. The group X-ray emission is composed of a central dense cool core (10 kpc in radius) and an isothermal medium beyond the central 10 kpc. The region between 10 and 50 kpc (the cooling radius) has the same temperature as the gas from 50 kpc to 400 kpc although the gas cooling time between 10 and 50 kpc (2 - 6 Gyr) is shorter than the Hubble time. Thus, the ESO 3060170 group does not have a group-sized cooling core. We suggest that the group cooling core may have been heated by a central AGN outburst in the past and the small dense cool core is the truncated relic of a previous cooling core. The Chandra observations also reveal a variety of X-ray features in the central region, including a “finger”, an edge-like feature and a small “tail”, all aligned along a north-south axis, as are the galaxy light and group galaxy distribution. The proposed AGN outburst may cause gas “sloshing” around the center and produce these asymmetric features. The observed flat temperature profile to 1/3 rvir is not consistent with the predicted temperature profile in recent numerical simulations. We compare the entropy profile of the ESO 3060170 group with those of three other groups and find a flatter relation than that predicted by simulations involving only shock heating, S r∼0.85. This is direct evidence for the importance of non-gravitational processes in group centers. We derive the mass profiles within 1/3 rvir and find the ESO 3060170 group is the most massive fossil group known (1 - 2 1014 M⊙). The M/L ratio of the system, 150 at 0.3 rvir, is normal.
1 Introduction
Historically, optical galaxies have been used to identify and study a broad range of mass and size scales ranging from galaxy pairs to superclusters and filaments. Recent X-ray surveys have complemented these studies and identified a new class of collapsed system, Fossil Groups or Over-Luminous Elliptical Galaxies (OLEGs; see Ponman et al. 1994; Jones, Ponman & Forbes 2000; Mulchaey & Zabludoff 1999; Vikhlinin et al. 1999 for discussions of this unique class) which may represent the extreme end point of the group merging process and in which the optical light is dominated by the central galaxy. X-ray studies show that these optically unremarkable systems are surrounded by extended dark matter and hot gas halos typical of groups or poor clusters with spatial extents of up to 1 Mpc (e.g., Vikhlinin et al. 1999). Fossil groups contribute significantly to the total mass density of the Universe and are at least as numerous as all poor and rich clusters combined (of L 1043 ergs s-1) (Vikhlinin et al. 1999; Jones et al. 2003, hereafter J03). Fossil groups provide ideal sites to study “cooling flows” since they are generally old and relaxed. Their dark matter structure can be compared with simulations to test our current understanding of group evolution. The large M/L ratio of several OLEGS (350 - 600 for h=0.7) derived by Vikhlinin et al. (1999) is intriguing since mergers should not alter a group’s mass-to-light ratio. Although there are more than 10 fossil groups known, few have been studied in detail in X-rays. Recently, Khosroshahi, Jones & Ponman (2004) reported the Chandra analysis of a cool fossil group NGC 6482 with a mass at the lower end of the group scale.
We present in this paper a detailed analysis of a new massive fossil group ESO 3060170 using Chandra and XMM-Newton data. ESO 3060170 was selected as a candidate fossil group from a sample of early-type galaxies based on the ROSAT All-Sky Survey (RASS; Beuing et al. 1999). The system was classified as a poor Abell cluster S540 (Abell, Corwin & Olowin 1989).
Throughout this paper we assume H0 = 70 km s-1 Mpc-1, M=0.3, and =0.7. At a redshift z=0.0358, the luminosity distance to ESO 3060170 is dL = 158 Mpc, and 1′′=0.714 kpc. Linear scales, luminosities, densities, entropies, gas masses, stellar masses, and total masses scale as d, d2, d-1/2, d1/3, d5/2, d2, and d, respectively, where d=dL/158 Mpc.
2 Chandra and XMM-Newton data analysis
Throughout the paper, we use the Galactic absorption of 31020 cm-2 for ESO 3060170. The 0.4 - 1.0 keV XMM-Newton spectra and 0.6 - 1.0 keV Chandra spectra of ESO 3060170 can be fitted well by this absorption. The uncertainties quoted in this paper are 90% confidence intervals unless specified otherwise. The solar photospheric abundance table by Anders & Grevesse (1989) is used in the spectral fits.
2.1 Chandra observation & data reduction
The Chandra observations (Table 1) were performed with the Advanced CCD Imaging Spectrometer (ACIS). The observations were divided into two ACIS-I pointings (Obs 3188 and 3189), putting ESO 3060170 near the center of the I3 and I0 chips respectively. In each pointing, the optical axis was moved closer to the target along the detector y-axis. This allows 1′′ resolution at the center of ESO 3060170 and good coverage of the group emission out to 450 kpc. The data were telemetered in Very Faint mode, which allows subsequent analysis to reduce soft particle background significantly. ASCA grades 1, 5 and 7 were excluded, along with the known bad columns, hot pixels, and CCD node boundaries. We applied the CXC correction on charge transfer inefficiency (CTI). The slow gain changes in ACIS CCDs I0-I3 and S2 were also corrected using the program ‘corr_tgain’ by A. Vikhlinin 111http://cxc.harvard.edu/contrib/alexey/tgain/tgain.html. We investigated the light curves from chip S2 where background is dominant. A small background flare was found in each pointing and that period of time was excluded. There is a position offset of 2′′ between the two pointings which we corrected using optical identifications of detected X-ray sources.
The CTI-corrected period D blank field background data, “acisi_D_01236_bg_evt_271103.fits” 222http://cxc.harvard.edu/contrib/maxim/bg/index.html, were used. We verified that the ROSAT soft sky background flux at the position of ESO 3060170 matched the average of the period D blank field background (within 1%). The correction for slow gain changes in ACIS CCDs I0-I3 and S2 is also applied to the background data. The particle background levels (measured in PHA channels 2500-3000 ADU for all CCDs) were 5% - 6.6% higher than that of the period D background data. This is within the range of background variations. The measured 6 - 10 keV fluxes in regions 10′ from the group center also show similar excesses above the level of the period D background. Thus, we increased the background normalization by 5% and 6.6% for Obs 3188 and 3189 respectively to fit the particle background level at the time of the observations.
Two corrections were made to the ACIS low energy quantum efficiency (QE). The first corrects for the QE degradation, which increases with time. The second corrects the QE by an empirical factor of 0.93 below 1.8 keV in the FI CCDs to improve the cross-calibration with the BI CCDs333http://asc.harvard.edu/cal/Links/Acis/acis/Cal_prods/qe/12_01_00/. The calibration files used correspond to CALDB 2.26 from the CXC.
2.2 XMM-Newton observation and data analysis
In the XMM-Newton observation (Table 1), the source was put at an offset position (4.5′ north of the field center). The medium optical filter was used. Pipeline products provided by the XMM-Newton Science Operations Center (SOC), consisting of calibrated event files pre-processed with the SAS, were used in this analysis. We present here the results from the EPIC instruments. The PN data are largely contaminated by a high background flare so that 2/3 of the exposure is lost. The higher than anticipated EPIC background has limited our analysis to 0.3 rvir. We used photon events with patterns 0 to 12 for the MOS data, and 0 to 4 for the PN data. Since the background data by Lumb et al. (2002) were used, the same flare rejection criteria as theirs was generally applied. Histograms of high energy single pixel events ( 10 keV) in time bins of 100 s were made and time intervals with count rates 55 (20) events/bin in PN (MOS) are rejected. We used a higher cut of 55, rather than 45 used in Lumb et al. (2002) for PN data, to double the useful exposure.
We used EPIC response files: m11_r7_im_all_2001-11-25.rmf for MOS1, m21_r7_im_all_2001-11-25.rmf for MOS2 and epn_ff20_sdY0-9.rmf for PN. ARF files were generated using SAS ARFGEN.
A double-subtraction method based on the background data produced by Lumb et al. (2002) is now widely used (e.g., Majerowicz, Neumann & Reiprich 2002). This method generally involves a 10% rescaling of particle background. However, the quiescent background measured in this observation is significantly higher than those measured by Lumb et al. (2002): 55% higher for MOS1 (10 - 12 keV), 36% higher for MOS2 (10 - 12 keV) and 88% higher for PN (12 - 14 keV). We also compared the 10 - 14 keV flux with the CLOSED data by Marty et al. (2002). The out-of-field count rates agree well with the CLOSED data (within 2%) but in-field count rates are much higher (30% - 40% for MOS data). All these show that the quiescent background in this observation is much higher than expected. Thus, a somewhat different method was used to subtract background.
Since ESO 3060170 is not a very luminous source, there are source-free regions in the field that we can use to model the local background. The surface brightness profile centered on ESO 3060170 was first plotted and background regions were identified by the flattening of the profile at large radii (11.5′ - 15.5′). In this (11.5′ - 15.5′) region, we first subtract Lumb’s background. The residual spectrum is very flat, similar to that of the particle background. Since this excess particle background is not vignetted, in the spectral analysis we subtract it in counts/channel space. For each region, we first subtract Lumb’s background. Then, the excess particle background was subtracted based on the solid angle of each spectral region. A similar method was used by Churazov et al. (2003) for the XMM-Newton observations of the Perseus Cluster. The background subtraction for spatial analysis was done in a similar manner. This method yields results consistent with those derived from the Chandra data.
2.3 X-ray morphology and surface brightness
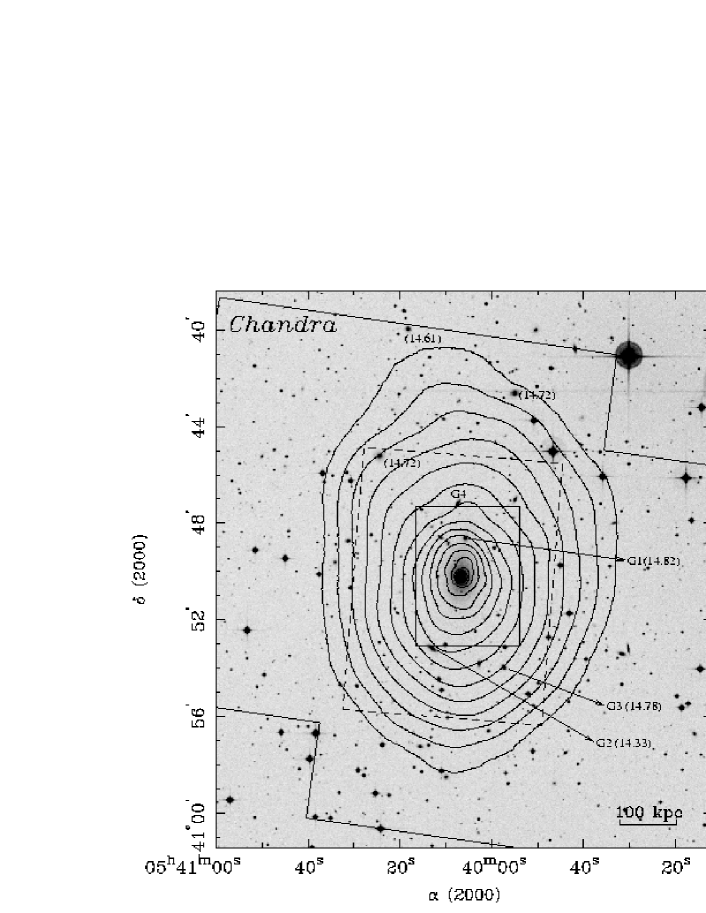
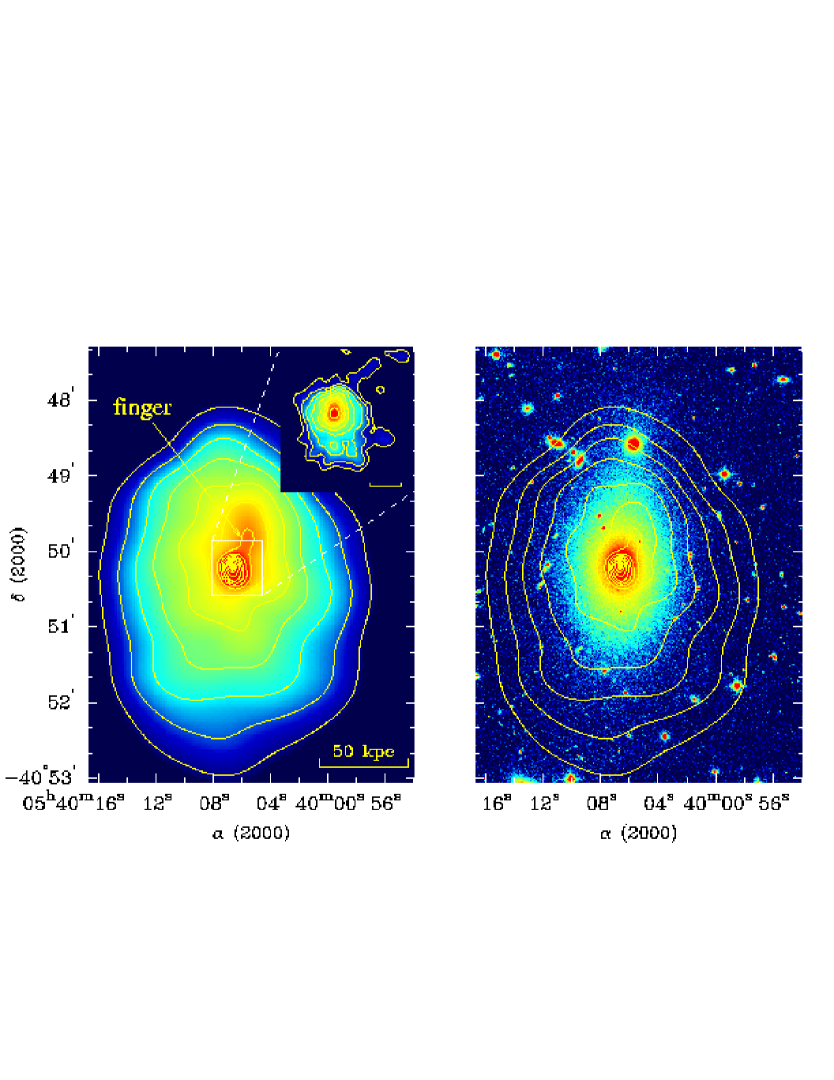
The two Chandra pointings of ESO 3060170 were combined and the 0.5 - 4 keV image (background-subtracted and exposure-corrected) is shown in Fig. 1 as contours superposed on the Digitized Sky Survey (DSS) image. All point sources are replaced by surrounding averages. The group emission is centered on ESO 3060170 and elongated in the north-south direction with an ellipticity of 0.3.
The Chandra X-ray surface brightness profile of the ESO 3060170 group (Fig. 2) shows at least two components separated at 10 kpc. The profile is fitted by a double- model (Fig. 2): core radius rc = 7.7 kpc and = 1.22 for the inner component; rc = 44.3 kpc and = 0.5140.004 for the outer component (/dof=150.7/23). If the surface brightness profiles of Chandra and XMM-Newton beyond 10 kpc are jointly fitted by a single -model, the best-fit values are: rc = 47.90.9 kpc and = 0.5260.003. The surface brightness profiles steepen at large radii. Beyond 130 kpc, the surface brightness profiles can be fitted by a power law with an index corresponding to = 0.5580.004. Based on an offset PSPC pointing of ESO 3060170, we find the surface brightness may steepen beyond 450 kpc. The surface brightness can be characterized by a power-law with a slope corresponding to =0.58 between 450 kpc and 800 kpc.
In view of the obvious ellipticity of the X-ray emission, we also performed two-dimensional fits, excluding point sources, to the Chandra image of the ESO 3060170 group using SHERPA. A single elliptical -model fit yields similar results to the one-dimensional fit (rc = 31.52.0 kpc vs. 34.51.0 kpc; = 0.5100.009 vs. 0.4910.003). The best-fit ellipticity is 0.2800.017, while the position angle is 90 (measured counterclockwise from west; same hereafter).
2.4 Global X-ray properties
The spectra of two ACIS-I pointings, MOS1, MOS2 and PN extracted within 450 kpc of ESO 3060170 are shown in Fig. 3. The spectra were fitted by a MEKAL model and the best-fit values are listed in Table 2. The fits are acceptable and the results from all five different datasets are consistent with each other. Thus, they were fitted simultaneously. To determine the abundance of individual elements, we also fit the spectra with a VMEKAL model. Following Finoguenov, Arnaud & David (2001), we divide heavy elements into five groups for fitting: Ne; Mg; Si; S and Ar; Ca, Fe, and Ni. The best-fit values are: T=2.670.06 keV, Ne=0.670.19, Mg=0.270.17, Si=0.430.09, S=0.290.13, and Fe=0.480.04 (/dof=590.4/505). The derived abundances are typical for hot galaxy groups (Finoguenov, David & Ponman 2000). The best-fit VMEKAL models are also shown in Fig. 3.
We use the relation derived in Evrard, Metzler & Navarro (1996) to estimate the virial radius:
| (1) |
This scaling relation may not apply for cool groups (e.g., Sanderson et al. 2003), but may be used for comparison. For ESO 3060170, rvir= 1.35 Mpc.
We can estimate the total X-ray luminosity of the ESO 3060170 group from the global spectrum. The missing parts (chip edges, chip gaps and point sources) are accounted for based on the measured surface brightness profile (double -model fit). Chandra and XMM-Newton results (Table 2) agree within the current cross-calibration. By averaging these values, we obtain the rest-frame 0.5 - 2 keV luminosity of 2.61043 ergs s-1 and bolometric luminosity of 6.61043 ergs s-1 within 450 kpc (0.33 rvir).
2.5 Radial temperature & abundance profiles
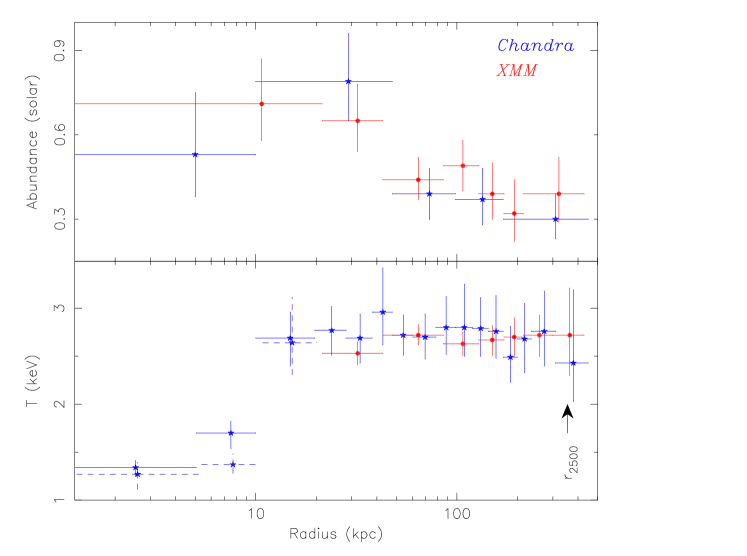
Although in X-rays, the ESO 3060170 group is elongated in the north-south direction, it is useful to derive radially averaged profiles of physical properties to compare with other groups and numerical simulations. We used a center for all annuli of 40m06s.6, = -40 50 14(J2000), which is determined from the fits to X-ray isophotes beyond the central 50 kpc. This position is 4 - 5′′ south of the peak of the X-ray distribution and the galaxy nucleus. Radial temperature and abundance profiles were derived separately for Chandra and XMM-Newton data. For ACIS-I data, we required each annulus to contain a total of 1000 - 2000 counts from the two pointings. For EPIC data, we did spectral fits in 8 broad radial bins to avoid further correction for the XMM PSF. Point sources are excluded, as well as chip gaps and boundaries. In the outermost Chandra bin (radius 7.2′ - 10.5′), the group emission still contributes 49% of flux in the 0.7 - 4 keV band. A low energy cut of 0.7 keV is used to to minimize the effects of uncertainties in the low energy calibration. Each annulus was fitted by a MEKAL model, with the temperature and abundance as free parameters. The spectral fits from the two ACIS-I pointings agree with each other, as do the results from MOS1, MOS2 and PN. Thus, we performed simultaneous fits to two ACIS-I pointings to derive Chandra profiles, and to MOS and PN data to derive XMM-Newton profiles. The ranges from 0.8 to 1.2 for Chandra spectra (for 21 — 143 degrees of freedom), and 0.9 to 1.2 for XMM-Newton spectra (for 70 — 401 degrees of freedom), which is acceptable. The derived temperature and abundance profiles are shown in Fig. 4. Chandra and XMM-Newton temperature and abundance profiles are consistent with each other. Beyond the central cool 10 kpc (the dense cool core), the temperature profile is flat at 2.7 keV to 0.33 rvir. We also extracted the spectra of regions outside 450 kpc or 10.5′ (mostly from the S2 chip) which covers only 8% of the projected area between radii of 450 - 660 kpc. With the abundance fixed at 0.3 solar (Fig. 4), the best-fit temperature is 2.5 keV, which may imply that the temperature does not significantly decrease at 0.35 - 0.45 rvir.
In view of the non-circular shape of the X-ray isophotes, we also studied the temperature profiles in four elliptical sectors (north, east, south and west) beyond the central 10 kpc. The ellipticity of each elliptical bin is fixed at 0.28 (2.3) and the position angle is fixed at 90. The azimuthal extents of the north and south sectors are 71.5, while those of the east and west sectors are 108.5. This choice ensures that each sector has the same area. In each sector, we generated spectra in five annuli. The derived temperature profiles in all four sectors are flat and agree well with each other, which again shows that any temperature variation is small beyond the dense cool core.
ESO 3060170 is not the only hot group with a flat temperature profile to 0.3 - 0.5 rvir measured by Chandra and XMM-Newton. Others include A1983 (flat to 0.35 rvir, Pratt & Arnaud 2003) and CL1159+5531 (flat to 0.5 rvir, A. Vikhlinin, private communication). This kind of flat temperature profiles does not agree with the predicted temperature profile in adiabatic simulations (Loken et al. 2003), which implies some missing physics in the simulations, e.g., thermal conduction at 10% of the Spitzer value (Narayan & Medvedev 2001; Nath 2003).
Since the temperature profile is flat beyond the central 10 kpc, we only perform the standard spectral deprojection within the central 20 kpc radius (see Fig. 4). The result shows that the temperature change across the boundary of the cool core is abrupt and the temperature gradient inside the cool core is small.
The abundance profile is rather flat beyond the central 40 kpc. At large radii (200 - 450 kpc), the abundance is 0.35 solar. The regions between 10 and 50 kpc may have the highest abundance. In view of strong lines of Si and Fe in the spectra, we also measured the radial abundance profiles of Si and Fe. Between 10 and 50 kpc, the iron abundance (0.880.14) is twice the abundance in other regions ( 10 kpc and 50 - 450 kpc). Silicon abundances are poorly constrained but also high between 10 and 50 kpc.
We also investigated the spectra of the central 10 kpc and 10 - 50 kpc regions to look for signs of multi-phase gas. Both spectra can be well fitted by one MEKAL model (/dof=70.4/72 and 269.6/251 respectively). We fit the spectrum with two MEKAL models and a MEKAL model plus a multi-phase cooling-flow (MKCFLOW) model. Both extra components do not improve the fits. The upper limits on the mass deposition rate are 2 and 1 M⊙ yr-1 for the inner 10 kpc and 10 - 50 kpc regions respectively. Thus, we find no evidence for multi-phase gas within the cooling radius ( 50 kpc) or gas cooler than the ambient medium between 10 and 50 kpc.
2.6 Electron density, cooling time and entropy profiles
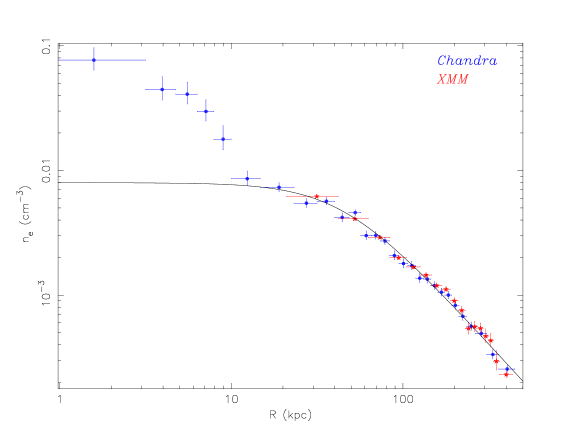
The electron density profile can be obtained by deprojecting the surface brightness profile (see Sun et al. 2003 for details, hereafter S03). The projected flux contribution from regions beyond the outermost bin is also subtracted based on an offset ROSAT pointing of ESO 3060170. From the 0.5 - 4 keV background-subtracted and exposure-corrected surface brightness profiles, we derived electron density distributions for both Chandra and XMM-Newton data as shown in Fig. 5. The density profile beyond the central 10 kpc can be fitted by a -model. Chandra and XMM-Newton profiles yield identical fits so that we fit them simultaneously. The best-fit parameters are: rc (core radius) = 44.42.6 kpc and = 0.5040.011 (/dof=88.7/37).
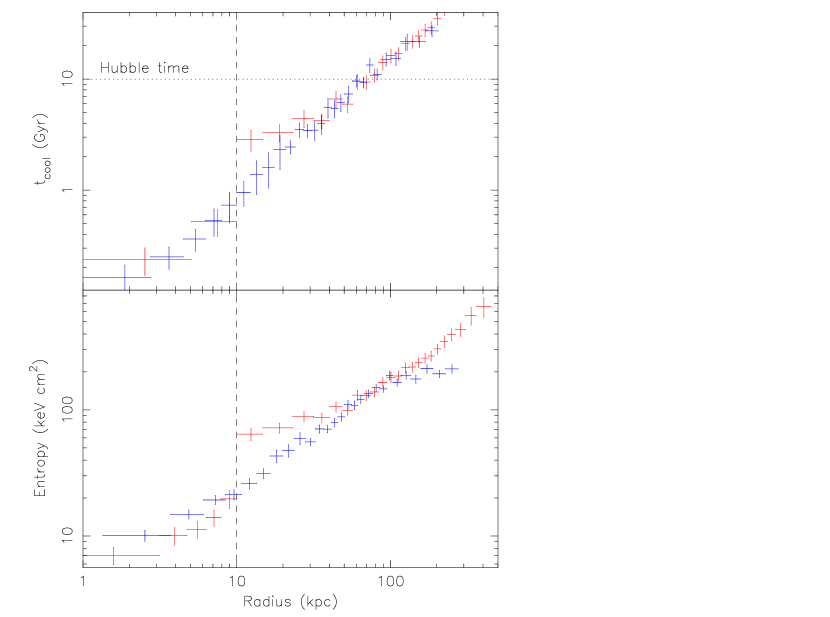
With the temperature, abundance and electron density profiles, we derived the cooling time and entropy (defined as ) profiles (Fig. 6). The cooling time is 2 - 3 108 yr in the very center and less than a Hubble time ( 1010 yr) within the central 50 kpc. The cooling time profile is almost identical to that of the NGC 1550 group (S03) except for the longer cooling time between 10 and 30 kpc for ESO 3060170 (Fig. 6). The entropy profile is also similar to the scaled one 444The scaling factor is (1+z) from Ponman et al. (2003). of the NGC 1550 group (S03) within 0.1 rvir except for the excess between 10 and 50 kpc in ESO 3060170. Since the entropy can only be changed by cooling or heating, this implies that the 10 - 50 kpc core region in ESO 3060170 must have been heated relative to the cooling core in NGC 1550. At large radii, the entropy profile rises continuously and shows no sign of flattening.
3 The structures in the central region
X-ray and optical images of the central part of the ESO 3060170 group are shown in Fig. 7 and physical properties are also shown in Fig. 2, 4, 5 and 6. No central point-like source is detected and the upper limit on the 0.5 - 10 keV luminosity is 4 1040 ergs s-1 assuming a power law with an index of 1.7. The dense cool core within the central 10 kpc is the most significant structure. One may argue that this component is the hot ISM of ESO 3060170 based on its location. However, its X-ray luminosity (7.71041 ergs s-1 in the 0.5 - 2 keV band) places it at the brightest extreme of the galaxy coronae associated with early-type galaxies and its temperature (1.32 keV) is higher than typical values of galaxy coronae (e.g., Brown & Bregman 1998). Since this cool core is at the group center and the surrounding medium has a relatively short cooling time, the properties of this cool core should be related to those of its surroundings. We discuss its origin in more detail in 6.
There are X-ray structures found within and beyond the dense cool core (Fig. 1 and 7) as follows (starting from large scales to small scales):
-
About 100 kpc from the nucleus, the X-ray emission is more elongated to the south and shows a steeper decline to the north. However, at 250 - 300 kpc from the nucleus, the X-ray isophotes are well centered on ESO 3060170 with an ellipticity of 0.3.
-
An X-ray “finger” (surface brightness extension from the central peak) extends to the north of the nucleus with a scale of 30 kpc.
-
While the central dense component shows sharp declines of surface brightness in all directions, that located 10 kpc north of the nucleus is the sharpest (edge-like) with a small “tail” extending it to the south.
The “finger” is the most pronounced X-ray feature. Compared to the X-ray emission at the same radius, the “finger” is 20% - 30% brighter (significant at 14 ) with 640 net counts (0.4 - 4 keV). The projected temperature at the position of the “finger” is 2.80 keV and the abundance is 1.03 solar. Both the gas temperature and abundance are similar to azimuthally averaged values in the radial range of the “finger” (Fig. 4). If the surroundings of the “finger” are used as background, the derived temperature of the “finger” is 2.6 keV. Thus, the “finger” is hotter than the dense cool core and cannot be a cooling wake. Assuming dimensions of 40, its gas mass is 3 M⊙, comparable to the gas mass of the dense cool core.
The gas density of the “finger” is too low and its temperature is too high to be the accretion wake of ESO 3060170 (Sakelliou 2000). It is also unlikely a tail of the stripped material since the the cool core is at the geometric center of the X-ray isophotes beyond the central 50 kpc (Fig. 7) and the peak of the cool core is coincident with the nucleus of ESO 3060170. The “finger” could arise from gas motions induced by a previous AGN outburst (6). During the outburst, parts of the surrounding gas may be compressed and displaced. With lower entropy, the displaced gas will eventually fall back. The infall time depends on the initial offset and should be longer than the free-fall time (several times 108 yr). Such a central AGN outburst can also explain other central X-ray structures, the gas motion inside the dense core and the small asymmetric distribution of X-ray emission at 100 kpc from the nucleus. In the simulations by Quilis et al. (2001), buoyant bubbles of relativistic particles produced by a central AGN can induce gas “sloshing” (first introduced by Markevitch, Vikhlinin & Mazzotta 2001) around the center. The gas “sloshing” time depends on the radius and may produce structures extended in opposite directions on different scales. This residual gas motion may last for several Gyr.
4 Optical properties
4.1 Group properties and its environment
We performed optical imaging and spectroscopic observations of the ESO 3060170 group galaxies with the Danish 1.54m telescope at La Silla, Chile in October 2001, February 2002 and January 2004. Images of the ESO 3060170 field in Bessel B (900 sec for 13 13′) and Bessel R (720 sec for the central 13 and 150 sec for a wider 30 exposure) bands were obtained. We have also obtained spectroscopic observations of four galaxies (ESO 3060170, G2, G3 and G4 in Fig. 1). All these galaxies are group members (Table 3) and have typical early-type galaxy spectra without emission lines. Within 0.5 rvir ( 16′) of ESO 3060170, the second brightest galaxy is 2.6 mag fainter than ESO 3060170. Thus, ESO 3060170 is a fossil group based on the definition of fossil group in J03. In fact, the ESO 3060170 group is so hot ( 2.7 keV) that it can be considered a poor cluster, making it the most massive fossil group known. Within rvir, the second brightest galaxy (ESO 3060160, 19.7′ from ESO 3060170) is 1.5 mag fainter than ESO 3060170 in the R-band, while all other galaxies are at least 2.4 mag fainter than ESO 3060170. We estimate that the time for ESO 3060160 to merge into ESO 3060170 by dynamical friction is at least 18 Gyr (using equation 7-26 in Binney & Tremaine, 1987). Thus, any luminous group galaxies beyond 700 kpc from ESO 3060170 have not had enough time to merge into ESO 3060170.
The galaxy distribution within rvir (32.2′) of ESO 3060170 clearly shows a north-south elongation, which is in the same direction as that of the optical light of ESO 3060170. Between rvir and 4 rvir (the group infall region), there is a galaxy excess ( 60%) to the north and south. All galaxies with a similar redshift to ESO 3060170 (5 in total) in this annulus lie along the north-south axis. Although detailed optical spectroscopic observations are required for confirmation, the data support the existence of a filament extending north-south from 100 kpc to several Mpc.
4.2 Optical properties of ESO 3060170 & evidence of merging
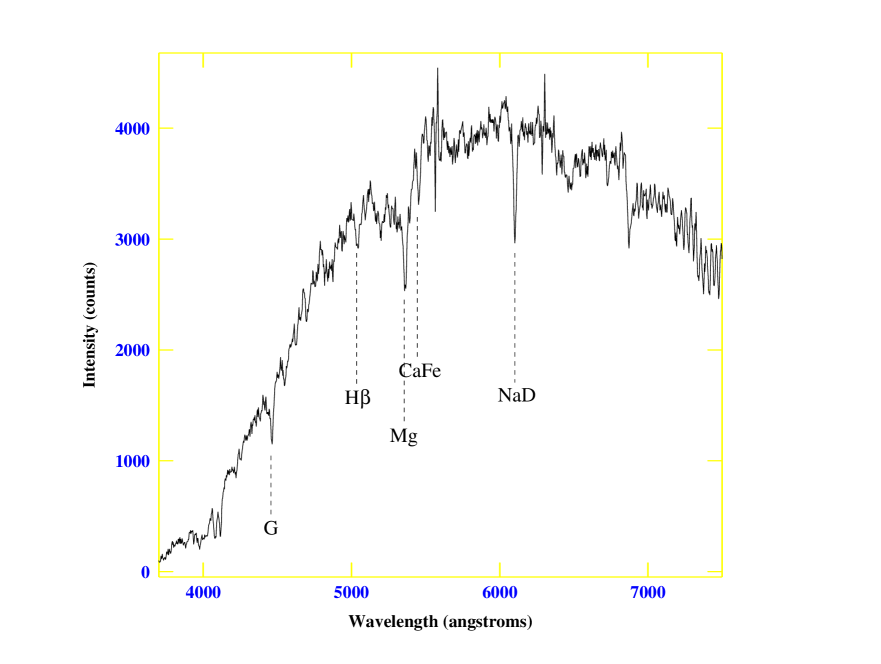
The optical properties of ESO 3060170 are important for understanding the group evolution. We obtained medium resolution (0.83 nm) optical spectra along along the major and minor axes of ESO 3060170 with the Danish Faint Object Spectrograph and Camera on the Danish 1.54m telescope at La Silla, Chile. The spectra along the major and minor axes are quite similar and we show the major axis spectrum in Fig. 8. The spectra reveal that ESO 3060170 is a typical early-type galaxy without recent star-formation activity. The nuclear spectrum also shows no evidence for emission lines.
The R band galaxy light profile of ESO 3060170 can be followed to a semi-major axis of 4.35′ or 186 kpc. The measured R-band magnitude of ESO 3060170 within that range is 11.72 mag after correction for Galactic extinction and K correction, which corresponds to an R-band luminosity of 2.63 1011 L⊙ (MR = -24.4 + 5 log h0.7). This is comparable to the optical luminosity of cDs in rich clusters and somewhat higher than the average optical luminosity of the brightest galaxies in poor clusters (Fig. 9 of Thuan & Romanishin 1981). We fit the R-band optical light with a de Vaucouleurs r1/4 profile and find that the surface brightness declines more rapidly than the r1/4 law. The derived half light radius is 38.5 kpc, but the best-fit r1/4 model overestimates the surface brightness by 30% - 90% beyond 60 kpc. The lack of an extended envelope implies ESO 3060170 is not a cD galaxy.
We used ELLIPSE in the STSDAS package to measure the ellipticity of ESO 3060170 in the R band to a semi-major axis of 2.5′ (Fig. 9). The optical ellipticity is significantly larger than that in X-rays beyond 50 kpc, which is typical for brightest cluster ellipticals (Porter, Schneider & Hoessel 1991). The optical position angle is consistent with that in X-rays within 2′ (semi-major axis) and changes little ( -5 ) beyond that. The alignment could arise from anisotropic collapse along the main filament (e.g., West 1994). The orientation of the central galaxy still reflects the initial density field.
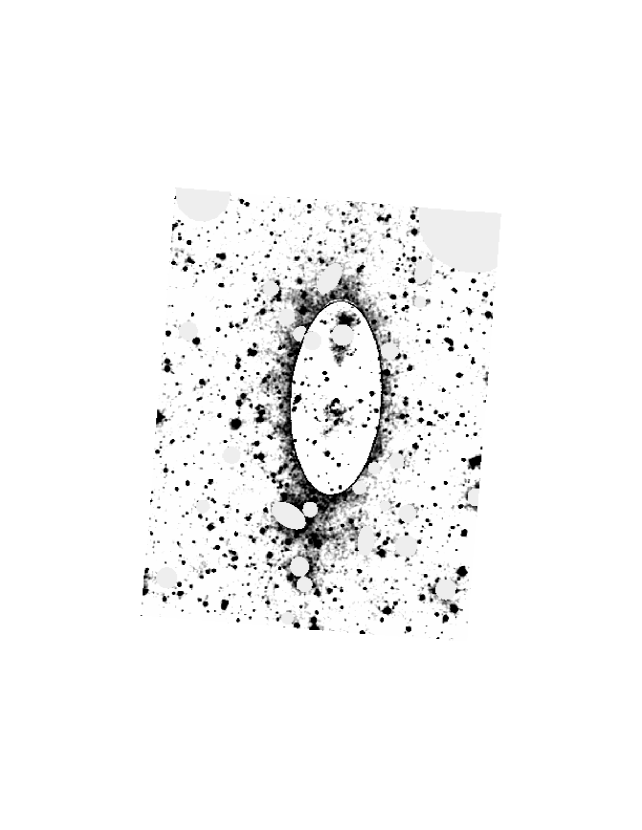
Diffuse and asymmetrical optical light around ESO 3060170 is revealed after the model derived by ELLIPSE is subtracted (Fig. 10). The elongated excess around galaxy G1 may be produced by the tidal force of ESO 3060170. Similar distortions are also shown in simulations (e.g., Weil, Bland-Hawthorn & Malin 1997) as expected in large-mass-ratio accretion. At 130 - 200 kpc south of the nucleus, significant light excess on the level of 25.4 mag arcsec-2 (R-band) is also detected (Fig. 10). The corresponding R-band luminosity is 7 109 L⊙, about half that of G1. This region, still along the major axis, is within the tidal radius of ESO 3060170 for 109 - 1010 M⊙ galaxies. Thus, the southern excess may be the relic of one or several small galaxies accreting into ESO 3060170. This kind of feature persists for less than 1 Gyr (e.g., Weil et al. 1997), which indicates that ESO 3060170 is still accreting small member galaxies along the main filament.
5 Mass profile & M/L ratio
The gas density and temperature profiles can be used to derive the total gravitational mass profile under the assumption of hydrostatic equilibrium. The Chandra temperature profile beyond the central 10 kpc and XMM-Newton temperature profile beyond the central 40 kpc are fitted simultaneously with a fifth order polynomial. To constrain the temperature gradient at kpc, we included the temperature measured from a small region between 450 and 660 kpc (see 2.5) and increased its uncertainty by a factor of two. The Chandra and XMM-Newton electron density profiles outside the dense cool core are modeled by first dividing the profiles with the best-fit single- model. The residuals are fitted by a sixth-order polynomial. Combining the temperature and the density profiles and through a series of Monte Carlo simulations, we derive the total mass profile outside the central 10 kpc (Fig. 11). The shape of the total mass profile reflects the steepening of density profile at large radii. Within the central 60 kpc (excluding the central 15 kpc with large uncertainties), M r2.1±0.2, consistent with the prediction of the NFW profile. The gas mass profile can be derived from the electron density profile. The gas fraction increases with radius but remains constant at 0.05 between 200 kpc (0.15 rvir) and 405 kpc (Fig. 11). This gas fraction profile is very similar to that of A1983 (Pratt & Arnaud 2003).
We measured R-band photometry for galaxies within a 405 kpc radius. The contribution from background and foreground galaxies is estimated from the projected galaxy density to the east and west between rvir and 4 rvir radii. Within 405 kpc, about 5% of galaxies are background or foreground. The M/L ratio within 405 kpc is 150 M⊙/L⊙, similar to that measured for other systems (Sanderson & Ponman 2003). The baryon fraction within 405 kpc is 0.08 assuming an R-band stellar mass-to-light ratio of 5.
We can compare the derived total mass distribution to dark matter halo models (e.g., Navarro, Frenk & White 1997; Moore et al. 1998). Although the two parameters in these two profiles, (central overdensity) and (characteristic radius), are highly degenerate in fitting the total mass profile over a limited range, the uncertainty for the concentration parameter is small. The two models fit the data similarly, but the derived concentration parameter from the Moore profile ( 3.3) predicts a reasonable halo mass of 1.8 1014 M⊙ for the ESO 3060170 group, while that derived from the NFW profile ( 8.7) implies a halo mass 10 times smaller. Both models predict r200 = 0.92 - 1.05 Mpc, which is smaller than the value predicted by the self-similar relation in EMN96 (1.3 Mpc).
6 Discussion
6.1 The central 50 kpc — the heated phase of a normal cooling core?
Although the gas cooling time within the central 50 kpc is smaller than the Hubble time, this hot group only hosts a small dense cool core (10 kpc in radius) and lacks a group-sized cooling core which is found in many relaxed groups (e.g., NGC 1550 - S03; MKW 4 - O’Sullivan et al. 2003). Since fossil groups are believed to be old and relaxed systems (e.g., Jones et al. 2000), group-sized cooling cores should develop at their centers, especially when there is a small dense cool core as the “seed” for the inflow of the surrounding gas (e.g., Brighenti & Mathews 2002). For the observed parameters of ESO 3060170, a group-sized cooling core should develop within 2 Gyr in the absence of a significant heat source.
The puzzle of the missing group-sized cooling core in ESO 3060170 can be reconciled with our understanding of fossil groups, if an existing cooling core has been reheated. Possible heat sources include: thermal conduction, a central AGN and minor mergers along the filament. Thermal conduction with 0.2 of the classical Spitzer value (Narayan & Medvedev 2001) can just barely balance the cooling between 15 and 50 kpc if the cooling induces a temperature gradient similar to those in NGC 1550 and MKW 4. The gas cannot be heated to produce the observed, flat temperature profile. Moreover, the the abrupt temperature change across the cool core boundary implies a large suppression of thermal conduction.
The energy budget to heat the gas between 10 and 50 kpc to the observed value is estimated to be 1059 ergs. Waves generated by subgroup infall can provide enough energy to heat the gas in this region (e.g., Churazov et al. 2003). However, such activity (subgroup infall) is not apparent in the optical data in which only infall of individual small galaxies along the filament is present (4.2). A central AGN outburst can also provide the required energy. If the central AGN is active for 108 yr, the required heating rate is 3 ergs s-1. The PMN surveys (Wright et al. 1994) only give an upper limit of 48 mJy at 4.85 GHz in the position of ESO 3060170. This region has been observed by the more sensitive Sydney University Molonglo Sky Survey (SUMSS) at 843 MHz (Bock, Large & Sadler 1999) and a 19 mJy source is detected at the position of ESO 3060170 (private communication with D. Hunstead). There is another 19 mJy source detected 2.2′ southeast of ESO 3060170 nucleus, which may also be associated with ESO 3060170 in view of the poor angular resolution of SUMSS (46 at the position of ESO 3060170). This corresponds to a total radio luminosity (10 MHz - 10 GHz) of 3 - 6 ergs s-1 if the spectral index is 0.8. From Fig. 1 of Bîrzan et al. (2004), radio sources with this total luminosity can have a mechanical power on the order of 1043 ergs s-1. Thus, it is possible that a central AGN outburst can heat the gas between 10 and 50 kpc. This argument is further strengthened if the central radio source has faded considerably after the outburst since the lifetime of the radio synchrotron emission is only 24 (B/10 G)-3/2 (/1.4 GHz)-1/2 Myr after the injection of relativistic electrons from the nucleus has stopped.
Therefore, a previous AGN outburst remains as a plausible heat source. In this scenario, the central 50 kpc, once a typical cooling core, has been heated by a central AGN outburst in the past. The energy, transported by narrow jets, was deposited beyond the central 10 kpc so that the central part of the cooling core survived. The survival of the central cooling core after an AGN outburst is not a surprise. Bright radio lobes have been detected around the 1 keV galaxy coronae of NGC 4874 and NGC 3842 (Sun et al. 2004), which strongly implies that most of the mechanical power is released at moderate distances from the nucleus. After the initial AGN outburst, the convection mixes the gas between 10 and 50 kpc to reduce the temperature gradient. In the simulations by Quilis, Bower & Balogh (2001), about 0.7 Gyr after the energy injection from bubbles, the displaced gas begins to fall back toward the core and a cool core may form. Thus, the group-sized cooling core was truncated at 10 kpc, leaving a dense cool core at the very center. The magnetic field around the small cool core may have been compressed and stretched along the boundary so that thermal conduction is largely suppressed at the boundary of the dense cool core. In this sense, NGC 1550 and ESO 3060170 possess cooling core at two different phases - a normal cooling core (NGC 1550) and a heated core after an AGN outburst (ESO 3060170). One group with properties similar to those of ESO 3060170 is AWM 4 (O’Sullivan et al. 2004) although there is no small cool core detected by XMM-Newton.
6.2 The inner entropy profiles of galaxy groups
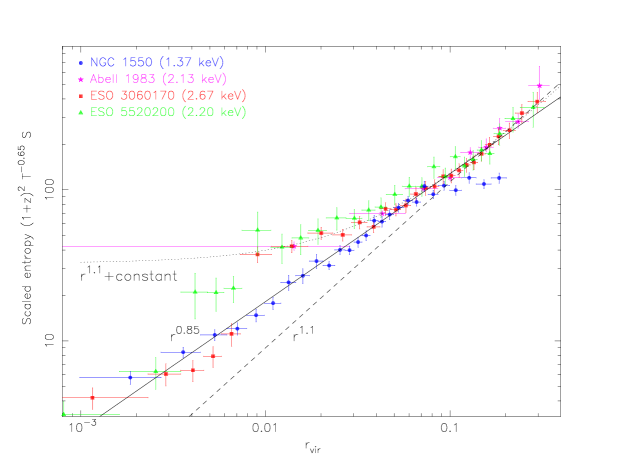
The entropy profile of the ESO 3060170 group can be compared with those of other groups. Ponman et al. (2003) studied a sample of 66 virialised systems and showed that S T∼0.65, significantly shallower than the self-similar prediction (S T). We plot the scaled entropy profiles ((1+z)) of the ESO 3060170 group and two other 2-3 keV groups in Fig. 12 (ESO 5520200; A1983 - Pratt & Arnaud 2003), and one cooler group NGC 1550. The scaled profiles show good agreement from 0.04 to 0.08 rvir, and within 0.008 rvir. Between 0.01 and 0.04 rvir, ESO 3060170 and ESO 5520200 have entropy excesses relative to the NGC 1550 group. This variety of inner entropy profiles is related to the evolutionary stages of group cooling cores. Groups with heated gas cores can have flat inner entropy profiles (also e.g., AWM 4, O’Sullivan et al. 2004), while those with large cooling cores do not have flat entropy cores. At large radii, the entropy profiles of the three 2 - 3 keV groups agree well with each other.
The simulations involving only gravity and shock heating predict S r1.1 (Tozzi & Norman 2001), which can be tested by our data. If the flattened entropy profiles from 0.01 - 0.04 rvir and the flattened profile of NGC 1550 beyond 0.09 rvir are excluded, our data indicate S r0.85. Separate fits to 0.001 - 0.1 rvir and 0.1 - 0.3 rvir yield S r0.84 and S r1.03±0.08 respectively. Although the entropy profiles at large radii have a slope close to that predicted, they certainly flatten within 0.1 rvir. This is an indication of significant non-gravitational processes at the center. However, the observed profiles are also inconsistent with recent simulations including non-gravitational processes (e.g., Borgani et al. 2004). We also note that the entropy profiles of the hot groups in our plot are much flatter than that of NGC 1550 beyond the central cool core. We tried another model composed of a power law and a constant representing an isentropic core, to fit the entropy profiles of the hot groups beyond 0.007 rvir. The data can be fitted well by this “hybrid” model. The best-fit power law index is 1.130.07, consistent with the r1.1 scaling. Although this is not exactly the isentropic core shown in the simulations, it implies that isentropic gas cores can be present in groups with heated cores.
7 Conclusion
We find that the ESO 3060170 system is a hot (2.7 keV), massive (1 - 2 1014 M⊙) and X-ray luminous (6.6 ergs s-1) fossil group. The main conclusions of our study are:
1. The X-ray emission of the group is composed of two components, a central dense cool core (1.3 keV and 10 kpc in radius) and a hotter ambient medium ( 2.7 keV). From 10 kpc to the cooling radius ( 50 kpc), the temperature profile is surprisingly flat, although the gas cooling time is only 2 - 6 Gyr. Thus, the ESO 3060170 group does not have a group-sized cooling core as found in other groups (e.g., NGC 1550, S03; MKW 4, O’Sullivan et al. 2003). We suggest that the central 50 kpc of the ESO 3060170 group has been heated by a central AGN outburst. The cooling core has been disrupted and the dense cool core within 10 kpc is the relic of the original cooling core.
2. The X-ray emission from the group is elongated north-south, just as the optical light of ESO 3060170 and the galaxy distribution of the group. Some X-ray features are found around the center, including a “finger”, an edge-like feature and a small tail trailing behind it, all aligned north-south, which may be caused by gas “sloshing” along the north-south filament. The AGN outburst that destroyed the group cooling core could induce this residual gas motion.
3. ESO 3060170 is optically luminous (MR = -24.4 + 5 log h0.7) and has a normal early-type galaxy optical spectrum. Though no extended envelope in excess of the de Vaucouleurs profile is found, asymmetric diffuse optical light is found to 130 - 200 kpc south of the nucleus, which may be the remains of small galaxies accreted within the last 1 Gyr.
4. Beyond the cooling radius to 450 kpc (or 1/3 rvir), the temperature profile is flat (both Chandra and XMM-Newton), inconsistent with the prediction from recent simulations (Loken et al. 2003; Borgani et al. 2004). The abundance profile is rather flat beyond the central 40 kpc. At large radii (200 - 450 kpc), the abundance is 0.35 solar for this optically poor group.
5. We compare the scaled entropy profiles (scaled by T-0.65) of three hot groups and one cool group with the simulations. We find S r∼0.85, flatter than the prediction (S r1.1) from simulations involving only shock heating. We suggest that the entropy profiles within the cooling radius are related to the evolutionary stage of group gas core. Isentropic gas cores can persist for groups with large heated cores.
6. The gas fraction profile of the ESO 3060170 group is flat at 0.05 between 200 and 450 kpc. (M/L) 150 at 405 kpc, which implies that the mass-to-light ratio of this fossil group is normal.
References
- (1) Abell, G. O., Corwin, H. G., Olowin, R. P. 1989, ApJS, 70, 1
- (2) Anders, E., & Grevesse N. 1989, Geochimica et Cosmochimica Acta, 53, 197
- (3) Beuing, J., Döbereiner, S., Böhringer, H., & Bender, R. 1999, MNRAS, 302, 209
- (4) Binney, J., & Tremaine 1987, Galactic Dynamics. Princeton Univ. Press, Princeton, NJ
- (5) Bîrzan, L., Rafferty, D. A., McNamara, B. R., Wise, M. W., Nulsen, P. E. J. 2004, ApJ, in press (astro-ph/0402348)
- (6) Bock, D. C.-J., Large, M. I., Sadler, E. M. 1999, AJ, 117, 1578
- (7) Borgani, S. et al. 2004, MNRAS, 348, 1078
- (8) Brighenti, F., & Mathews, W. G. 2002, ApJ, 567, 130
- (9) Brown, B. A., & Bregman, J. N. 1998, ApJ, 495, 75
- (10) Churazov, E., Forman, W., Jones, C., Böhringer, H. 2003, ApJ, 590, 225
- (11) Evrard, A. E., Metzler, C. A., Navarro, J. F. 1996, ApJ, 469, 494
- (12) Finoguenov, A., David, L. P., Ponman, T. J. 2000, 544, 188
- (13) Finoguenov, A., Arnaud, M., David, L. P. 2001, ApJ, 555, 191
- (14) Jones, L. R., Ponman, T. J., Forbes, D. A. 2000, MNRAS, 312, 139
- (15) Jones, L. R. et al. 2003, MNRAS, 343, 627 (J03)
- (16) Khosroshahi, H., Jones, L., Ponman, T. 2004, MNRAS, 349, 1240
- (17) Loken, C. et al. 2003, ApJ, 579, 571L
- (18) Lumb, D. H., Warwick, R. S., Page, M., De Luca, A. 2002, A&A, 389, 93
- (19) Majerowicz, S., Neumann, D. M., & Reiprich, T. H. 2002, A&A, 394, 77
- (20) Markevitch, M., Vikhlinin, A., Mazzotta, P. 2001, ApJ, 562, 153L
- (21) Marty, P. B. et al. 2002, SPIE, 4851, 208 (astro-ph/0209270)
- (22) Moore, B., Governato, F., Quinn, T., Stadel, J., & Lake, G. 1998, ApJ, 499, L5
- (23) Mulchaey, J. S., & Zabludoff, A. I. 1999, ApJ, 514, 133
- (24) Narayan, R., & Medvedev, M. V. 2001, ApJ, 562, 129
- (25) Nath, B. B. 2003, MNRAS, 340, 1
- (26) Navarro, J., Frenk, C., & White, S. 1997, ApJ, 490, 493
- (27) O’Sullivan, E., Vrtilek, J. M., Read, A. M., David, L. P., Ponman, T. J. 2003, MNRAS, 346, 525
- (28) O’Sullivan, E., Vrtilek, J. M., Kempner, J. C., David, L. P., Houck, J. C. 2004, MNRAS, submitted
- (29) Ponman, T. J. et al. 1994, Nature, 369, 462
- (30) Ponman, T. J., Sanderson, A. J. R., & Finoguenov, A. 2003, MNRAS, 343, 331
- (31) Porter, A. C., Schneider, D. P., Hoessel, J. G. 1991, AJ, 101, 1561
- (32) Pratt, G. W., & Arnaud, M. 2003, A&A, 408, 1
- (33) Quilis, V., Bower, R. G., & Balogh, M. L. 2001, MNRAS, 328, 1091
- (34) Sakelliou, I. 2000, MNRAS, 318, 1164
- (35) Sanderson, A. J. R., Ponman, T. J., Finoguenov, A., Lloyd-Davies, E. J., & Markevitch, M. 2003, MNRAS, 340, 989
- (36) Sanderson, A. J. R., & Ponman, T. J. 2003, MNRAS, 345, 1241
- (37) Sun, M., Forman, W., Vikhlinin, A., Hornstrup, A., Jones, C., Murray, S. S. 2003, ApJ, 598, 250 (S03)
- (38) Sun, M., Vikhlinin, A., Forman, W., Jones, C., Murray, S. S. 2004, ApJ, submitted
- (39) Thuan, T. X., & Romanishin, W. 1981, ApJ, 248, 439
- (40) Tozzi, P., Norman, C., 2001, ApJ, 546, 63
- (41) Vikhlinin, A. et al. 1999, ApJ, 520, L1
- (42) Weil, M. L., Bland-Hawthorn, J. & Malin, D. F. 1997, ApJ, 490, 664
- (43) West, M. J. 1994, MNRAS, 268, 79
- (44) Wright, A. E., Griffith, M. R., Burke, B. F., Ekers, R. D. 1994, ApJS, 91, 111
| Observing Time | Instrument / Telescope | Datamode | Total Exposure (ks) | Effective Exposure (ks) |
|---|---|---|---|---|
| Mar. 8, 2002 | ACIS-I / Chandra | VFaint | 14.4 | 14.0 |
| Mar. 9, 2002 | ACIS-I / Chandra | VFaint | 14.1 | 13.6 |
| Oct. 11, 2002 | M1, M2, PN / XMM-Newton | PrimeFull | 17.8, 17.8, 14.8 | 15.8, 16.5, 5.2 |
| Chandra | Chandra | XMM-Newton | XMM-Newton | XMM-Newton | Combined | |
|---|---|---|---|---|---|---|
| Obs 3188 | Obs 3189 | MOS1 | MOS2 | PN | ||
| T (keV) | 2.690.10 | 2.570.10 | 2.670.12 | 2.630.11 | 2.570.10 | 2.630.05 |
| Abundance (solar) | 0.470.08 | 0.390.06 | 0.480.08 | 0.440.07 | 0.440.07 | 0.440.03 |
| /dof | 137.0/116 | 121.5/117 | 106.1/84 | 116.4/87 | 116.5/97 | 602.4/509 |
| LX (0.5 - 2 keV)b | 2.47 | 2.55 | 2.41 | 2.65 | 2.69 | 2.550.12 |
| L | 6.48 | 6.66 | 6.20 | 6.79 | 6.87 | 6.600.27 |
a Using MEKAL model and fixing absorption at 31020 cm-2
b Integrated within 450 kpc radius and in unit of 1043 ergs s-1
| Galaxy | RA | decl. | Velocity | R |
|---|---|---|---|---|
| (J2000) | (J2000) | (km/s) | (mag) | |
| ESO 3060170 | 05:40:06.67 | -40:50:11.4 | 1075530 | 11.72 |
| G2 | 05:40:12.94 | -40:53:09.5 | 1203035 | 14.33 |
| G3 | 05:39:57.30 | -40:53:55.8 | 1082336 | 14.78 |
| G4 | 05:40:07.48 | -40:47:09.6 | 931248 | 15.08 |
| ESO 3060160a | 05:39:53.44 | -40:30:45.0 | 11182 | 13.20 |
a The velocity and R magnitude are from NED.