11email: alain.blanchard@ast.obs-mip.fr 22institutetext: LATT, 14 avenue Edouard Belin, F-31400 Toulouse, France
22email: douspis@ast.obs-mip.fr
Evidence for new physics from clusters ?
The abundance of local clusters is a traditional way to derive the amplitude of matter fluctuations, commonly specified by , but which suffers from a systematic uncertainty arising from the lack of accurate knowledge of the mass temperature relation. In the present work, by assuming that the observed baryon content of clusters is representative of the universe, we show that the mass temperature relation () can be specified for any cosmological model. WMAP constraints on the baryonic content of the Universe and the relation allows one further improvement in tightening this relation. This approach allows to remove most of the above uncertainty, and to provide an estimation of whose uncertainty is essentially statistical. The values we obtain are fortuitously almost independent of the matter density of the Universe () with an accuracy better than 5%. Quite remarkably, the amplitude of matter fluctuations can be also tightly constrained to similar accuracy from existing CMB measurements alone, once the dark matter content is specified. However, the amplitude inferred in this way in a concordance model () is significantly larger than the value derived from the above method based on X-ray clusters. Such a discrepancy would almost disappear if the actual optical thickness of the Universe was 0 but could also be alleviated from more exotic solutions: for instance the existence of a new non-baryonic light dark component in the Universe as massive neutrinos, with . However, recent other indications of favor a high normalization. In this case, the assumption that the baryonic content observed in clusters actually reflects the primordial value has to be relaxed : either there exists a large baryonic dark component in the Universe with or baryons in clusters have undergone a large depletion during the formation of these structures. We concluded that the baryon fraction in clusters is not representative and therefore that an essential piece of the physics of baryons in clusters is missing in standard structure formation scenario.
Key Words.:
Cosmology – Galaxy clusters – CMB – Cosmological parameters1 Introduction
The amplitude of matter fluctuations in the present-day universe is an important quantity of cosmological relevance. The abundance of clusters is an efficient way to evaluate this quantity, commonly expressed by , the r.m.s. amplitude of the matter fluctuations on the scale. A statistical precision of a few % on is possible from existing samples of X-ray clusters, but in practice the relation between mass and temperature is needed for such evaluation:
| (1) |
(Oukbir and Blanchard, 1992), being the present–day matter density parameter and being the contrast density relative to the Universe at the radius at which is taken. The value of has been estimated from X-ray properties of clusters by different methods, essentially hydrostatic equations on one side and numerical simulations on the other side, which lead to different normalizations (from to ). Mass lensing measurements of clusters could in principle provide a direct measurement of this quantity but present-day results are contradictory. This question remained unresolved because the amplitude of matter obtained from clusters with hydrostatic equations leads to low values, (Markevitch 1998, Reiprich et al. 2002, Seljak 2002) while WMAP recently obtained (Spergel et al. 2003). However, the virial cluster masses are difficult to obtain, and values inferred with different methods spread a large range of values; for instance Roussel et al. (2000) pointed out that hydrostatic mass estimations were lower than values inferred from numerical simulations and Henry (2004) recently found that published values of , a quantity proportional to , could differ by a factor of nearly two. This leaves a large uncertainty on the actual amplitude of matter fluctuations derived from clusters. In this paper, we propose a new approach to derive the mass-temperature relation in a self-consistent way. This allows us to combine the baryon budget from the CMB, observed gas mass in clusters and the present day abundance of clusters to infer a tight constraint on the amplitude of matter fluctuations obtained from the cluster abundance and compare it to the amplitude inferred from the CMB.
2 Mass-Temperature relation
2.1 The - degeneracy.
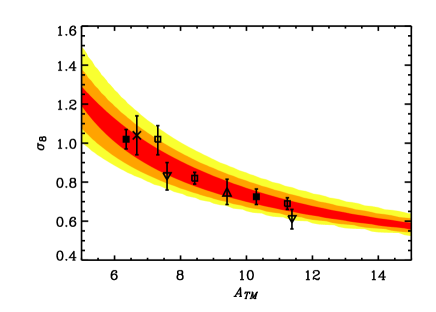
The determination of from the cluster abundance is a standard procedure that has been used by many authors, leading to somewhat dispersed values. Here we use the Sheth and Tormen (1999) mass function and a sample of X-ray selected local clusters ( erg/s/cm2 and , Blanchard et al., 2000 updated from BAX, Sadat et al. 2004). The relation between - is presented in Figure 1 for a flat model with with some other recent measurements, based on ROSAT samples of X-ray clusters and a recent analytical mass functions (del Popolo 2004). We do not include analyses based on HEAO-1 such as Henry (2004) or using the classical Press and Schechter expression as do Ikebe et al. (2001), or other mass functions. A NFW profile (Navarro et al. 1995) with was assumed when necessary. This shows that most of the dispersion among different analyses (which use nearly the same clusters) is due to the different values used for the normalization constant . Most of the remaining differences are due to differences in temperatures used (with or without cooling flow correction, or temperature cuts). Notice that the point presenting the largest deviation (Viana et al. (2002)) is based on the luminosity function. We converted their mean luminosity to a mean temperature of 2.68 keV to derive an equivalent .
2.2 The baryon fraction argument
Clusters are useful cosmological probes in several important ways. Their baryonic fraction can be inferred from observations:
| (2) |
the mass in observed baryons, , consists mainly of the X-ray gas and of a small part of the stars (Roussel et al 2000), while the total mass could be estimated through one of the above–mentioned methods. Under the assumption that the baryonic and dark matter amounts are representative of the universe, the baryon fraction can be related to the cosmological parameters density and :
| (3) |
is a numerical factor that has to be introduced in order to correct for the depletion of gas during cluster formation and which can be determined only from numerical simulations (White et al. 1993). In practice, a good working value, at least in the outer part of clusters, is (Frenk et al. 1999). The baryonic content of the Universe is now known quite accurately through WMAP and other CMB measurements (, Spergel et al. 2003; the statistical uncertainty being doubled in order to account for differences in various priors), essentially consistent with the abundance of Deuterium (Kirkman et al. 2003) and with the baryonic content of the IGM (Tytler et al 2004).
2.3 Self-consistent mass-temperature relation
While the above relations have been widely used to obtain constraints on assuming that the relation is known, here we follow a different approach. Given the uncertainty in the actual value of , we can use the knowledge of gas (and stars) masses in clusters and of to constrain the total mass in clusters, at least as a function of and , and thereby infer the mass-temperature relation. A slight source of complexity in gas mass measurements comes from the fact that the gas in clusters may be clumpy. If so, the gas mass estimation from average radial profile of the emissivity overestimates the actual gas mass by a factor , where is a measurement of the clumping of the gas. Sadat and Blanchard (2001) have studied in detail the change in shape of the gas fraction with radius in clusters: they found that the gas fraction follows rather well a scaling law, i.e. it is roughly identical among different clusters when expressed in term of the radius normalized to the virial radius. Furthermore they found that in the outer part the shape was close to what has been found in numerical simulations provided the outer amplitude is corrected for clumping (the value of being roughtly constant for ). This implies that correction for clumping is indeed important to have an unbiased description of the internal structure of clusters. Mathiesen et al. (1999) found an average of 1.16 at the radius corresponding to a contrast density of 500 (they also found that taking only clusters with no secondary peak at a level of 1% of the global maximum reduced the average to 1.093). Because the clumping factor seems to vary rapidly with radius, it is safe to work on clusters at a similar radius. We have used the gas mass determination from Vikhlinin, Forman and Jones (1999, VFJ99 hereafter), using their most external radius for mass determination, which is dependent, at the average temperature of 4 keV. VFJ99 provided gas mass measurements at the radius R1000 where the contrast density in the gas is 1000 times some fiducial baryon density (2.85 /Mpc3), which corresponds to nearly half of the best derived from WMAP. Typical density contrasts at our working radius are in the range 480–625, at which we can directly apply the above correction for clumping. VFJ99 excluded clusters with double or very irregular X-ray morphology, a criteria that seems less demanding than the criteria for regularity used by Mathiesen et al. (1999). However, in both cases roughly one third of the clusters were excluded from the analysis. We therefore used the value = 1.093. The difference to = 1.16 is a source of systematic uncertainty on the final mass of 6%. We further corrected for a star contribution of % (Roussel et al. 2000). Knowing the baryon mass, relations 2 and 3 can be used to infer the total mass (depending on ) at the radius R1000. Finally, in order to use the above mass estimation in the mass function we need to estimate the mass at the virial radius (unfortunately measurements of both apparent gas mass and clumping are not available at the virial radius). This virial mass can be estimated assuming a NFW profile with a fixed concentration parameter . Hereafter we used . WMAP has provided high precision data in a field where order of magnitude estimations were the only possibility a few years ago. This allows us to constrain very tightly some quantities which are often combinations of a few cosmological parameters. For the present analysis, we use the location of the so–called Doppler peak which allows us to establish a tight relation between and in a flat universe (Page et al. 2003). The above procedure has been applied to derive the mass temperature normalization as a function of . The result is shown in Figure 1. As one can see the above procedure allows us to determine the value of as a function of with a small uncertainty : we found , for ; the values cover the range of the various estimations based on the different approaches that we have mentioned. From this relation we can now infer the typical temperature of clusters formed from fluctuations within Mpc spheres:
| (4) |
therefore, the amplitude of matter fluctuations is essentially controlled by the abundance of clusters with temperatures around 3.5 keV almost independently of the value (this comes from the fact that varies with and that this variation accidentally compensates almost exactly the variation obtained for a fixed value of ). Knowing the mass-temperature relation and its uncertainty we can determine the amplitude of matter fluctuations by fitting the local temperature distribution function and assuming a -like spectrum with as explained in section 2.1.
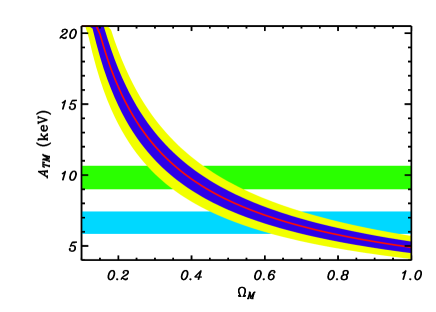
The result is shown in Figure 2a. As one can see, at a given value of the amplitude of is well constrained. Furthermore to the first order the best is independent of ( for . Interestingly this is close to the value obtained by Viana et al. (2002): ). Our conclusion appears somewhat surprising as it differs from standard analyses based on a fixed normalization , which cannot simultaneously account for the baryon fraction in a consistent way for arbitrary . Gas masses from the VFJ99 sample present a moderate dispersion of the order of 20% (Sadat et al. 2005), implying rather small uncertainties on our gas fraction estimates of the order of about 4% at our working radii, which will produce an uncertainty on of 2.5%. More important is the correction for clumping. For instance, Voevodkin & Vikhlinin (2004) have estimated from the baryon mass function in a Cold Dark Matter framework. In the case their approach is very close to ours, but they used gas mass estimation at the virial radius and did not correct for clumping. This leads to virial masses which are lower than ours, leading to keV and therefore , in very good agreement with their estimation.
3 Need for Dark Matter
The amplitude of matter fluctuations is strongly constrained by the CMB data. In the following we use the constraint on in a concordance model obtained from the CMB fluctuation analysis including the temperature–polarization cross power spectrum (TE) by the WMAP team (Kogut et al 2003).
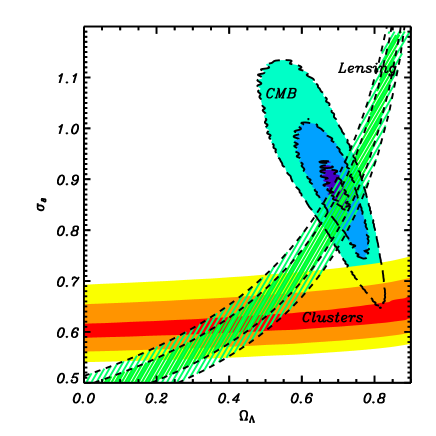
The comparison of the value of from CMB data with the one from clusters reveales a critical discrepancy between the two measurements (Figure 2a). It is clear that within any model with the amplitude of we derived from clusters, , is significantly smaller than what is expected from the CMB alone (), which is close to the recent determination from the combination of WMAP and the Lyman forest (Seljak et al 2004).
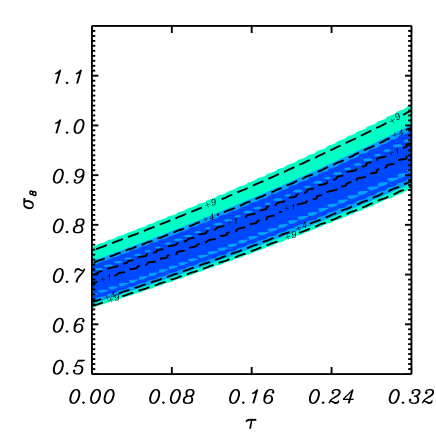
The non-zero optical thickness , which is requested only from the TE spectrum, is a key factor in this discrepancy: the high obtained from CMB data depends critically on the actual amplitude of the optical thickness (see Figure 2b), although forcing does not entirely remove the discrepancy. An accurate knowledge of is therefore critical to properly evaluate the amplitude of matter fluctuations in the concordance model. One can see from Figure 2b how much the value of obtained from CMB data depends on the actual value of the optical thickness and remains the main source of uncertainty in establishing the value of . We have also checked that when CMB data are restricted to the range , the above discrepancy remains essentially unchanged. Allowing a non-power law initial power spectrum is therefore not expected to solve this issue.
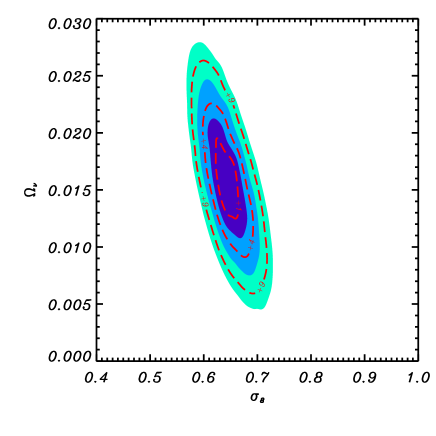
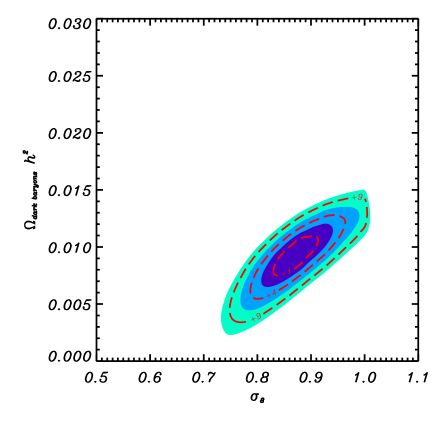
Here above, we have considered models in which the dark matter is only made of cold dark matter, the dark energy being a pure cosmological constant (in terms of the equation of state of vacuum , this means ), and that X-ray gas and known stars are the only existing baryons in clusters. A first possibility to investigate is to examine whether a different equation of state for the vacuum, so-called quintessence, might solve this discrepancy. We have therefore investigated flat models with arbitrary and quintessence content . Indeed combinations of CMB and cluster data are known to provide tight constraints on such models (Douspis et al. 2003). With the approach developed here, models which were found to match CMB and clusters were found to satisfy the following constraints: and . Such models are currently at odds with constraints on quintessential models (Douspis et al. 2003; Tegmark et al. 2003; Riess et al. 2004) resulting from the combination of various data including type Ia supernovae data. We therefore require an alternative approach to solve the above issue. In the following, we examine whether the introduction of an additional component of the dark matter content of the universe would remove the above discrepancy. Neutrinos are known to exist and to be massive, so perhaps the most natural massive component of the universe to be introduced is in the form of a neutrino contribution. This solution has already been advocated to solve this discrepancy in an Einstein de Sitter Universe (Elgarøy & Lahav 2003, Blanchard et al. 2003). Indeed, the presence of a light, but non-zero, component of dark matter significantly modifies the transfer function of primordial fluctuations which results in a lower amplitude on small scales. Given existing measurements of mass differences we consider only the case where the masses are equal. Within a concordance model ( ), by combining the constraints from CMB and cluster data, and marginalizing on (, , , ) we found that a contribution of is preferred with a significance level well above 3 (see Figure 3a), improving the significance of such possible evidence compared to Allen et al. (2003). This confirms that the presence of a small contribution of neutrinos, with a typical mass of .25 eV, to the density of the universe allows one to reconcile the amplitude of matter fluctuations from clusters with the one inferred from CMB data. We notice that such a value is above the upper limit inferred by the WMAP team using a combination of several astronomical data (Spergel et al. 2003). Finally, weak shear estimations have provided measurements of the amplitude of matter fluctuations which can be compared to that obtained from clusters (Refregier 2003). There are some differences in published values which probably reflect systematic uncertainties not yet fully identified. However, taking the independent measurements of from weak lensing obtained from an average of recent measurements (Bacon et al. 2003, Brown et al. 2004, Chang et al. 2004, Hamana et al. 2003, Heymans et al. 2004, Hoekstra et al. 2002, Jarvis et al. 2003, Massey et al., 2004, Refregier et al. 2002, Rhodes et al. 2004, Van Waerbeke et al., 2004) which lead to an acceptable , from WMAP and Lyman forest (Seljak et al 2004), and the value of from 2dFGRS (Hawkins et al. 2003), the low amplitude of obtained above is not favored. We are therefore left with the conclusion that our initial assumption that baryons in clusters are fairly representative of baryons in the universe is unlikely and therefore that the observed amount of baryons in clusters does not reflect the actual primordial value (a possibility that has been advocated by Ettori 2003). Several mechanisms could lead to this situation: the most direct way could be the fact that a significant fraction of the baryons are in a dark form, either in the Universe or in clusters (for instance either in the form of Machos, or in a large gaseous unidentified component, Bonamente et al, 2003), or that a significant fraction of the baryons has been expelled from clusters during their formation process. In such cases, the observed is biased to lower values. The actual mass of clusters from Eq. 2 and Eq. 3 can then be obtained assuming a depletion factor implying that represents the missing baryons. Again the combination of CMB and cluster constraints allows us to evaluate the amplitude of . From Figure 3b, one can see that such a component, , should represent nearly half () of the primordial baryons in order to solve the discrepancy. Although heating processes are required to account for the observed properties of X-ray clusters, they currently do not lead to such a high level of depletion (Bialek, Evrard & Mohr 2001).
4 Conclusions
The determination of the amplitude of matter fluctuations within pure cold dark matter model, using two methods, namely the CMB and the local cluster abundance, leads to two significantly different values. There are several ways to solve this discrepancy, although each represents a noticeable departure from the standard concordance model. The existence of a non-baryonic dark component, like a neutrino contribution, would allow us to solve this discrepancy, although such a solution leads to a low value of which is not favored by other evidence. If the actual value is larger, , the unavoidable conclusion is that the baryonic content of clusters at is not representative of the Universe. In this case, an astrophysical solution could be that baryons in clusters could be in a dark form, or at least undetected until now. Alternatively, baryons in clusters could have been severely depleted implying that the actual value is much smaller than the value we used above, the apparent baryon fraction being biased to low values compared to the actual primordial value. Finally, several observations might help to clarify this issue: the above conclusion relies on the actual value of the optical depth found by WMAP. If the actual value was consistent with zero most of the discrepancy would disappear. Confirmation of the actual value of is therefore critical and its better estimation will allow a better estimation of from the CMB. Other sources of information on will also obviously clarify this issue: weak lensing can potentially allow one to directly measure the actual amplitude of matter fluctuations with a similar precision to what has been obtained here with clusters, provided that systematic uncertainties are fully understood; the clusters masses could be measured from their lensing signal providing a direct estimation of the normalization constant , allowing one to distinguish between low and high normalizations. Other direct measurements of the amplitude of matter fluctuations like those derived from the Lyman– forest power spectrum (Croft et al. 1998) could also help clarify this issue. It is remarkable that some of the observations that are expected in the near future can potentially bring fundamental information on clusters physics or alternatively may reveal the existence of a previously unidentified type of dark matter with as low as 0.01.
Acknowledgements.
This research has made use of the X-ray cluster database (BAX) which is operated by the Laboratoire d’Astrophysique de Toulouse-Tarbes (LATT), under contract with the Centre National d’Etudes Spatiales (CNES). We acknowledge useful comments from the referee which contributed improving the paper.References
- Allen, Schmidt, & Bridle (2003) Allen, S. W., Schmidt, R. W. & Bridle, S. L. 2003, MNRAS 346, 593
- Bacon et al. (2003) Bacon, D., Massey, R., Refregier, A. & Ellis, R. 2003, MNRAS, 344, 673
- (3) Bialek, J. J., Evrard, A. E., & Mohr, J. J. 2001, ApJ, 555, 597
- Blanchard, Sadat, Bartlett, & Le Dour (2000) Blanchard, A., Sadat, R., Bartlett, J. G., & Le Dour, M. 2000, A&A, 362, 809
- (5) Blanchard, A., Douspis, M., Rowan-Robinson, M., & Sarkar, S. 2003, A&A 412, 35
- (6) Bonamente, M., Joy, M. K., & Lieu, R. 2003, ApJ 585, 722
- Brown et al. (2003) Brown M., et al., 2003 MNRAS, 341, 100
- Bryan (1998) Bryan, G.L. & Norman, M.L. 1998, ApJ 495, 80
- Chang et al. (2004) Chang T.-C., et al. 2004, ApJ submitted, astroph/0408548
- (10) Croft, R.A.C. Weinberg, D.H., Katz, N., Hernquist, L. 1998, ApJ 495, 44
- Del Popolo (2003) Del Popolo, A. 2003, ApJ, 599, 723
- (12) Douspis, M., Riazuelo, A., Zolnierowski, Y. & Blanchard, A. 2003, A&A 405, 409
- (13) Elgarøy, Ø. & Lahav, O. 2003, Journal of Cosmology and Astro-Particle Physics, 4, 4
- (14) Ettori, S. 2003, MNRAS 344, L13
- Evrard et al. (2002) Evrard, A. E., et al. 2002, ApJ 573, 7
- (16) Evrard, A.E., Metzler, C.A. & Navarro, J.F. 1996, ApJ 469, 494
- (17) Frenk, C.S, White, S.D.M et al., 1999, ApJ 525, 554
- (18) Grainge, K., et al. 2003, MNRAS 341, L23
- Ikebe et al. (2002) Ikebe, Y. et al. 2002, A&A 383, 773
- (20) Hamana T., et al. 2003, ApJ, 597, 98
- (21) Hawkins, E., et al. 2003, MNRAS, 346, 78
- Henry (2004) Henry, J. P. 2004, ApJ 609, 603
- Heymans et al. (2004) Heymans C. et al., 2004, astroph/0411324
- Hoekstra et al. (2002) Hoekstra H., Yee H. & Gladders M. 2002, ApJ, 577, 595
- Jarvis et al. (2003) Jarvis M., et al. 2003, ApJ, 125, 1014
- (26) Kirkman, D., Tytler, D., Suzuki, N., O’Meara, J. M. & Lubin, D. 2003, ApJS 149, 1
- (27) Kogut, A., et al. 2003, ApJS 148, 161
- (28) Kuo, C. L., et al. 2004, ApJ 600, 32
- (29) Massey, R., Refregier, A. Bacon, D. & Ellis, R. 2004, astroph/0404195
- (30) Markevitch, A. 1998, ApJ 504, 27
- (31) Mathiesen, B., Evrard, A.E. & Mohr, J.J. 1999, ApJ 520, L21
- (32) Navarro, J.F., Frenk, C.S. & White, S.D.M. 1995, MNRAS 275, 720 (NFW)
- (33) Oukbir, J. & Blanchard A. 1992, A&A 262, L21
- (34) Page, L., et al. 2003, ApJS 148, 233
- (35) Pearson, T. J., et al. 2003, ApJ 591, 556
- Pierpaoli, Borgani, Scott, & White (2003) Pierpaoli, E., Borgani, S., Scott, D., & White, M. 2003, MNRAS, 342, 163
- Pierpaoli, Scott, & White (2001) Pierpaoli, E., Scott, D., & White, M. 2001, MNRAS, 325, 77
- (38) Refregier, A. 2003, ARA&A 41, 645
- Refregier et al. (2002) Refregier A., Rhodes J., & Groth E. J., 2002, ApJL, 572, L131
- (40) Reiprich, T. H., & Böhringer, H. 2002, ApJ 567, 716
- (41) Riess, A.G. et al. 2004, ApJ 607, 665
- Rhodes et al. (2004) Rhodes J., et al. 2004, ApJ, 605, 29
- (43) Roussel, H., Sadat, R. & Blanchard, A. 2000, A&A 361, 429
- (44) Ruhl, J. E., et al. 2003, ApJ 599, 786
- (45) Sadat, R., & Blanchard, A. 2001, A&A 371, 19
- Sadat et al. (2004) Sadat, R., et al. 2004, A&A, 424, 1097
- (47) Sadat, R. et al. 2005, A&A, submitted.
- (48) Seljak, U. 2002, MNRAS 337, 769
- (49) Seljak, U. et al. 2004, astro-ph/0407372
- (50) Sheth, R. K. & Tormen, G. 1999, MNRAS 308, 119
- (51) Spergel, D. N. et al. 2003, ApJS, 148, 175
- (52) Tegmark, M. et al., 2004, astro-ph/0310723, Phys. Rev. D 69, 103501
- (53) Tytler, D. et al., 2004, astro-ph/0403688
- (54) Van Waerbeke, L., Mellier, Y., Hoekstra, H. 2004, A&A, 393, 369
- (55) Vauclair, S. C., et al. 2003, A&A, 412, L37
- Viana, Nichol, & Liddle (2002) Viana, P. T. P., Nichol, R. C. & Liddle, A. R. 2002, ApJL 569, L75
- Viana et al. (2003) Viana, P. T. P., Kay, S. T., Liddle, A. R., Muanwong, O., & Thomas, P. A. 2003, MNRAS, 346, 319
- (58) Vikhlinin, A., Forman, W. & Jones, C. 1999, ApJ 525, 47
- (59) Voevodkin, A. & Vikhlinin, A. 2004, ApJ 601, 610
- (60) White, S.D.M., Navarro, J.F., Evrard, A.E. & Frenk, C. 1993, Nature 366, 429