11email: corrado@ll.iac.es, jeb@ll.iac.es, mpastor@ll.iac.es 22institutetext: Consejo Superior de Investigaciones Científicas, Spain 33institutetext: Dpto. de Física Teórica y del Cosmos, Facultad de Ciencias, U. de Granada, Avda. Fuentenueva s/n, 18071–Granada, Spain
33email: azurita@ugr.es
Propagation of ionizing radiation in H ii regions: the effects of optically thick density fluctuations
The accepted explanation of the observed dichotomy of two orders of magnitude between in situ measurements of electron density in H ii regions, derived from emission line ratios, and average measurements based on integrated emission measure, is the inhomogeneity of the ionized medium. This is expressed as a “filling factor”, the volume ratio of dense to tenuous gas, measured with values of order 10-3. Implicit in the filling factor model as normally used, is the assumption that the clumps of dense gas are optically thin to ionizing radiation. Here we explore implications of assuming the contrary: that the clumps are optically thick. A first consequence is the presence within H ii regions of a major fraction of neutral hydrogen. We estimate the mean H∘/H+ ratio for a population of H ii regions in the spiral galaxy NGC 1530 to be the order of 10, and support this inference using dynamical arguments. The optically thick clumpy models allow a significant fraction of the photons generated by the ionizing stars to escape from their H ii region. We show, by comparing model predictions with observations, that these models give an account at least as good as, and probably better than that of conventional models, of the radial surface brightness distribution and of selected spectral line diagnostics for physical conditions within H ii regions. These models explain how an H ii region can appear, from its line ratios, to be ionization bounded, yet permit a major fraction of its ionizing photons to escape.
Key Words.:
ISM: general – ISM: HII regions – ISM: clouds – Galaxies: ISM – Methods: numerical –1 Introduction: line emission diagnostics in H ii regions
Emission lines from different ionization states of the most abundant elements are one of the most valuable and practical tools for determining element abundances in galaxies. They are relatively easy to detect and quantify. The lines emitted by H ii regions are intrinsically bright and sharp compared with stellar absorption features, so easy enough to pick out and measure. If the electron temperature () within an H ii region can be determined, it is not too difficult to determine the overall abundance of a given element by measuring the relative emission line strengths of lines due to several ions. To estimate , the excited [O iii]4363Å line can be measured and its ratio with the 4959Å and 5007Å transitions to the ground state, yields a good value. This works well at intermediate metallicities (e.g. in the Magellanic clouds) but not at near solar metallicities, where the lower H ii region temperatures lead to a weak lambda 4363Å line, or at very low metallicities where all the O iii lines are weak. For local H ii regions can be determined well from radio recombination lines (see e.g. Shaver et al. 1983), but for H ii regions in Milky Way sized galaxies with near solar metallicities either detailed photo–ionization model fitting, or semi–empirical methods using bright lines are used. One of the most used of these methods involves a calibrated plot of [O ii]3727Å+[O iii]4959Å+5007Å normalized by the H emission line strength and plotted versus the oxygen abundance O/H, proposed by Pagel et al. (1979), and subject to a critical review by Vílchez (1988). This plot, and similar plots for N and S, can be used in conjunction with an estimate of the intrinsic radiation hardness from the ionizing stars: O+,O++, S+/S++ (Vílchez & Pagel 1988), to measure abundances and the abundance gradient across the face of a spiral galaxy. An interesting early summary of oxygen abundance gradients in spirals obtained using these principles can be found in Edmunds (1989).
As early as 1967 Peimbert pointed out that temperature fluctuations in H ii regions will cause temperature estimates made on the basis of forbidden line ratios to differ from those made via the ratio of Balmer lines to Balmer continuum, and as such will lead to imprecision in any physical parameter determination requiring electron temperatures, notably that of abundances. Rubin (1969), considered explicitly the effects of temperature fluctuations on abundance determinations, showing that for certain excitation conditions, neglect of these fluctuations will lead to underestimates of the abundances of elements such as oxygen and nitrogen. Rubin (1968), also explored the effects of density fluctuations, finding that the smaller and denser are the clumps of dense gas within a region, the higher the resulting effective electron temperature. He calculated models whose volume emissivities in H and [O iii]5007Å are affected by density and its fluctuation, but these were of the kind represented in the “filling factor” approximation which we will consider in some detail below, and as such are not an especially realistic representation of the density distribution within an H ii region. In practice, the effect of density fluctuations on the ionization equilibrium of a gaseous nebula has been considered essentially only as the cause of temperature fluctuations. This was clear in early work on the Orion Nebula by Osterbrock & Flather (1959) and in a subsequent more detailed examination of the same H ii region by Simpson (1973), was brought out in abundance determinations in the Magellanic Clouds by Dufour (1975), and also noticed by Krabbe & Copetti (2002) when considering the effect of the high density knots in 30 Doradus in slightly reducing the local electron temperature in apparent contradiction with Rubin (1968). In all of these studies, the underlying assumption is that there is a continuously varying amplitude spectrum of fluctuation size and density, although since the emission intensity of a recombination line scales as the square of the electron density, any diagnostic diagram will give the strongest weighting to the densest fluctuations. However, relatively little direct attention has been given to the effects of the density fluctuations themselves on the radiative transfer properties of an H ii region. Roy et al. (1989) attributed the variation of a number of line ratios on small scales within a number of large luminous extragalactic H ii regions, to small scale density variations within each region, but no direct attention has been paid to the possible effects of major density fluctuations on the overall energy budget of a region. In the present paper we address this problem, using a straightforward modelling technique to represent the presence of clumpiness within the regions. The clumps in the model show considerably more contrast with their surroundings than is assumed for a continuous density variation distribution, but the model has a density distribution much more like that empirically observed in the local neighbourhood (the only place where individual 1 pc scale clumps in the ISM can be separately detected and measured). These clumps are also in better physical accord with the two and three phase models of the ISM which have been proposed to explain its observed properties within the Galaxy (Cox & Smith 1974; McKee & Ostriker 1977).
In the following section we give an explanation of the model and its assumptions, and in subsequent sections we discuss the basic structure of the ionization distribution within the model. In Sect. 4 we compare the predictions of the generic radial surface brightness distribution of an individual region with the observationally derived distributions for H ii regions in external galaxies. Comparison of some predicted emission line ratios for this and previous models with observed line ratios, are discussed in Sect. 5, and finally, in Sect. 6 we analyze the important implications of this model for the observationally derived masses of gas within H ii regions. In the conclusions we bring out in what ways these clumpy models are qualitatively different from both the classical Strömgren model with homogeneous gas, and its derivatives obtained using the standard “filling factor” approach.
2 Inhomogeneities: the classical filling factor or optically thick clumps?
The possible effects of density inhomogeneities on the propagation of ionizing radiation in H ii regions were first discussed in some detail by Strömgren (1948). However the standard way to take into account the fact that the ISM is highly non–homogeneous on scales of parsecs is to scale the optical paths and the volume emissivity by a filling factor, following the initial prescription of Osterbrock & Flather (1959), which we will term here the FF approximation. The technique assigns a fraction of the total volume of an H ii region to relatively dense gas, with the remaining volume taken to be of negligible density. The fraction occupied by dense gas is termed the filling factor, and it takes values of order 10-3 in typical observed cases. The need to treat the volume of a region in this way is because the measurement of the in situ electron density using line ratios either at radio wavelengths (e.g. Dravskikh & Dravskikh 1990) or optical wavelengths (e.g. Copetti et al. 2000) gives values of order a few times 102 cm-3, whereas the mean electron density obtained from the emission measure in H is of order 1–2 cm-3 (Rozas et al. 1996). In the form introduced by Osterbrock & Flather (1959) and in general use for dealing with the transfer of Lyman photons in H ii regions, the underlying assumption is that the dense clumps are small enough to be optically thin, so that each clump is fully ionized. The overall effect is a statistical modification of the classical Strömgren sphere structure, in which radiation from the central ionizing stars ionizes material within a given radial distance from the stellar cluster and is effectively fully absorbed within the H ii region, except for the minority of cases where either the placental cloud is sufficiently small for some radiation to escape, or the cluster is formed eccentrically within the cloud, and thus near the cloud edge in one direction. Although the physical conditions for recombination line formation are biased towards the high densities, since these emission line strengths are proportional to the square of the electron density, and hence this model in which only the dense clumps are considered, gives many valid results, we believe that a better description of the transfer is given by using a medium with clumps whose optical depth is high. Rather interesting evidence for this is found within the local ISM where a detailed examination of structure is possible within a zone which lies within a major H ii region based on the OB associations towards Scorpio and Centaurus. Here Trapero et al. (1992, 1993) found that more than half the mass of the ISM within 300 pc of the Sun is in the form of dense ( 100 cm-3) compact clouds with characteristic sizes of order a few parsecs, while the remainder forms a warmer substrate with densities lower than 1 cm-3. Inspection of optical images of H ii regions within the Galaxy, e.g. the Orion Nebula, confirms this picture of ionized material in dense blobs or clumps several parsecs across, separated by larger volumes of less dense gas. In fact, this structure conforms to the rather clean separation into cool and warm phases first proposed by Field, Goldsmith & Habing (1969) and later extended to three phase models which include a hot component by Cox & Smith (1974) and by McKee & Ostriker (1977). A particularly clear theoretical underpinning of these multi phase models is given in the classical text by Spitzer (1978), who explains in terms of detailed balance, why certain ranges of density and temperature in the ISM are unstable, and how this leads to a geometrical differentiation of the stable phases. The transfer properties of an H ii region with a clumpy structure in which there is a clear phase separation, with correspondingly large well defined clumps are significantly different from those of a traditionally modelled clumpy region where the structure is not scaled, and it is this difference which we explore here. We will term the traditional model the FF model, and our model the “clumpy” model, since the density and volume contrasts in our model are greater. The clumps in our model, and in the H ii regions themselves, are optically thick to the Lyman continuum (Lyc) and this has significant effects, e.g. implies that the Strömgren sphere approximation loses validity, and that traditional diagnostics for photon escape such as those applied in McCall, Rybski & Shields (1985) must be re-quantified.
To give an analytical first order approach which is easy to follow we first take our clumps to be uniform spheres, with a characteristic size and a cross–section for radiation interception . A clump situated at a distance from the centre of a (spherically symmetric) region intercepts a fraction of the ionizing radiation, and for a number density of clumps , the clumps in a shell of thickness between and from the centre, intercept a fraction of the radiation i.e. . We term this fraction , which represents the probability that a photon is absorbed within this shell, i.e. the fraction of photons absorbed within the shell. With the simplifying assumption that the number density of clumps is not so large that there is a significant probability that a ray from the centre of the region cuts more than one clump on its path to the surface, the probability for a photon to escape from the region is given by
| (1) |
where is the total number of shells. We are particularly interested in the production of H by recombination in a process which can be considered as a down-conversion of Lyc photons, terming the intensity of H emission by the ’th shell from the centre as . We can formulate this in terms of the intensity, , which would be produced within a filled shell which has a thickness , multiplied by the fraction of the shell which absorbs photons, i.e. the fractional area occupied by dense clumps, giving
| (2) |
Both equations, 1 and 2, use a thin spherical shell approximation, which will not be valid near the centre of the region, but in any case, if is small the contribution of that shell to the total emission can be neglected, not only for simple geometrical reasons, but because in the innermost few parsecs the clumps will be dissipated by a combination of stellar winds and radiation. For simplicity we will set the shell thickness as the size of a single clump, and we can thus neglect the innermost shell in any calculations. The fractional error in doing this for a shell where the clumps were not dissipated would be just , (and we will see that this ranges from 0.001 to 0.01 so this would be no problem) but in practice the error will be smaller than . Even if our computation were incorrect for the first three or four shells, the error implied would be small. In particular, if the clumps in the second shell were either dissipated or fully ionized, our error would again be of order , and this problem will not be important, even in regions with the most luminous ionizing stars, for shells beyond the third or at most the fourth, for clumps of scale size pc.
It is instructive to use the spherical clump approximation to derive some quantitative relations associated with the filling factor, i.e. the fractional volume occupied by dense gas. For spherical clumps of radius , for which is we find
| (3) |
and setting the shell thickness delta to be the clump diameter () we obtain
| (4) |
where is the volume of a clump. Let us define a geometrical filling factor as the fraction of the total volume of the H ii region occupied by the clumps and so we find
| (5) |
and if we put we have
| (6) |
It is important to be explicit here about the method normally used to infer filling factors of dense gas in H ii regions. Following Osterbrock (1989, p. 153), the luminosity L emitted by an H ii region whose dense clumps have a total volume and electron density , in a given spectral line is
| (7) |
where is a constant which depends only on which emission line is being observed, and not (to first order) on the physical conditions. If we assume that we are dealing with an H ii region whose total volume is , then the ratio is the filling factor, so we can express Eq. 7 as
| (8) |
which for the case of H enables us in principle to determine the filling factor using
| (9) |
where is the radius of the H ii region, and the constant takes the value appropriate for the H emission line. We note especially that in an FF model the two filling factors, and are equal, since all clumps are fully ionized, but in the present clumpy model this is not the case. We will see that in general since most clumps are not fully ionized, and the difference between these quantities can be easily an order of magnitude. In addition, deriving using an integrated emission line luminosity and Eq. 9 implies obtaining a reliable value for the radius of the H ii region, which is not the most accurate of observations because the projected surface brightness of a region blends into the diffuse background, so that any measurement which relies on establishing a clear boundary entails errors. We will discuss these points further, later in the paper.
3 Calculations using FF and clumpy models
In order to illustrate both qualitatively and quantitatively the differences which arise using the two types of models we have generated specific models to compute line strengths and ratios under defined conditions. All these models rely on the CLOUDY suite of programs (see Ferland et al. 1998). For the FF models we have used CLOUDY in a standard way. We have generated a tree family of models of different metallicity with a set of stars: 3, 10, and 30 O3 stars at the centre, a mean gas density of 100 cm-3 and filling factors of 10-3, 10-4, values designed to match the optical filling factors obtained observationally (e.g. Rozas et al. 1996). The outer radius of the region is a parameter which can be varied, so that if we start with low values and progress to high values we go from a density bounded to an ionization bounded regime. We used essentially solar metallicities, as specified in the manual of CLOUDY, and for the purpose of streamlining the calculation we simulated an O3 star by a black body with a temperature of 51230 K, and an ionizing flux 1039.31erg s-1 (Vacca et al. 1996).
Since the clumpy models are based on clumps of denser gas whose properties: size and gas number density, are defined as inputs, we first made a set of simple tests in which a clump of radius 1 pc and density 100 cm-3 was illuminated by an ionizing source at different distances. The source was given an ionizing luminosity of 1052.5 photons s-1 which corresponds to almost 300 O3. This is a very luminous source, so that our conclusions about the ionized fractions of the clumps at varying distances from the source are conservative. We can see the result of this test in Fig. 1, where the fractional volume ionized, seen in cross–section, and the degree of ionization, are shown as functions of the distance of the clump from the source.
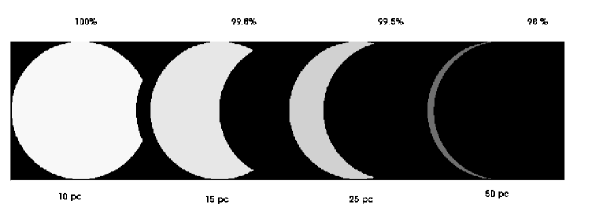
It is obvious at a glance that at distances further from the source than some 10 pc, a clump is essentially opaque to the ionizing radiation, and in terms of simple transfer can be virtually considered a black disc. However with the filling factors found observationally, the net effect of a clumpy region where the gas is concentrated into these clumps will be to act as a “radiation sieve” allowing a major fraction of the ionizing photons to pass between the clumps and escape. It is also clear that at distances beyond some 20 pc from the source the major fraction of a clump is shielded and left unionized. Depending on the details of the distribution of the clumps within the H ii region, the net effect of integrating unionized and ionized clump masses will be that a relatively small fraction of all the clump mass in the H ii region will be ionized. It is this fraction which is detected as the “optical” filling factor. A useful canonical estimate of the ratio of neutral to ionized gas in an H ii region of radius 150 pc, i.e. one of the ultraluminous “giant” H ii regions, is a factor 10, as we will show empirically in section 6 below, so that in our clumpy models we use a “geometrical” filling factor of 10-2, 10-3 (including both H∘ and H+) which in broad terms corresponds to an optical filling factor of 10-3,10-4 (including H+ only).
In the computations made using the clumpy models we have used the formalism implied in Eq. 2 in conjunction with the CLOUDY program of continuum and line transfer (Ferland et al. 1998).
4 Differences in the radial distributions of ionizing and recombination photons between the FF and clumpy models
A key qualitative difference between FF models and clumpy models is the prediction of the fraction of ionizing photons which escape from an H ii region. In an FF model, as in a classical Strömgren uniform model, there is a clear distinction between density bounding and ionization bounding, which depends only on the mean gas density and the modelled radius of the region. In slightly simplified terms once a region reaches a specified size for its density distribution it will be ionization bounded, so no photons escape, while for smaller radii it will be density bounded. In a clumpy model this clear distinction is not maintained, since a fraction of ionizing photons escapes from essentially all clumpy models with reasonable physical parameters, and the only question is to quantify that fraction (Eq. 1). In other words, all regions modelled using a clumpy model will be, de facto, density bounded. However, in each individual clump (except for the minority of clumps close to the ionizing source) all photons incident on the clump are absorbed. Thus the emission line ratios for lines produced by down-conversion within the clump will be those for ionization bounded regions, and as essentially all the line emission from within a region comes from the clumps, any diagnostic diagram using line ratios will give an ionization bounded signature. In other words clumpy H ii regions will always be diagnosed as ionization bounded, although in terms of photon escape they behave as density bounded. An illustration of these different types of behaviour is given in Fig. 2 where we have plotted escape fraction against H ii region radius for three FF models and three clumpy models.

The difference is clear. The FF models show behaviour akin to that of a classical Strömgren sphere. The fraction of photons escaping falls quite sharply as the radius of the H ii region reaches a critical value, which depends on the luminosity of the ionizing stars and the mean density of the gas (in the models illustrated here this latter parameter was maintained constant so the effect is not seen). The clumpy models, labeled with C, show quite different behaviour, which is essentially geometrically dominated. The escape fraction for an H ii region for a given source luminosity falls off steadily as the radius of the region rises, but there is no cut–off radius, as the fall–off is determined basically by the geometrical cover factor of the clumps, each of which is optically thick. In fact the plots for these models slightly underestimate the escape factor, as they have assumed no overlapping between clump cross sections for photon blocking.
As a direct observational test of the differences in the predictions of FF and clumpy models we have looked at radial profiles in surface brightness of H ii regions (Rozas et al. 1998), a test which makes best use of the spherical symmetry incorporated into our simplest clumpy models. We selected one of the largest isolated H ii regions with large radii in the galaxy NGC 1530 for which we had continuum subtracted H images with good signal to noise ratio, measured its radial surface brightness profile in H, and from this profile derived the distribution of volume emissivity in H as a function of radius within the region. The radial plot of this contribution function is shown in Fig. 3. In the same figure we give the predictions of four models, for which the luminosity of the central source was scaled to yield the observed H luminosity, to a first approximation: two FF models with different assumed filling factors and two clumpy models also with different geometrical filling factors. It is clear from the figure that the FF models give contribution functions which do not fit those of the observed regions. Although the radial profiles of these models differ depending on the filling factor, they have in common a convex form, with a rather sharp fall off towards the edge of the region. The clumpy models, on the other hand, show convex profiles, and give far better agreement with those derived from the observations. The H volume emissivity for a uniform Strömgren sphere is included for comparison.

5 Predictions of line strengths and ratios: diagnostic diagrams for density bounding
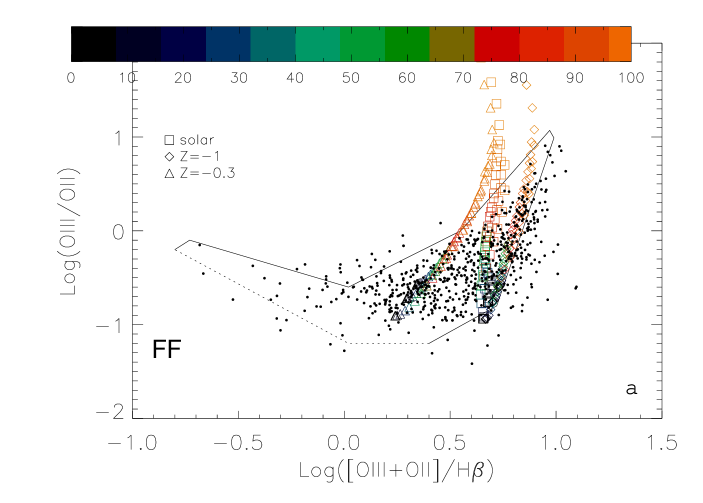
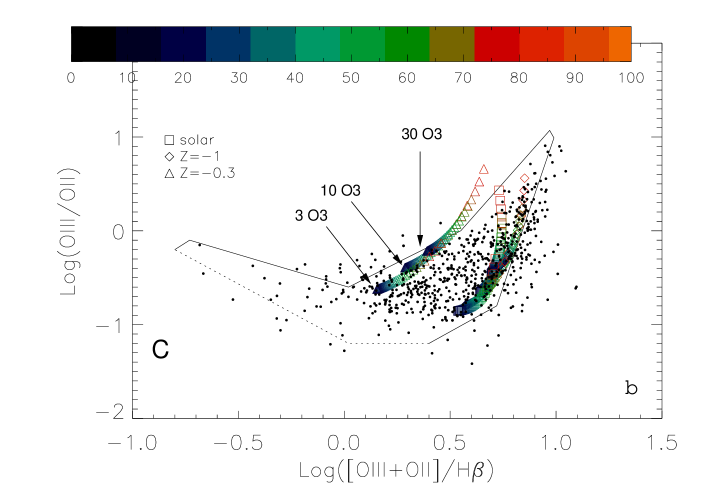
A classical test for density bounding in H ii regions is the plot of [O iii]/[O ii] vs. ([O iii]+[O ii])/H, proposed by McCall et al. (1985). Examination of this plot for a set of extragalactic H ii regions, led them conclude that most H ii regions are ionization bounded. Other authors (Roy & Walsh 1997; Kennicutt et al. 2000) have reached the same conclusion based on similar analysis. However, there is good evidence (Ferguson et al. 1996; Zurita et al. 2000; Relaño et al. 2002) that a major fraction, of order half, of the ionizing photons are escaping from the H ii regions of external galaxies, and ionizing their diffuse interstellar media. This evidence is based on two types of measurements. Firstly the integrated diffuse H measured over the full face of a galaxy is found to depend linearly on the integrated H luminosity of the most luminous H ii regions (above a specified lower limit in H luminosity) in that galaxy (Beckman & Zurita 2004), suggesting very strongly that escaping Lyman continuum photons from the H ii regions are responsible for ionizing the diffuse medium, and by inference are escaping from the H ii regions themselves. Secondly a careful model of a specific galaxy (NGC 157) in which all the H ii regions, with measured H luminosities and positions were taken as sources of ionizing photons, which were allowed to propagate across the galaxy, gave excellent agreement between the modelled geometrical distribution of the diffuse H emission from the whole galaxy and the observed distribution (Zurita et al. 2002). The fraction of photons which need to escape is at least 30% of those emitted by the OB stars within the regions. We have predicted some of the line ratios previously used for density bounding diagnostics using our clumpy models and compared these predictions with those of the classical FF models. In Fig. 5 we show the large data set presented by several authors (including McCall et al. 1985) in the ([O iii]/[O ii])–(([O iii]+[O ii])/H) parameter space, together with the predictions of the FF (5a) and clumpy (5b) models for different metallicities. We can see that in both cases, the observations can be reproduced by models with strong ionizing photon leakage (indicated by color scale) and models with negligible escape of ionizing photons. We can also infer two types of conclusions from this comparison. Firstly, when we inspect in detail the comparisons between models and observations, the clumpy models do give a significantly improved account of the observations, and secondly the use of [O iii]/[O ii] as a test for density bounding is not valid in either type of models. The model grids, notably for the clumpy models, overlap with, and reproduce the global distribution of the measurements. It is still true, as predicted from previous types of models, that a higher [O iii]/[O ii] ratio tends to indicate a higher escape fraction of ionizing photons from a region, but the degree of ambiguity about this prediction for a given example is very high, given the error bars on a given measurement, for which the reader is referred to McCall et al. (1985). This last conclusion is in good agreement with Iglesias–Páramo & Muñoz–Tuñón (2002), who proposed an alternative diagnostic based on the line strengths of [O i]6300Å and [O ii]3727Å.
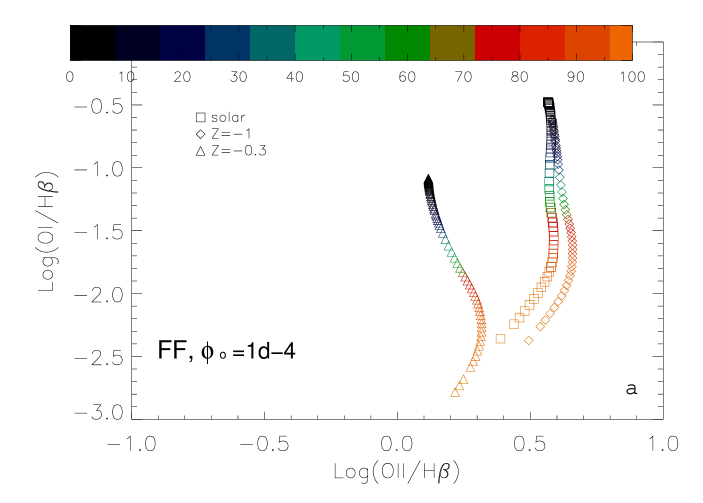
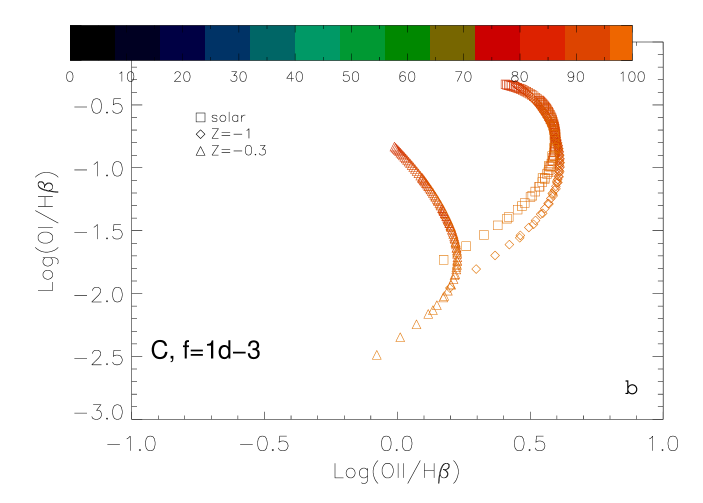
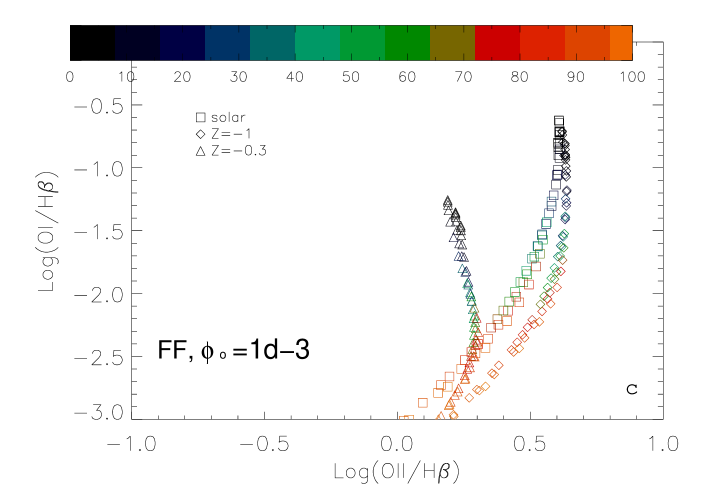
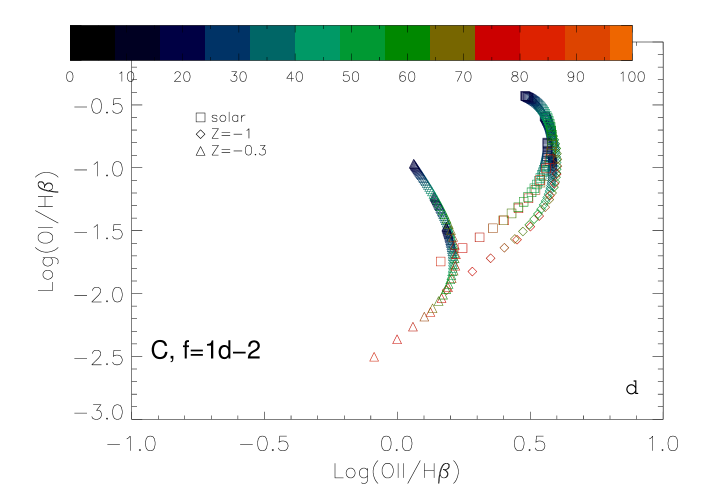
In Fig. 5, we compare the different predictions of clumpy (5a and 5c) and FF (5b and 5d) models for the [O i] diagnostic diagram. Different values of absorption fraction per shell (10-2 and the extreme value 10-3) and optical filling factor (=10-3, and the extreme value 10-4) have been used in the clumpy and FF models respectively. Figs. 5a and c clearly show that FF models with low escape fraction (dark points) occupy the same area of the plot independently of the filling factor adopted. This means that if H ii regions were well described by FF models, this representation would be valid for density bounding diagnostics. However, clumpy models with high escape fraction in Fig. 5b, occupy the same parameter space as the clumpy models with low escape fraction in Fig. 5d. Therefore, before using these diagrams, we need to make assumptions about the parameter . In order to understand this behaviour, we show in Fig. 6, the predicted [O i]6300Å/H line ratio as a function of H ii region radius, again comparing the clumpy models (6b) with “standard” FF models (6a). It is a general feature of all the models that as the radius of the H ii region increases the ratio rises, but for two different reasons: in the FF case, there is a rapid rise to an asymptotic value, because as the ionizing photons are increasingly absorbed within the region, the fraction of hydrogen which remains in neutral state rises, and therefore the [O i] emission, induced by a charge-exchange reaction. However the clumpy models tell a different story. Here there is no clear transition in the line intensity ratio because there is no clean transition in the physical properties of the regions; in other words, each clump in which emission lines are formed and emitted is ionization bounded itself. The distance of the clumps from the ionizing sources determine different ionizing parameters, i.e. different values of the [O i]6300Å/H line ratio which average in a complex way giving rise to the behaviour shown in Fig. 6b. We conclude here that the distribution of data in McCall et al’s plot is compatible with density bounding, as density and ionization bounded models, for both clumpy and FF, are in the same region of the plot. We have some reason to prefer clumps as for dynamical reasons (see next section), there does appear to be a high proportion of H i within large H ii regions. However to decide definitively which is the best way to model H ii regions, we need to take into account other diagnostic diagrams which will be the topic of a forthcoming paper (Giammanco et al. 2004).

a.
 b.
b.
6 Gas masses in H ii regions
It is very difficult to estimate the amount of neutral hydrogen within an H ii region, because of the need to separate the contributions of hydrogen clouds along the line of sight to the object (and even beyond it) from the 21 cm emission from the specific volume of hydrogen we wish to identify. This difficulty is serious even using Doppler techniques to try to isolate the emission from the region under study. For H ii regions in external galaxies the velocity does give us a better discriminator, but here angular resolution limits our ability to define the H i content (and also the possible H2 content) of even a large luminous H ii region. However there have been a few attempts to supplement direct measurements by indirect estimates of the neutral gas mass within an H ii region using dynamical arguments. Yang et al. (1996) estimated that in order for the basic emission line width (the width unaffected by locally expanding material, and which required careful two dimensional spectroscopy to pick out) of H from the region NGC 604 in M33 to be consistent with a system in virial equilibrium, the neutral gas mass had to be an order of magnitude higher than their observed mass of ionized gas. They supported their argument using an observational HI mass estimate by Deul & van der Hulst (1987), and an observational estimate of the H2 mass by Viallefond et al. (1992), and they themselves showed that the total stellar mass is not a major fraction of the total mass of the region. A similar though less clear cut argument was produced by Chu & Kennicutt (1994) for 30 Doradus. Comparing emission line widths from many features across this huge, nearby, and luminous H ii region with mass estimates based on the virial theorem, they found that even an order of magnitude more H i than H ii would not yield virial equilibrium, relating the discrepancy to dynamical energy inputs from the hot stars and supernova remnants. However in this case there are no corresponding literature estimates of the neutral gas (atomic or molecular ) with which to compare. It is clear from the above articles that if we assumed that the observational estimates of the ionized gas gave us the complete gas mass, i.e. that there is little or no neutral mass within the H ii regions, we would put the regions way out of equilibrium. It is less clear, however that they are in fact in equilibrium generally, though locally perturbed by stellar energy inputs. This however, was the basic result of the very detailed study by Yang et al. (1996) for NGC 604.
In this context we see that we could use our clumpy models to estimate neutral gas masses in H ii regions purely on the basis of ionization equilibrium, once the basic postulates about the clump properties had been laid down. The calculation is straightforward. Our model allows us to estimate the fraction of a clump which is ionized at any chosen distance from the ionizing source, so once we know, or assume, the distribution of clumps within the region as a whole we can compute the neutral gas fraction. The results of calculations of this type for a set of observed H ii regions in the barred spiral NGC 1530 are shown in Fig. 7. The results shown are based on the specific assumption that a constant fraction of 30% of the ionizing radiation from the stellar sources escapes from all the H ii regions, but the qualitative result would not change if we used a different basis for the computation (for example increasing this escape factor to 50% in fact decreases the neutral/ionized gas mass ratio less then factor 2). The graph shows the ratio of true clump filling factor, , which is the fractional volume of an H ii region occupied by dense gas clumps, to the optical filling factor , which is the fraction occupied by the ionized portions of the gas clumps. We can see from Fig. 7 that ratios of an order of magnitude between the neutral gas and ionized gas masses are indicated in these models, as a natural consequence of the clumpy nature of the medium. This gives a firmer basis for the use of this factor in making the calculation of the gas mass in NGC 604, and implies that a virial equilibrium solution for the line widths observed by Yang et al. makes good physical sense. In a forthcoming paper (Relaño et al. 2004, A&A, submitted) we will present a general study of the topic of the internal kinematics of H ii regions based on observations of complete populations of regions in the discs of spiral galaxies, in which one of our conclusions is that the widths, of the integrated H emission from the majority of the H ii regions observed in external galaxies are broader than those expected for systems in virial equilibrium, but that the lower limiting envelope in sigma for the whole population, plotted in a diagram of v. H luminosity, represents a locus of regions which are virialized.Were it not for the major contribution of the neutral gas in the clumps the regions would all appear to be gravitationally unbound.

We can thus conclude, at least tentatively, that measurements of the internal dynamics of H ii regions, supplemented by direct estimates of H i in the few cases where this is possible, give good support to the use of our clumpy models to interpret the emission parameters. This support is quantifiable in terms of the fractional estimates of neutral gas mass obtained dynamically compared with the fractional estimates based on clumpy models with reasonable radiative parameters. Lastly it is relevant to point out that Relaño et al. (2004) have shown that the stellar mass cannot make up more than a few percent of the total H ii region mass for these luminous regions, and so does not materially affect the dynamical balance of a region.
7 Conclusions
The aim of this paper has been to offer an initial alternative version to the conventional inhomogeneous models for H ii regions. The classical filling factor approximation assumes that the denser clumps are optically thin, and this gives rise to a statistically modified Strömgren sphere with a well defined boundary in ionization bounded conditions. The use of an optically thick approximation gives some substantially different predictions. We have shown in particular, the differences implied in the diagnostic diagram of [O iii]/[O ii] v. ([O iii]+[O ii])/H, a diagram used, inter alia, for separating regions which are ionization bounded from those which are density bounded. The optically thick clumpy model gives predictions in rather better agreement with the observed data than the traditional filling factor models, but more critically, we show that in neither model is the separation of the two conditions (ionization and density bounding) very clean, and in the “clumpy” model there is complete overlap, rendering the diagram ineffective as a diagnostic. We apply the same exercise to the more recently suggested [O i]/H v. [O ii]/H diagram, showing that in this case the diagnostic would function adequately for the traditional models, but for the optically thick clumpy models the results would be ambiguous. The models described here, though still geometrically quite schematic, do appear to give an improved account of the radial profiles of H ii regions in surface brightness. They also predict as a natural consequence that H ii regions should contain a majority fraction of H i, and this prediction seems to be borne out by observations of the internal dynamics of H ii regions.
Acknowledgements.
Thanks are owed to Tom Abel for scientific discussions on radiative transfer in diffuse media. We also thank the referee, Manuel Peimbert for helpfull suggestions which helped us to improve the article. This work was supported by the Spanish DGES (Dirección General de Enseñanza Superior) via Grants PB91-0525, PB94-1107 and PB97-0219 and by the Ministry of Science and Technology via grant AYA2001-0435. A. Z. acknowledges support from the Consejería de Educación y Ciencia de la Junta de Andalucía, Spain. A. Z. and C. G. acknowledge support from the Isaac Newton Group (ING) during the preparation of this article. The JKT is operated on the island of La Palma by the ING in the Spanish Observatorio del Roque de los Muchachos of the Instituto de Astrofísica de Canarias.References
- (1) Beckman, J. E., & Zurita A. 2004, in “How does the Galaxy work”, eds. E. Alfaro, D. Cox, R. Reynolds (in press)
- (2) Cedrés, B., & Cepa, J. 2002, A&A, 391, 809
- (3) Chu, Y. H., & Kennicutt, R. 1994, ApJ, 423, 720
- (4) Copetti, M. V. F., Mallmann, J. A. H., Schmidt, A. A., Castañeda, H. O. 2000, A&A, 357, 62
- (5) Cox, D., & Smith, B. W. 1974, ApJL, 189, 105
- (6) Deul, E. R., & van der Hulst, J.M. 1987, A&AS, 67, 509
- (7) Dufour, R. 1975, ApJ, 195, 315
- (8) Dravskikh, A. F. & Dravskikh, Z. H. 1990, Proc. IAU Colloquium 125, eds. Gordon & Sorochenko, Kluwer, p. 115
- (9) Edmunds, M. G. 1989, in ”Evolutionary Phenomena in Galaxies (Eds. Pagel, & Beckman), C.U.P., p. 356
- Ferguson, Wyse, Gallagher, & Hunter (1996) Ferguson, A. M. N., Wyse, R. F. G., Gallagher, J. S., & Hunter, D. A. 1996, AJ, 111, 2265
- (11) Ferland, G. J., Korista, K. T., Verner, D. A., Ferguson, J. W., Kingdon, J. B. & Verner, E. M. 1998, PASP, 110, 761
- (12) Field, G. B., Goldsmith, D. W., & Habing H. J. 1969, ApJL, 155, 149
- Iglesias-Páramo & Muñoz-Tuñón (2002) Iglesias-Páramo, J. & Muñoz-Tuñón, C. 2002, MNRAS, 336, 33
- (14) Kennicutt, R. C. Jr., Bresolin, F., French, H., & Martin, P. 2000, ApJ, 537, 589
- (15) Kennicutt, R. C. Jr., & Garnett, D. R. 1996, ApJ, 456, 504
- (16) Krabbe A. C., & Copetti M. V. F. 2002, A&A, 387, 295
- (17) McKee C. F, & Ostriker, J. P. 1977, ApJ, 218, 148
- (18) McCall, M. L., Rybski, & P. M., Shields, G. A. 1985, ApJS, 57, 1
- (19) Osterbrock,D. E. 1989, Astrophysics of Gaseous Nebulae and Active Galactic Nuclei, (Mill Valley, University Science Books)
- (20) Osterbrock D. E., & Flather E. 1959, ApJ, 129, 260
- (21) Pagel B. E. J., Edmunds, M. G., Blackwell D. E., Chun M. S., & Smith G. 1979 MNRAS, 189, 95
- (22) Peimbert, M. 1967, ApJ, 150, 805
- Relaño, Peimbert, & Beckman (2002) Relaño, M., Peimbert, M., & Beckman, J. E. 2002, ApJ, 564, 704
- (24) Relaño, M., Beckman, J. E., Zurita, A., Rozas, M., & Giammanco, C. 2004, A&A, submitted
- Roy, Belley, & Walsh (1989) Roy, J. R., Belley, J., & Walsh, J. R. 1989, AJ, 97, 1010
- (26) Roy, J. R. & Walsh, J. R. 1997, MNRAS, 288, 715
- (27) Rozas, R., Knapen, J. H., & Beckman, J. E. 1996, A&A, 312, 275
- (28) Rozas, R., Castañeda, H. O., & Beckman, J. E. 1998, A&A, 330, 873
- (29) Rubin, R. 1968, ApJ, 153, 761
- (30) Rubin, R. 1969, ApJ, 155, 841
- (31) Shaver, P. A., McGee, R. X., Newton, L. M., Danks, A.C., & Pottasch, S.R. 1983, MNRAS 204, 53
- (32) Simpson, J.P. 1973, PASP, 85, 479
- (33) Spitzer, L. 1978, Physical Processes in the Interstellar Medium (Wiley, Interscience)
- (34) Strömgren, B. 1948, ApJ, 108, 242
- (35) Trapero, J., Beckman, J. E., Génova, R., & McKeith, C. D. 1992, ApJ, 394, 552
- (36) Trapero, J., Beckman, J. E.; Génova, R., McKeith, C. D., & Lundström, I. 1993, in Back to the Galaxy, eds. S. Hold, & F. Verter, Proc. AIP, 273, 182
- Vacca, Garmany, & Shull (1996) Vacca, W. D., Garmany, C. D., & Shull, J. M. 1996, ApJ, 460, 914
- (38) van Zee, L., Salzer, J. J., Haynes, M. .P., O’Donoghue, A. A. & Balonek, T. J. 1998, AJ, 116, 2805
- (39) Viallefond, F., Boulanger, F., Cox, P., Leqeuex, J., Pérault, M., & Vogel, S. N., 1992, A&A, 265, 437
- (40) Vílchez, J. M. 1988, Ph.D. Thesis, Universidad de La Laguna
- (41) Vílchez, J. M., & Pagel, B. E. J. 1988, MNRAS, 231, 257
- (42) Walsh, J. R., & Roy, J. R. 1997, MNRAS, 288, 726
- (43) Yang, H., Chu, Y. H., Skillman, E. D., & Terlevich, R. 1996, AJ, 112, 146
- Zurita, Rozas, & Beckman (2000) Zurita, A., Rozas, M., & Beckman, J. E. 2000, A&A 363, 9
- (45) Zurita, A., Beckman, J. E., Rozas, M., & Ryder, S. 2002, A&A, 386, 801