Spectral Properties of Brown Dwarfs and Hot Jupiters 11institutetext: Department of Physics & Astronomy, University of Georgia, Athens, GA 30602-2451, USA; derek@physast.uga.edu 22institutetext: Centre de Recherche Astronomique de Lyon, École Normale Supérieure, 69634 Lyon Cedex 07, France 33institutetext: Hamburger Sternwarte, Universität Hamburg, 21029 Hamburg, Germany 44institutetext: Department of Physics, Wichita State University, Wichita, KS 67260-0032, USA 55institutetext: Dept. of Physics & Astronomy, University of Oklahoma, Norman, OK 73019, USA
Spectral Properties of Brown Dwarfs
and Hot Jupiters
Abstract
Brown dwarfs bridge the gap between the stellar and planetary mass regimes. Evolving from conditions very similar to the lowest-mass stars, the atmospheres of older brown dwarfs closely resemble those expected in close-in extrasolar giant planets, and with cooler BDs still being discovered, more and more approach the properties of gas giants at wider separation. Interpreting the spectra of BDs is therefore a crucial step towards understanding and predicting the spectral and thermal properties of EGPs.
Essential properties of substellar atmospheres are massive molecular line-blanketing and the condensation of species with decreasing , changing the chemical equilibrium composition and causing absorption from dust grains. More complex details involve the distribution of dust clouds over the surface giving rise to temporal variability, and possible deviations from chemical equilibrium conditions. In the case of close-in EGPs and some BDs in binary systems, the effect of irradiation from the primary significantly affects the spectral properties and thermal evolution.
1 Introduction
Observational efforts during the past decade have brought marked progress in characterising the lower end of the Main Sequence down to and beyond the hydrogen-burning limit, and identifying a class of unambiguously substellar objects. Brown dwarfs (BDs) are commonly defined as compact objects with a mass below the minimum for sustaining equilibrium hydrogen fusion (). Since the detection of the first bona-fide BDs reboloPleiade ; nakaGl229B ; broGl229B and the discovery of a Jupiter-mass companion to 51 Peg by Mayor & Queloz mayor51Peg , the field of substellar astronomy has seen the direct detection of more than 300 ultracool dwarfs and the indirect detection of 110 planetary mass objects in orbit around other stars. While there is no agreement yet whether brown dwarfs should be distinguished from extrasolar giant planets (EGPs) based on their formation history, or by defining the minimum mass for deuterium burning () as the lower limit of the BD mass range, in terms of atmospheric properties and spectroscopic appearance there is a smooth transition, and some overlap, between both classes of objects, regardless of definition.
The spectroscopic characterisation of these sources of 2200 K 700 K has prompted the introduction of the two new spectral classes L and T. While the original description of the L sequence was based on optical spectral properties mbdfLdwarf97 ; krlLdwarf99 , the definition of a classification scheme for the latest L-type and the T dwarfs has required the use of near-IR spectra, owing to the fact that the lion’s share of emitted flux and of spectroscopic characteristics in these objects is found at μm geb02 ; adam02a .
While the youngest / most massive brown dwarfs jointly populate the early L (and late M) classes together with the least massive hydrogen-burning (very low mass-, or VLM-) stars, more evolved brown dwarfs of late-L type have effective temperatures similar to those of the EGPs closest-in to their primary star (“Hot Jupiters”, e. g. 51 Peg, HD 209458 evolPlanets ). The coolest T dwarfs detected to date tomgGl570 ; 2MASS04pap exhibit atmospheric properties close to those anticipated in EGPs at larger separation, and thus are crucial test cases for our understanding of planetary atmospheres.
The spectral appearance of substellar objects, proceeding from the lowest-mass main-sequence stars to lower effective temperatures is mainly characterised by the onset of condensate formation in the latest M dwarfs, leading to strongly dust-dominated atmospheres of early L-types with very red -colours. From mid-L to early T-types this trend is reversed with a decreasing signature of dust, strengthening of water vapour absorption and the appearance of methane. The strongest CH4 bands at 3.3 and 2.2 μm have been observed in dwarfs as early as L5 2000ApJ…541L..75N . The L/T transition is thus now defined by the first appearance of the weaker band at 1.6 μm geb02 ; adam02a . While the near-IR spectra of T dwarfs are turning blue again with decreasing , caused by the deepening molecular bands and collision-induced absorption (CIA) of H2 in the -band, their optical-infrared colours become extremely red due to the massively pressure-broadened resonance lines of Na I and K I.
Chemical interaction, the complex spectra of molecules, the physics of dust formation and the treatment of line broadening in high density conditions make spectral modelling of brown dwarfs and giant planets a challenging task. With advancements in computational techniques and availability of better chemical and physical input data over the years, models of the atmospheres and interiors, 1993ApJ…406..158B ; faphh95 ; tsujiDust96 ; evolDust have been able to keep up with observational progress in their ability to describe the global properties of brown dwarfs. In this review, we present an introduction into dwarf atmosphere modelling with the PHOENIX code in Sect. 2, followed by an overview of the current status of models and recent developments in Sect. 3. We discuss the special case of modelling the irradiated atmospheres of close-in extrasolar giant planets in Sect. 4 and discuss the outlook to possible direct observations of EGPs.
2 The PHOENIX Code
PHOENIX (see hbjcam99 and references therein) is a general stellar model atmosphere code for treating both static and moving atmospheres, designed to be both general enough to allow essentially all astrophysical objects to be modeled with a single code, and to make as few approximations as possible. Successful applications of the PHOENIX code include models of Novae, all types of Supernovae blhSNIa03 and Hot Stars deneb . Compared to these cases cool stars and brown dwarfs are in many respects simpler instances of the classical stellar atmosphere problem, i. e. the photospheres can be considered as plane parallel and the assumptions of hydrostatic equilibrium, local thermodynamical equilibrium (LTE) and flux conservation at each level hold to a high degree. Complications arise from the need to treat convection into optically thin layers, highly non-grey opacities that cause extreme deviations of the radiation field from that of a blackbody, and the prevalence of molecules at low temperatures.
2.1 Atmospheric Structure and Chemistry
Molecules first appear at temperatures of about 5 000 K, and dominate the conditions in M dwarfs, locking up hydrogen and most of the metals. This dramatically increases the complexity of the equation of state (EOS) as chemical interactions of hundreds of species have to be considered simultaneously. The PHOENIX code currently solves for the chemical equilibrium (hereafter CE) partial pressures of 40 elements with usually 2 to 6 ionization stages each, over 600 molecular species faphh95 ; LimDust , and over 1000 liquids and crystals from a study by Sharp & Huebner Sharp+Huebner90 . Thermodynamic equilibrium models, however, can only describe the conditions, under which condensates may be formed, but not the actual nucleation rate and growth of grains. Therefore, two limiting cases for the presence of dust in the photosphere have been described by Allard et al. LimDust , referred to as AMES-Dusty and AMES-Cond. While in both cases dust is assumed to have formed wherever it can under CE, removing refractory elements from the gas phase, the former models consider all grains to remain at the place where they formed, while the latter assume that dust will completely settle to deeper layers and does not contribute to the opacity at all.
2.2 Opacities
With the electronic, vibrational and rotational transitions of molecules being orders of magnitude more complex than atomic line spectra, the handling of up to several line opacities poses a computational problem of its own. The input data size is illustrated by a breakdown of lines in our opacity database:
-
•
number of atomic/ionic spectral lines: GB
-
•
number of diatomic molecular lines (other than TiO): GB
-
•
number of TiO lines (1999): GB
-
•
number of hot water vapour lines – before 1994: – 1994: GB – 1997: GB – 2001: GB -
•
total molecular lines (Oct 2001): GB
Line blanketing is treated with the direct opacity sampling method, by dynamically creating sub-lists of all transitions contributing to the opacity for the conditions of a given model, and calculating depth dependent Gauss (weak lines) or Voigt (strong lines) profiles jcam . For important resonance lines, such as the strongly broadened alkali D1/D2 lines, special damping profiles Alkalis03 are used.

For models where dust opacity is considered (AMES-Dusty), extinction from 31 grain species are currently included, with absorption and scattering cross-sections calculated using the Mie formalism applied to spherical grains draAtmos . Figure 1 shows the combined extinction from all dust species included in our EOS, which provide an essentially continuous opacity, though several pronounced features exist in the mid-IR, due to e. g. the absorption peaks of silicates and corundum (Al2O3). An uncertain factor in these calculations is the size of the grains, about which only little is known for the conditions of dense stellar atmospheres. For lack of a better model, a power-law distribution is frequently assumed, adopting an ISM model of for grain diameters 6.25 nm 250 nm. However, the total extinction per dust mass remains insensitive to particle size as long as the grains remain within the Rayleigh limit , and therefore the IR opacity would only be affected if the grains became much larger than in the ISM (cf. Sect. 3.1).
3 Current Status of Models
The evolution of spectral properties from the hydrogen-burning limit to the coolest observed brown dwarfs is displayed in Fig. 2. The transition from M- to L-types is characterised by disappearance of the optical VO and TiO bands, while FeH becomes stronger in the red optical and near IR spectrum, and a shift of the IR SED, exhibited in increasingly red () colours. These changes are explained by depletion of gaseous TiO due to the formation of titanates and to a lesser degree the condensation of VO, and the added opacity of silicate grains. Dust extinction blocks efficiently the emission in the optical and tends to smear out the remaining molecular absorption bands, the most prominent being due to H2O and CO.

Dusty models such as the middle plot in Fig. 2 reproduce well the observed spectra of early L dwarfs. As sinks below 1 700 K, silicates form at deeper layers, where they affect the emerging spectrum less, the outermost layers can cool and molecular bands begin to grow in strength again. The cooling also triggers a rapid change from a CE composition where most carbon is bound in carbon monoxide to a carbon chemistry dominated by methane, allowing the much stronger bands of this molecule to shape the IR spectrum. We can see the end point of this transformation at = 1 000 K, with the bottom plot showing an AMES-Cond model where the atmosphere is dust-free, and water and methane bands are strong. Consequently, cool evolved brown dwarfs emit more flux at shorter wavelengths (in the near-IR , , and broad bands), between the strong water vapour and methane bands, than blackbodies of the same bolometric luminosity would predict, and show very blue () colours compared to L dwarfs. This important fact was already predicted by the model calculations of Allard et al. in 1995 faphh95 and confirmed by the discovery of the first evolved brown dwarf, Gliese 229 B nakaGl229B ; broGl229B .
3.1 Formation and Gravitational Settling of Dust Clouds
Therefore, based upon observational evidence, the latest M and most L dwarfs carry atmospheric dust, whereas late T dwarfs show little or no evidence of condensates contributing to the opacity. Our models presented in Sect. 2.1 reproduce these extreme states well, but cannot adequately describe the transition between the two. In fact, in a static equilibrium model there is no solution that allows dust to remain suspended in the photosphere at all, as the grains will eventually sink to lower layers, and take all condensible elements with them until their abundance has decreased below the saturation pressure. Radiation pressure is negligible at such low luminosities and certainly cannot provide the force required to keep grains lifted up. Because of the relatively inefficient transport of energy by radiation and the large molecular opacities, these cool atmospheres are all convective. Convection can thus provide the essential replenishment of condensible material in the cloud layers. We therefore understand the presence of dust as a delicate equilibrium between 1) the sedimentation of the largest grains by gravity to deeper, hotter layers where they are melted and sublimated, 2) the convective updraft of condensible material, and 3) the efficiency of the condensation process and growth rate of grains. It becomes clear from this that the cloud layer can only exist in close proximity to a convection zone, where mixing is still vigourous enough to balance the sedimentation and depletion process. As the radiative-convective boundary retreats with decreasing luminosity, the cloud top also sinks deeper into the atmosphere.
Realising this connection between convective mixing and the presence of dust, various models have been developed to describe the cloud structure (cf. the review by Marley et al. marleyIAU211 ). The model of Tsuji tsuUniCloud assumes a fixed grain size and defines a lower limiting temperature , below which grains would coagulate too fast to stay suspended. The vertical extent of the cloud deck is thus defined by the condensation temperature and , the latter being an empirical parameter that needs to be adjusted by comparison with observations.
A more detailed approach has been developed by Ackerman & Marley ack01 , which uses a simplified description of the equilibrium between grain settling and mixing to derive modal grain size and dust density. Above the convection zone, vertical transport is assumed to occur only due to turbulent mixing with a fixed eddy diffusion coefficient. Their model also includes a free parameter to describe the sedimentation efficiency, which again is adjusted to fit the cloud thickness to observations. They find that observed L dwarf colours can be reproduced well using a relatively small range in marley02 .
In the model used in the current version of PHOENIX, Allard et al. settlIAU211 ; settlDust describe a more detailed calculation of the equilibrium between mixing and various condensate growth processes. Vertical transport within the convection zone is calculated according to mixing length theory, and overshoot into the radiative layer is modelled by assuming a velocity law based on the 3D-hydrodynamical simulations of Ludwig et al. ludwig-Mdwarf . The time scales for condensation, coagulation and coalescence, and the sedimentation speed of grains, are currently calculated according to the description of Rossow rossow78 for cloud microphysics in planetary atmospheres. The removal of elements from the gas phase by condensation and sedimentation is self-consistently taken into account in the solution of the CE system. The main differences from ack01 are thus the formulation of a depth-dependent mixing velocity driven by convective overshoot in the radiative zone, and the use of the microphysical time scale approach of Rossow, which adds a level of physical detail, though it risks extrapolating results which have only been tested empirically in the very different conditions of solar system planets. Another model based on the work of Rossow has been published by Cooper et al. cooperClouds , though they give no details on their the mixing velocity law, and have not yet included the cloud opacity into the atmosphere structure.
The most advanced and detailed treatment of cloud microphysics to date has been presented by Woitke & Helling (BerlinDustIII, , cf. also C. Helling, this volume). Their model provides a kinetic description of turbulent mixing and dust formation and precipitation processes, also based on an overshooting velocity field calibrated on hydrodynamical models ludwig-Mdwarf . At this stage only one species, TiO, is considered, and the computational complexity of these non-local cloud formation models has so far prohibited incorporation into a self-consistent model atmosphere code.
It is worth noting that all these models except tsuUniCloud predict the formation of dust grains larger than 1 μm, and ranging up to several 100 μm cooperClouds , in some layers of the atmosphere. IR extinction coefficients in these models are thus no longer independent of the grain size, and measurements of the near- and mid-IR SED may provide an observational test of the size distribution.
In parallel to the settling into deeper layers it is also possible that the cloud deck is breaking up into smaller features, with the surface coverage decreasing with . The balance of dust rainout and replenishment by convective upwelling is certainly conductive to the formation of unstable cloud structures, and evidence of this might be found in the very rapid change of the SED and the reappearance of FeH absorption bands in early T dwarfs adamLT02 . But while observations of both periodic and transient variability in L and some early T dwarfs clearly indicate the existence, and rapid evolution, of surface patterns 2001A&A…367..218B ; 2003MNRAS.346..473K , no trend for an increase in amplitude has been found that would support a significant change of the cloud fraction towards the L/T boundary enochLTvar . The models of Ackerman & Marley require a steady decrease in cloud coverage to explain the observed colour change at the beginning of the T dwarf sequence marleyIAU211 , while the settling code of Allard et al. settlIAU211 is able to reproduce these broad-band colours with a homogeneous cloud deck, but has not been tested against all changes of spectral features. More detailed comparison with spectroscopic observations will therefore be required to decide if uniform cloud models can fully account for the transition from dusty to dust-free atmospheres.
3.2 Molecular Abundances and Opacities
A serious obstacle to improving models for ultracool atmospheres is the lack of physical input data for many atomic and molecular opacities. Most existing databases of molecular lines such as HITRAN hitran98 have been compiled for planetary atmosphere studies, and are oriented towards low temperatures. Consequently, they are highly incomplete at energy levels strongly populated in brown dwarf and cool star atmospheres. Stellar atmosphere models therefore rely strongly on the efforts of laboratory spectroscopists and molecular physicists to produce comprehensive experimental and theoretical high-temperature line lists (draAtmos, ; ugjAtmos, , cf. also S. Johannson, this volume).
For dense molecular bands completeness of all relevant transitions (i. e. covering all levels populated at temperatures of 500 – 3 000 K), is generally more important to correctly include blanketing effects, than accurate individual line strengths and positions. This is illustrated in Fig. 3, which compares lines from the low-temperature databases with simulations using the STDS code rhlcb01 ; hahbSTDS , calculated for transitions from the vibrational ground state, as well as the first (Dyad) and second (Pentad) excited levels (hot bands). For population numbers typical of brown dwarf conditions, lines from each band contribute about the same integrated absorption strength, but distributed over approximately 2 , 2 , 2 and 1.3 lines, respectively. As a result, the spectra calculated from the GEISA/HITRAN lines and from only the ground-state transitions allow several times more flux to escape between the lines. The spectra including the hot bands on the other hand converge as soon as lines are included.

Completeness and accuracy for the IR water bands in the coolest brown dwarfs remains problematic 2MASS04pap . The available data for ammonia bands, which dominate the mid-IR spectrum in late T dwarfs, are even more limited. In addition, mounting evidence suggests that CH4/CO as well as NH3/N2 do not reach their CE mixing ratios in the cool upper layers of T dwarf atmospheres, as some key reaction times could be orders of magnitude larger than the timescale for mixing with warmer layers saumonIAU211 . Probing molecular abundances at low spectral resolution is complicated by the strong blending of many bands (e. g. CO and H2O at 4.55 μm), which might be disentangled by high-resolution observations.
4 Hot Jupiters
The discovery rate of EGPs has only been slightly behind that of brown dwarfs. Most known EGPs are associated with a parent star similar to our Sun and have very small orbital separations compared to that of Jupiter. Their close proximity to a solar-type star makes the modeling of such objects slightly more complicated than brown dwarfs because both the intrinsic interior source of heat and the intense extrinsic solar radiation must be accounted for. Barman et al. irradplanets have modeled EGPs at various orbital distances and cooling stages.


Figure 4 demonstrates the effects of irradiation on the atmosphere of an EGP which has cooled internally to 500 K. This corresponds to an age of about 10 million years evolPlanets . This particular case illustrates the dramatic heating that occurs in the atmosphere of EGPs that are found as close as 0.05 AU from their parent star (hereafter “Hot Jupiters”). Stellar radiation is capable of warming the planet’s surface to an equivalent temperature above 1600 K, i. e. conditions similar to dusty L dwarfs. Therefore, depending upon the atmospheric composition history, we also may expect to find magnesium silicate clouds at the surface of “Hot Jupiters”. These models also demonstrate the effects of irradiation for the extreme cases of condensation in an EGP atmosphere. We compare the temperature structures for a cloud-free and cloudy planet located at various orbital separations. In the cloud-free model, the stellar radiation penetrates deep into the atmosphere and heats the layers near the radiative-convective boundary. At small orbital separations, the heating is sufficient to suppress convection in most of the atmosphere. In the cloudy case, the dust effectively shields the inner layers of the atmosphere and heating only occurs at the top of the atmosphere. The cloud-free EGP atmospheres have spectra similar to the dust-free, free-floating brown dwarf shown as the lowermost curve in Fig. 2. However, as the planet is brought closer to the parent star, the molecular absorption features weaken, due to a flattening of the temperature profile. The dusty atmospheres have nearly featureless spectra due to the “grey” characteristics of dust opacity. When 0.05 AU is reached (not shown), the upper atmosphere is thermalised and the near-IR spectrum featureless in both cases. However, these models represent the substellar point (i. e. the point closest to the star) and therefore only predict a small portion of the complete observable spectrum.
It is very likely that a large day/night temperature difference will exist leading to a horizontal temperature gradient. Thus, the observable hemisphere of an EGP may have a complex spectrum composed of regions with varying degrees of stellar illumination and a fraction of the night side, depending on the phase and inclination. The exact thermal profile will also depend on the global atmospheric circulation that would redistribute the irradiated energy gui51PegEvol . On the other hand, for orbital separations larger than about 1 AU the stellar flux no longer adds significantly to the thermal near-IR EGP spectrum, implying that such EGPs can be well approximated by a non-irradiated atmosphere. Such an approximation is only valid for the thermal radiation emitted beyond 1 μm. At shorter wavelengths, the planet’s atmosphere reflects the stellar flux, making it appear much brighter than isolated brown dwarfs. The reflected optical starlight persists out to large orbital distances, as cooler atmospheres form highly reflecting cloud layers (ices with albedos of 0.5).
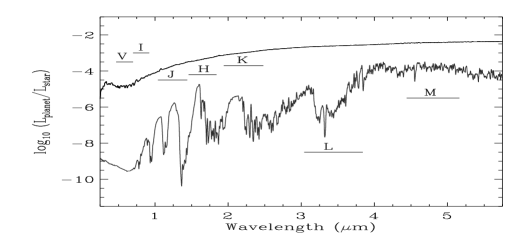
Since planets have been most often found close to a star, it is important to identify the most favourable wavelengths for the direct detection of light from those planets. Figure 5 presents the monochromatic luminosity ratio of an EGP at 0.05 and 5 AU from a G2V star. Independent of the spectral type of the primary (from G to M), the EGP at 0.05 AU has a contrast reaching in the band. However, when the planet is at 5 AU, the contrast reaches only at 5 μm, decreasing to in the bandpass. Note that these numbers are, for reasons above, optimistic estimates and assume a “full moon” planetary phase. The contrast turns up at optical wavelengths due to starlight reflected by the planet. The night side of a “Hot Jupiter” may look more like the EGP with an orbital separation of 5 AU, except of course that there would be no reflection effects, with such a large day/night difference likely producing strong temporal variations of the contrast as the planet orbits the star.
5 Conclusions
Ten years of observational and theoretical work have brought us thorough understanding of the basic physical properties of brown dwarfs. While many details, especially regarding non-equilibrium processes, and temporal and spatial variability of the atmosphere, still need to be addressed, current models provide a solid foundation for understanding extrasolar giant planets, and predicting their observable signatures. BD and EGP (unirradiated as well as “Hot Jupiter”-like) model atmospheres, thermal profiles, synthetic spectra, photometry, and evolution calculations are available for all evolutionary stages from a few Myrs from our web site at: http://perso.ens-lyon.fr/france.allard/.
Acknowledgments
D. H. wishes to thank Ulli Käufl and ESO for the invitation to this workshop, and Christiane Helling and Bengt Gustafsson for instructive comments on the presentation. This research was supported by the United States National Science Foundation under grant N-Stars RR185-258, and by NASA under grant NLTE RR185-236.
We are much indebted to the US DoE/NERSC and the German HLRN for generous allocation of CPU time at their supercomputing facilities.
References
- (1) R. Rebolo, M. R. Zapatero-Osorio, and E. L. Martín, Nature 377, 129 (1995).
- (2) T. Nakajima et al., Nature 378, 463 (1995).
- (3) B. R. Oppenheimer, S. R. Kulkarni, K. Matthews, and T. Nakajima, Science 270, 1478 (1995).
- (4) M. Mayor and D. Queloz, Nature 378, 355 (1995).
- (5) E. L. Martín, G. Basri, X. Delfosse, and T. Forveille, A&A 327, L29 (1997).
- (6) J. D. Kirkpatrick et al., ApJ 519, 802 (1999).
- (7) T. R. Geballe et al., ApJ 564, 466 (2002).
- (8) A. J. Burgasser et al., ApJ 564, 421 (2002).
- (9) I. Baraffe, G. Chabrier, T. S. Barman, F. Allard, and P. H. Hauschildt, A&A 402, 701 (2003).
- (10) T. R. Geballe et al., ApJ 556, 373 (2001).
- (11) D. Homeier et al., ApJ in prep. (2004).
- (12) K. S. Noll, T. R. Geballe, S. K. Leggett, and M. S. Marley, ApJ 541, L75 (2000).
- (13) A. Burrows, W. B. Hubbard, D. Saumon, and J. I. Lunine, ApJ 406, 158 (1993).
- (14) F. Allard and P. H. Hauschildt, ApJ 445, 433 (1995).
- (15) T. Tsuji, K. Ohnaka, W. Aoki, and T. Nakajima, A&A 308, L29 (1996).
- (16) G. Chabrier, I. Baraffe, F. Allard, and P. Hauschildt, ApJ 542, 464 (2000).
- (17) P. H. Hauschildt and E. Baron, J. Comp. Applied Math. 109, 41 (1999).
- (18) E. Baron, E. J. Lentz, and P. H. Hauschildt, ApJ 588, L29 (2003).
- (19) J. P. Aufdenberg et al., ApJ 570, 344 (2002).
- (20) F. Allard, P. Hauschildt, D. Alexander, A. Tamanai, and A. Schweitzer, ApJ 556, 357 (2001).
- (21) C. M. Sharp and W. F. Huebner, ApJS 72, 417 (1990).
- (22) P. H. Hauschildt and E. Baron, J. Comp. Applied Math. 102, 41 (1999).
- (23) N. F. Allard, F. Allard, P. H. Hauschildt, J. F. Kielkopf, and L. Machin, A&A 411, L473 (2003).
- (24) D. R. Alexander et al., Opacities of Molecules and Dust, in Stellar Atmosphere Modeling, eds. I. Hubeny, D. Mihalas, and K. Werner, ASP Conference Series, 288, 357, San Francisco, 2003.
- (25) M. S. Marley et al., Clouds and Clearings in the Atmospheres of the L and T Dwarfs, in IAU Symposium 211, 333, ASP, San Francisco, 2003.
- (26) T. Tsuji, ApJ 575, 264 (2002).
- (27) A. S. Ackerman and M. S. Marley, ApJ 556, 872 (2001).
- (28) M. S. Marley et al., ApJ 568, 335 (2002).
- (29) F. Allard et al., Model Atmospheres and Spectra: The Role of Dust, in Brown Dwarfs, ed. E. Martín, IAU Symposium 211, 325, ASP, San Francisco, 2003.
- (30) F. Allard et al., ApJ in prep. (2004).
- (31) H.-G. Ludwig, F. Allard, and P. H. Hauschildt, A&A 395, 99 (2002).
- (32) W. B. Rossow, Icarus 36, 1 (1978).
- (33) C. S. Cooper, D. Sudarsky, J. A. Milsom, J. I. Lunine, and A. Burrows, ApJ 586, 1320 (2003).
- (34) P. Woitke and C. Helling, A&A 414, 335 (2004).
- (35) A. J. Burgasser et al., ApJ 571, L151 (2002).
- (36) C. A. L. Bailer-Jones and R. Mundt, A&A 367, 218 (2001).
- (37) C. Koen, MNRAS 346, 473 (2003).
- (38) M. L. Enoch, M. E. Brown, and A. J. Burgasser, AJ 126, 1006 (2003).
- (39) L. S. Rothman et al., J. Quant. Spec. Radiat. Transf. 60, 665 (1998).
- (40) U. G. Jørgensen, Molecular opacities and cool star atmospheres, in Stellar Atmosphere Modeling, eds. I. Hubeny, D. Mihalas, and K. Werner, ASP Conference Series 288, 357, San Francisco, 2003.
- (41) O. Robert, J.-C. Hilico, M. Loëte, J.-P. Champion, and L. R. Brown, J. Mol. Spec. 209, 14 (2001).
- (42) D. Homeier, F. Allard, P. Hauschildt, and V. Boudon, ApJ in prep. (2004).
- (43) D. Saumon, M. S. Marley, K. Lodders, and R. S. Freedman, Non-equilibrium Chemistry in the Atmospheres of Brown Dwarfs, in Brown Dwarfs, ed. E. Martín, IAU Symposium 211, 345, ASP, San Francisco, 2003.
- (44) T. S. Barman, P. H. Hauschildt, and F. Allard, ApJ 556, 885 (2001).
- (45) T. Guillot and A. P. Showman, A&A 385, 156 (2002).