Discovery of Massive Evolved Galaxies at in the Hubble Ultra Deep Field11affiliation: Based on observations with the NASA/ESA Hubble Space Telescope, obtained at the Space Telescope Science Institute, which is operated by the Association of Universities for Research in Astronomy, Inc., under NASA contract NAS5–26555.
Abstract
We have identified six early-type galaxies at in the central 5.76 arcmin2 Hubble Ultra Deep Field NICMOS region based on a pronounced broad-band discontinuity between the NICMOS F110W and F160W bandpasses. These galaxies have red observed optical and near-infrared colors () that cannot be explained entirely by dust reddening (indicating advanced age), and their luminosities at rest-frame optical wavelengths suggest a substantial stellar mass. One of the galaxies is detected in X-ray and is likely to have an active nuclear region, while the rest are estimated to be at least 1 Gyr old at and contain total stellar mass of . We calculate a cumulative comoving stellar mass density of for massive evolved galaxies of at . Comparison of the stellar mass density confined in galaxies of different types shows that massive evolved galaxies contribute % of total stellar mass density even at these early epochs. Finally, an analysis of their morphology observed in the ACS and NICMOS images shows that the active galaxy has compact structure, while the rest are less concentrated. The presence of massive evolved galaxies at , when the universe was only 2 Gyr old, suggests that early star formation may have been particularly efficient in massive halos.
1 INTRODUCTION
The Hubble Ultra Deep Field (HUDF; Beckwith et al. 2004) imaging observations have recorded by far the deepest images of the distant universe using the Advanced Camera for Surveys (ACS). These observations cover arcmin2 of sky area and reach detection limits of , and 28.7 in the F435W, F606W, F775W, and F850LP bandpasses, respectively. Near-infrared images of comparable depths in the inner arcmin2 region of the HUDF have also been obtained using the NICMOS camera (Thompson et al. 2004). The NICMOS images reach detection limits of in F110W and in F160W, more than two magnitudes deeper than the deepest near-infrared images from the ground (e.g. Labbé et al. 2003).
A particularly exciting development is the opportunity to identify evolved galaxies at epochs earlier than , where the presence of massive galaxies becomes difficult to explain as the result of time-consuming hierarchical galaxy assembly (e.g. Baugh et al. 2002; Somerville et al. 2004). Over the past two years, galaxy samples selected in the near-infrared have shown that evolved galaxies are not rare at (e.g. Chen et al. 2003; Pozzetti et al. 2003) and that at least 40% of stellar mass density found locally was in place by (Fontana et al. 2003; Rudnick et al. 2003; Glazebrook et al. 2004). Together these results indicate that much of the assembly of stellar mass occurs at epochs much earlier than .
Detection of massive galaxies beyond pushes back the epoch of early-type galaxy formation even further and thus offers stronger constraints on models of galaxy formation. Deep ground-based imaging in the near-infrared has recently revealed a significant number of star-forming galaxies at with total stellar mass comparable to local early-type galaxies (Daddi et al. 2004; van Dokkum et al. 2004). Here we report the detection of six massive, evolved galaxies identified at in the HUDF/NICMOS images using photometric redshift techniques. Our analysis of the photometric properties of these red galaxies indicates that they are evolved stellar populations and that some massive galaxies are already largely assembled by .
We adopt a cosmology, and , with a dimensionless Hubble constant throughout the paper.
2 A CATALOG OF NEAR-INFRARED SELECTED HUDF GALAXIES
We have performed an independent analysis of the drizzle-stacked optical and near-infrared images provided by the HUDF team and the NICMOS treasury team. The object detection algorithm was similar to those described in Chen et al. (2002). In summary, we first performed object detection in individual images using SExtractor (Bertin & Arnouts 1996) and set the detection parameters such that no detections were found in the negative images. Catalogs of individual bandpasses were then combined to form a final catalog with flags indicating the presence/absence of flux in respective bandpasses. We identified 1833 objects of over the central 5.76 arcmin2 sky area.
We have also measured the redshifts and redshift likelihood functions for all the objects using a photometric redshift analysis outlined in Chen et al. (2003). The algorithm compares the observed SED, established from photometric measurements in the ACS F435W, F606W, F775W, F850LP, and NICMOS F110W and F160W bandpasses, with a grid of model templates calculated at different redshifts. We have considered a suite of galaxy templates that include E/S0, Sab, Scd, Irr, two starbursts and a QSO templates, as well as a suite of stellar templates that range from early O stars through late-type T dwarfs. Photometric redshift techniques are particularly successful when either the intrinsic continuum absorption at the Lyman or 4000 Å breaks or the external continuum absorption due to the intervening Ly forest are observed in the broad-band SEDs (e.g. Fernández-Soto et al. 2001; Abraham et al. 2004). These broad features are easy to identify and are only mildly sensitive to differences in the gas and dust content of the galaxies.
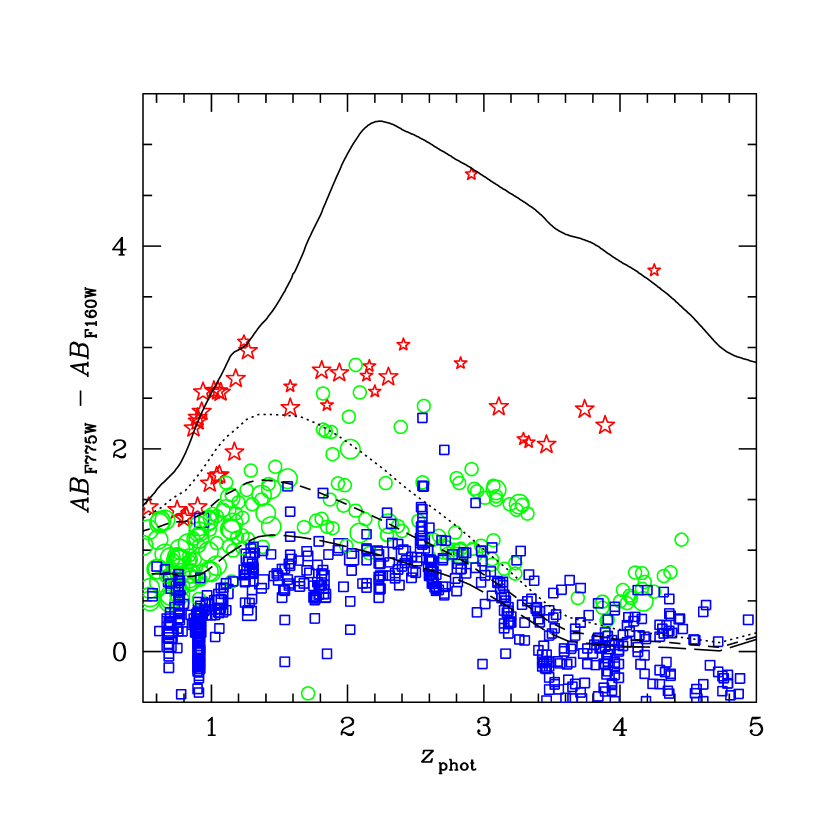
Figure 1 presents the observed F775W and F160W color () versus photometric redshift for all galaxies in the HUDF observed with NICMOS. While it is not surprising to find evolved galaxies with at in the HUDF images, it is intriguing to see that nine such galaxies lie at . These objects exhibit a pronounced discontinuity between the F110W and F160W bandpasses that is matched in each case to the rest-frame 4000-Å break in either an E/S0 or Sab galaxy template.
3 PROPERTIES OF MASSIVE, OLD GALAXIES AT
Galaxies dominated by evolved stars are least affected by the details of recent star formation and therefore allow the most reliable measurements of accumulated stellar mass. Consequently, these evolved galaxies are particularly useful in discriminating between galaxy formation scenarios. For hierarchical models (e.g. Kauffmann & Charlot 1998), evolution in the number density of massive galaxies constrains the merging sequence, while the age of the underlying stellar population constrains the epoch when the first stars formed.
Our photometric redshift analysis identified nine early-type galaxies at by associating the pronounced broad-band discontinuity between the NICMOS F110W and F160W bandpasses with the rest-frame 4000-Å break. This identification is the basis for our further analysis of the stellar populations and thus merits some scrutiny. One concern is that strong reddening in intermediate-redshift galaxies could mimic the appearance of a high-redshift 4000-Å break. To examine whether the observed SEDs are the result of dust reddening, we repeated the photometric redshift analysis including additional dusty templates. The dusty templates were generated using the SB1 template (with intrinsic color excess ) from Kinney et al. (1996), reddened according to the Calzetti extinction law (Calzetti, Kinney, & Storchi-Bergmann 1994) with varying from 0.1 to 2.5, in steps of 0.1.
The results are presented in Table 1, which lists in columns (1) through (7) the galaxies’ identification number in our catalog, their coordinates, the best-fit photometric redshift and template type, the observed magnitude in the NICMOS/F160W bandpass, and the observed optical and near-infrared colors. We found that all but three (#5256, #6548, and #1927) of the original nine candidates remain best characterized by an E/S0 or Sab template. Within the plausible range of extinctions we explored, dust reddening cannot explain the red SEDs of galaxies #12182, #9024, #9151, #6140, #1223, and #12183. We conclude that these six galaxies are genuinely evolved populations at . Galaxy #5256 was found to be better described as a dusty starburst at with ; galaxy #6548 was identified as a dusty starburst at with ; and galaxy #1927 was identified as a dusty starburst at with . The lower redshifts for #5256 and #6548 are further supported by the presence of significant flux in the ACS/F435W bandpass, which is inconsistent with Lyman limit absorption at .
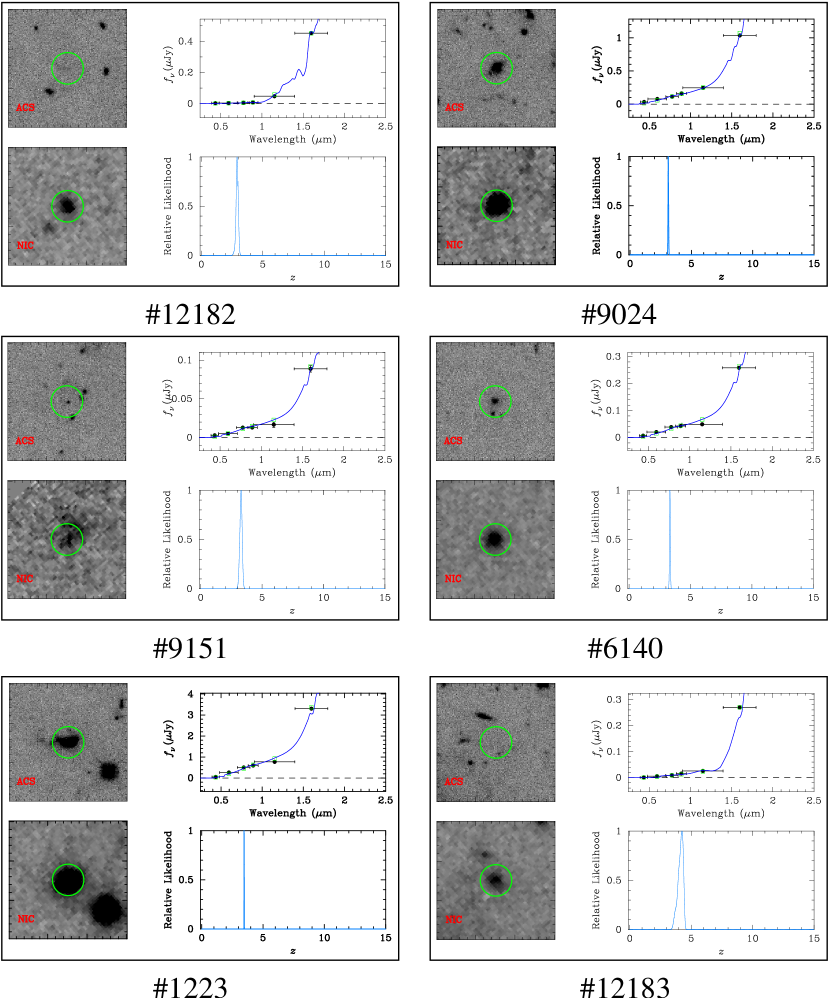
A summary of the redshift likelihood analysis of the six galaxies best-fitted by early-type galaxy templates is presented in Figure 2 together with their ACS and NICMOS images. Using the photometric redshifts derived from the expanded template set, we now proceed to examine the physical properties of these six galaxies in detail. We discuss in turn the age estimate of the stellar population, the accumulated stellar mass, the star formation rate, and the morphology.
Age—In principle, the age of a galaxy can be determined through a analysis. The probability that the observed SED is consistent with a spectral synthesis model at a given age is defined as , where is the number of bandpasses available, and are the observed flux and flux error in bandpass , and is the corresponding predicted flux from model . The model spectra may span a range of star formation history and metallicity. Although the best-fit age is subject to known degeneracies between different physical properties—most notably the age-metallicity degeneracy—the range of possible ages is bounded. The minimum age consistent with a given SED may be determined, for example, from the maximum plausible metallicity. Regardless of the detailed star-formation history, the minimum in the luminosity-weighted mean age is robust if a plausible upper limit to the metallicity can be identified. At these early epochs, solar metallicity would appear to be a reasonable upper limit for the average stellar population observed from the integrated light of individual galaxies.
We performed a minimum analysis to estimate the ages of the red galaxies, imposing the constraint that the metallicity be less than or equal to solar and considering a range of ages from 1 Myr through the age of the Universe at the redshifts of the galaxies. The estimated minimum ages (which corresponds to the maximum plausible metallicity) are presented in column (8) of Table 1. The best-fit model is identified in column (9). Our analysis suggests that these galaxies are genuinely old with a likely formation epoch well beyond . It is, however, interesting to find that only two of these galaxies can be described by a single burst model, indicating that some star formation is still in progress (as shown more quantitatively below). We note that the results of our analysis are only mildly sensitive to the uncertainties in photometric redshifts. Lowering the redshift by (typical of the observed scatter of photometric redshifts at due to template mismatch uncertainty) reduces the estimated age by only 0.3 Gyr.
Stellar mass—We estimated the total stellar mass of the six near-infrared selected galaxies using the observed flux in the NICMOS/F160W filter and the mass-to-light ratio of the best-fit spectral synthesis model at the estimated age. The NICMOS/F160W band corresponds roughly to the rest-frame band at , and the adopted values of ranged from for model (3) in Table 1 to for model (2). The resulting stellar masses are presented in column (10) of Table 1. The estimated masses range from to more than by , comparable to the stellar mass observed in nearby, bright elliptical galaxies. For comparison, the characteristic stellar mass measured at is averaged over all galaxy types (Cole et al. 2001). We note again that lowering the redshift of each galaxy by the typical uncertainty in the photometric redshift () reduces the estimated stellar mass by no more than 25%.
Star formation rate—From the age-fitting analysis, we found that only two of these red galaxies can be explained by a single burst at higher redshift. The moderate fluxes observed in the ACS bandpasses (which correspond to rest-frame near-UV bandpasses at ) indicate that at least some star formation is proceeding in these galaxies. We derived the intrinsic SFR using the UV SFR estimator at 1500 Å published by Madau, Pozzetti, & Dickinson (1998). The results are presented in column (11) of Table 1. The SFR of the evolved galaxies ranges from 0.04 to 5 , while the SFR of the dusty starburst galaxies fall in the range after corrected for dust extinction. The derived rates distinguish these evolved galaxies from the massive, star-forming population at (e.g. Daddi et al. 2004; Savaglio et al. 2004), but show that they continue to form stars at rates comparable to those observed in present-day spiral galaxies (e.g. Kennicutt 1998).
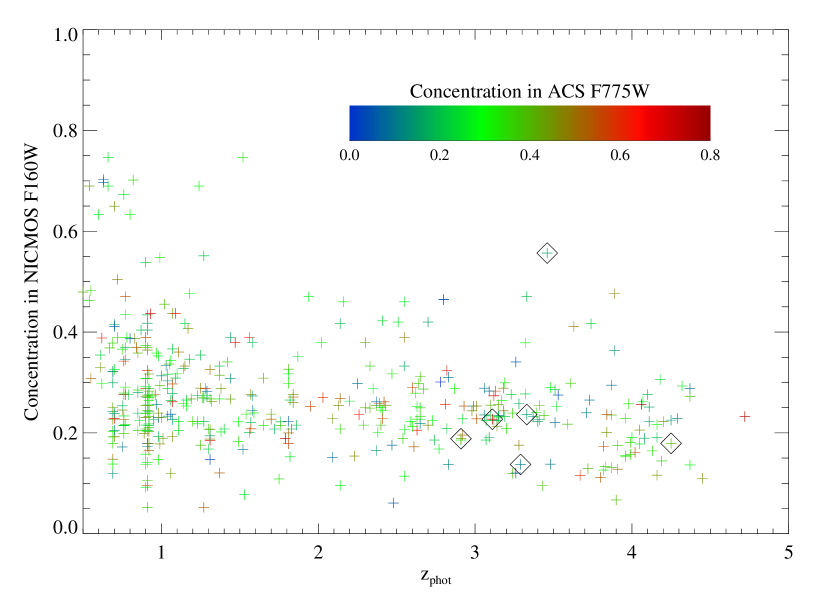
Morphology—Galaxy #1223 in Figure 2 appears quite compact in the rest-frame band (observed in the NICMOS/F160W band) but more extended in the rest-frame ultraviolet (observed in the ACS images). As a first step toward quantifying the morphologies of these galaxies, we calculated central concentration indices following the procedure outlined in Abraham et al. (1994). Figure 3 compares the concentration indices measured for the six evolved galaxies listed in Table 1 to those of all galaxies detected on the NICMOS/F160W frame. In the rest-frame band, galaxy #1223 is more concentrated than any other galaxy at comparable redshift. Although the absolute values of the concentration indices vary with detection threshold and redshift (due to cosmological surface-brightness dimming), the ordering of the concentrations at constant redshift does not. Both the large relative concentration and the visual appearance of galaxy #1223 suggest that much of its stellar mass is confined to a compact component.
In the rest-frame UV, however, galaxy #1223 is more diffuse. A closer inspection of this object shows that the lower concentration in F775W results from an asymmetric, nearly linear distribution of UV-bright sources nearby. The large scatter in F775W concentration at fixed F160W concentration for the NICMOS-detected sample as a whole suggests that such differences between UV and optical morphology are common. The concentration indices of the other five evolved galaxies identified in this work appear to be typical of the NICMOS-detected sample in both filters.
4 DISCUSSION
We have analyzed the HUDF images and identified six red galaxies with at , three of which have been studied previously by Caputi et al. (2004) based on shallower-depth images. The observed SEDs are inconsistent with reddened, moderate-redshift galaxies and are best-characterized by evolved galaxy templates older than 1.6 Gyr with moderate ongoing star formation. Further comparison between the observed SEDs and the best-fit stellar synthesis models shows that four of these galaxies have accumulated stellar masses comparable to those seen in present-day galaxies. The existence of these massive, evolved galaxies at is an important constraint for models based on hierarchical galaxy formation.
We first examine whether active galactic nuclei (AGN) contribute to some of these massive evolved galaxies (e.g. Cowie et al. 2001). Comparison of the coordinates of the six evolved galaxies with those in the 1 Ms catalog published by Giacconi et al. (2002) shows that one of the six evolved galaxies, #1223, has detections both in the keV and keV bands to within the error radius111It has come to our attention after the paper was submitted to the Journals that this source had been observed spectroscopically by Szokoly et al. (2004) and identified as type 2 QSO at based on the detections of prominent Ly and C IV emission features (XID#27).. The X-ray luminosity of this galaxy over the rest-frame keV window is estimated to be erg s-1 at . The luminous X-ray flux together with its concentrated morphology indicates that this galaxy has an active nuclear region. We cannot assess whether the nuclear region is heavily obscured by dust due to the lack of soft X-ray data in the rest frame. Given that both dusty and QSO templates are considered a mismatch to the observed SED, we argue that the active nucleus is unlikely to contribute a large fraction of the observed optical and near-infrared fluxes. But because it is difficult to assess the AGN contribution to the observed broad-band fluxes, we exclude this source from the subsequent analysis to calculate the stellar mass density.
Next, we estimate the total, volume-averaged stellar-mass density contained in evolved galaxies by . Given the total stellar mass determined for each evolved galaxy, we first calculate the maximum accessible comoving volume at of the images based on the expected NICMOS/F160W brightness derived from the best-fit spectral synthesis model and the corresponding . Individual contributions from the five evolved galaxies (excluding the possible AGN contamination from #1223) are summed together to yield a total, comoving stellar-mass density. We estimate that the total stellar mass density confined in evolved galaxies by is at least . The primary source of uncertainty in is the uncertainty in for different star formation histories and metallicities.
Our estimate of the stellar mass density at accounts for galaxies of total stellar mass greater than if we adopt . Below this mass threshold, the galaxies will have and will therefore fall below the detection limit of the HUDF/NICMOS images. This estimate is % of the total stellar mass density reported by Dickinson et al. (2003) and Rudnick et al. (2003) at , suggesting that massive, evolved galaxies account for a substantial fraction of the stellar mass density even at .
van Dokkum et al. (2003) have reported a surface density of arcmin-2 for red galaxies of and at , based on observations of sky area (c.f. Saracco et al. 2004). Excluding galaxy #1223, we find none of the evolved galaxies at are brighter than their thresold. Given the small field sizes and the strong clustering measured for evolved galaxies at lower redshift, this difference could simply be the result of field-to-field fluctuations. It is interesting to note that sub-mm observations have revealed a number of massive galaxies at in the process of rapidly converting baryons into stars (e.g. Genzel et al. 2003). It appears that observations at different wavelengths offer snapshots of these galaxies at different stages of their lifetime as the universe ages, and our sample may be among the ones that finished the major episode of star formation the earliest.
In summary, we have identified five evolved galaxies and one active galaxy at in the central 5.76 arcmin2 HUDF/NICMOS region based on a pronounced broad-band discontinuity between the NICMOS F110W and F160W bandpasses. These galaxies have red observed optical and near-infrared colors () that cannot be explained entirely by dust reddening (indicating advanced age), and their luminosities at rest-frame optical wavelengths indicate a substantial stellar mass. Our analysis suggests that these galaxies have stellar masses comparable to the present-day and are at least 1.6 Gyr old at , when the universe was merely 2 Gyr old. Because of their modest star-formation rates, all five evolved galaxies have and thus would not have been included in samples selected by rest-frame UV features (e.g. Shapley et al. 2001). The presence of massive, evolved galaxies at early times suggests that early star formation may have been particularly efficient in massive halos (e.g. Stockton, Canalizo, & Maihara 2004; Glazebrook et al. 2004).
References
- (1)
- (2) Abraham, R.G., Valdes, F., Yee, H.K.C., & van den Bergh, S. 1994, ApJ, 432, 75
- (3)
- (4) Abraham, R. et al. 2004, AJ in press (astro-ph/0402436)
- (5)
- (6) Baugh, C.M., Benson, A.J., Cole, S., Frenk, S.C. & Lacey, C. 2003, in The Mass of Galaxies at Low and High Redshift, p.91
- (7)
- (8) Bechwith, S. et al. 2004, in preparation (http://www.stsci.edu/hst/udf)
- (9)
- (10) Bertin, E. & Arnouts, S. 1996, A&AS, 117, 393
- (11)
- (12) Bruzual, A. & Charlot, S. 2003, MNRAS, 344, 1000
- (13)
- (14) Calzetti, D., Kinney, A.L., & Storchi-Bergmann, T. ApJ, 1994, 429, 582
- (15)
- (16) Caputi, K.I., Dunlop, J.S., McLure, R.J., & Roche, N.D. 2004, MNRAS in press (astro-ph/0401047)
- (17)
- (18) Chen, H.-W. et al. 2002, ApJ, 570, 54
- (19)
- (20) Chen, H.-W. et al. 2003, ApJ, 586, 745
- (21)
- (22) Cole, S. et al. 2001, MNRAS, 326, 255
- (23)
- (24) Cowie, L. L. et al. 2001, ApJ, 551, L9
- (25)
- (26) Daddi, E. et al. 2004, ApJ, 600, L127
- (27)
- (28) Fernández-Soto, A., Lanzetta, K. M., Chen, H.-W., Pascarelle, S. M., & Yahata, N. 2001, ApJS, 135, 41
- (29)
- (30) Franx, M., et al. 2003, ApJ, 587, L79
- (31)
- (32) Fontana, A. et al. 2003, ApJ, 594, L9
- (33)
- (34) Genzel, R. et al. 2003, ApJ, 584, 633
- (35)
- (36) Giacconi, R. et al. 2002, ApJS, 139, 369
- (37)
- (38) Glazebrook, K. et al. 2004, Nature, 430, 181
- (39)
- (40) Kennicutt, R. C. Jr. 1998, ARA&A, 36, 189
- (41)
- (42) Kinney, A. L., Calzetti, D., Bohlin, R. C., McQuade, K., Storchi-Bergmann, T., & Schmitt, H. R. 1996, ApJ, 467, 38
- (43)
- (44) Labbé, I. et al. 2003, AJ, 125, 1107
- (45)
- (46) Le Févre, O. et al. 2004, A&A submitted (astro-ph/0403628)
- (47)
- (48) Madau, P., Pozzetti, L., & Dickinson, M. 1998, ApJ, 498, 106
- (49)
- (50) Pettini, M. et al. 2001, ApJ, 554, 981
- (51)
- (52) Pozzetti, L. et al. 2003, A&A, 402, 837
- (53)
- (54) Rudnick, G. et al. 2003, ApJ, 599, 847
- (55)
- (56) Saracco, P. et al. 2004, A&A, 420, 125
- (57)
- (58) Savaglio, S. et al. 2004, ApJ, 602, 51
- (59)
- (60) Shapley, A. E., Steidel, C. C., Adelberger, K. L., Dickinson, M., Giavalisco, M., & Pettini, M. 2001, ApJ, 562, 95
- (61)
- (62) Somerville, R. et al. 2004, ApJ, 600, L135
- (63)
- (64) Stockton, A., Canalizo, G., & Maihara, T. 2004, ApJ, 605, 37
- (65)
- (66) Szokoly G. P. et al. 2004, ApJS in press (astro-ph/0312324)
- (67)
- (68) Thompson, R. et al. 2004, in preparation (http://www.stsci.edu/hst/udf)
- (69)
- (70) van Dokkum, P.G. et al. 2003, ApJ, 587, L83
- (71)
| RA | Dec | Stellar Mass | SFR | |||||||
|---|---|---|---|---|---|---|---|---|---|---|
| ID | (J2000) | (J2000) | SED | aaThe observed optical and near-infrared color measured in the ACS/F775W and NICMOS/F160W bandpasses. | (Gyr) | ModelbbThe spectral synthesis models were generated using the Bruzual & Charlot (2003) stellar synthesis code with a Salpeter initial mass function and the following recipes for SFR history and metal content: (1) single burst with solar metallicity; (2) single burst with solar metallicity; (3) Gyr SFR with solar metallicity; and (4) Gyr SFR with solar metallicity. | () | () | ||
| (1) | (2) | (3) | (4) | (5) | (6) | (7) | (8) | (9) | (10) | (11) |
| 12182 | 03:32:42.88 | 27:48:09.5 | 2.91 | E/S0 | 4.7 | 2.2 | (2) | |||
| 09024 | 03:32:35.08 | 27:46:47.5 | 3.11 | Sab | 2.4 | 1.7 | (3) | |||
| 09151 | 03:32:43.36 | 27:46:47.2 | 3.29 | Sab | 2.1 | 1.7 | (3) | |||
| 06140 | 03:32:43.48 | 27:47:27.3 | 3.33 | Sab | 2.1 | 1.6 | (3) | |||
| 01223 | 03:32:39.67 | 27:48:50.6 | 3.46 | Sab | 2.0 | 1.7 | (3) | |||
| 12183 | 03:32:38.74 | 27:48:39.9 | 4.25 | E/S0 | 3.8 | 1.4 | (2) | |||
| 05256 | 03:32:42.74 | 27:47:33.9 | 1.88 | 2.4 | … | … | … | |||
| 06548 | 03:32:34.64 | 27:47:20.9 | 1.58 | 2.2 | … | … | … | |||
| 01927 | 03:32:39.17 | 27:48:32.4 | 3.43 | 2.6 | … | … | … |