New Constraints on the Structure and Evolution of the Pulsar Wind Nebula 3C 58
Abstract
We present an investigation of the spectral and spatial structure of the X-ray emission from 3C 58 based on a 350 ks observation with the Chandra X-ray Observatory. This deep image, obtained as part of the Chandra Large Project program, reveals new information on nearly all spatial scales in the pulsar wind nebula (PWN). On the smallest scales we derive an improved limit of K for blackbody emission from the entire surface of the central neutron star (NS), confirming the need for rapid, nonstandard cooling in the stellar interior. Furthermore, we show that the data are consistent with emission from a light element atmosphere with a similar temperature. Surrounding the NS, a toroidal structure with a jet is resolved, consistent with earlier measurements and indicative of an east-west orientation for the projected rotation axis of the pulsar. A complex of loop-like X-ray filaments fills the nebula interior, and corresponds well with structures seen in the radio band. Several of the structures coincide with optical filaments as well. The emission from the interior of the PWN, including the pulsar, jet, and filaments, is primarily nonthermal in nature. The power law index steepens with radius, but appears to also show small azimuthal variations. The outermost regions of the nebula require a thermal emission component, confirming the presence of an ejecta-rich swept up shell.
Subject headings:
ISM: individual (3C 58), pulsars: individual (PSR J0205+6449), stars: neutron, supernova remnants, X-rays: general1. Introduction
The Crab pulsar, the product of a core-collapse supernova in 1054 CE, broadcasts its presence through a surrounding pulsar wind nebula (PWN) that is one of the most luminous radio and X-ray sources in the Galaxy. Its probable Medieval sibling, thought to have been born in the supernova of 1181 CE, is more modest. Its radio PWN, 3C58, is less luminous than the Crab by an order of magnitude, and its X-ray nebula is 2000 times weaker. In part, these differences are due to the birth properties of the two pulsars: the Crab’s initial spin period of msec means that nearly ergs has been dumped into its PWN in the last 950 yrs; it maintains a current spindown power of erg s-1. In contrast, PSR J0205+6449 in 3C58 requires a birth period of ms to explain its current period of 65 ms (Murray et al. 2002), and provides only erg s-1 to its PWN today – a factor of nearly 20 smaller than the Crab, albeit the second highest spin-down power known for a pulsar in the Galaxy.
Differences in the energetics of the powering neutron stars may well not be the only characteristic that distinguishes 3C58 from the Crab Nebula. Despite apparently being younger, 3C58 is considerably larger and yet exhibits lower expansion velocities among its optical filaments. Optical observations (Fesen 1983) reveal knots and filaments which show velocities to , and radio expansion measurements (Bietenholz, Kassim, & Weiler 2001) yield a similar result. Thus, the current expansion rate is considerably less than the undecelerated velocity required to yield the current size of 3C 58 if the age is only 820 yr. This has led some authors to suggest that 3C58 is not the remnant of SN1181. However, a recent review of Chinese and Japanese manuscripts (Stephensen & Green 2002) lends strong support to the association; of the known SNRs within a region that best corresponds to the supernova position inferred from these early records, only 3C 58 has properties consistent with a very young object. The presence of the second most energetic pulsar known further reinforces the connection.
X-rays were first detected from 3C58 by the Einstein Observatory (Becker, Helfand, and Szymkowiak 1982). These observations showed the centrally peaked brightness distribution and power law spectrum expected from a Crab-like remnant, confirming the classification of this source by Wilson and Weiler (1976). The surface brightness profile of the nebula suggested the presence of a central point source, but it was twenty years before the pulsar was finally discovered at X-ray (Murray et al. 2002) and radio (Camilo et al. 2002) wavelengths. ROSAT, ASCA, XMM, and Chandra observations of 3C58 added further details to our picture of the PWN, resolving the central enhancement (Helfand, Becker and White 1995), measuring the steepening of the X-ray spectrum with increasing radius (Torii et al. 2000), finding evidence for a shell of thermal emission (Bocchino et al. 2001), and setting a limit on the neutron star temperature (Slane, Helfand and Murray 2002). The rich detail hinted at by the image obtained in the latter publication inspired us to propose a very deep observation of the nebula. The result of that observation is presented here.
In section 2, we describe the observations, while section 3 includes details of our spatial and spectral analysis. We then go on to discuss the large-scale structure of the nebula (), the geometry of the inner nebula (), improved limits on the neutron star temperature (), the jet-like extension emanating from the pulsar (), the remarkable filamentary loop structures revealed in the image (), and the thermal shell emission (). Section 5 summarizes our conclusions.
2. Observations
3C 58 was observed for 350 ks with the ACIS detector onboard the Chandra Observatory between 22-26 April 2003. The aimpoint was placed on the S3 chip of the detector, and a 1/2-subarray mode was selected in order to minimize pileup from the compact central source while still imaging most of the PWN. The observation was divided into three segments (ObsIDs 4383, 4382, and 3832 in time order) to accommodate interruptions by the radiation zones in the Chandra orbit. An error in on-board commanding resulted in the final segment being carried out with the spacecraft dither turned off for the full 170 ks duration, resulting in no exposure in regions corresponding to gaps between the CCD chips or to bad column regions in the CCDs for this segment.
Standard cleaning of the data to remove episodes of high background, which affected of the middle segment, resulted in a final exposure of 317 ks. The X-ray image, shown in Figure 1 and described in detail below, reveals a complex structure consisting of loops, elongated features, and broad diffuse emission.
3. Analysis
3.1. Spatial Analysis
The exposure-corrected X-ray image of 3C 58 is shown in Figure 1. Here we have blocked the raw image by a factor of two, smoothed with a 1-bin (0.5 arcsec) Gaussian, and divided by the exposure map. The upper and lower edges of the image are set by the boundaries of the subarray readout. Faint vertical lines in the image are small artifacts related to the lack of dither in one observation segment, as described above. To produce the “X-ray color” image shown, color planes were created for three energy bands: 0.5–1.0 keV (red), 1.0–1.5 keV (green) and 1.5–12 keV (blue). As we discuss below, the color image reveals distinct energy-related structure, including an outer shell of soft emission.
The central region of 3C 58 is dominated by emission from the pulsar PSR J0205+6449 (Murray et al. 2002) which produces an extended structure, with elongation in the N-S direction, perpendicular to the long axis of the main nebula. Slane, Helfand, & Murray (2002) interpret this emission as a tilted ring-like equatorial structure associated with the pulsar wind termination shock, where the fast-moving pulsar wind merges with the much slower expansion of the nebula itself. They also noted the presence of a jet-like feature protruding arcseconds to the west, perpendicular to the inferred equatorial axis. This feature is particularly evident in Figure 1, and presumably corresponds to the rotation axis of the pulsar.
A striking feature of the X-ray morphology is the presence of numerous loop-like structures with radii of arcsec. The size-scale of these remarkable features, and their geometric distribution, are presumably signatures of a complex and tangled nebular magnetic field structure in the nebula. We discuss their physical characteristics in more detail in Section 4.
As illustrated in Figure 2, the radio morphology of 3C 58 is quite similar to that observed in X-rays. While not immediately evident in the radio image, a comparison with the Chandra image reveals radio structures that coincide with each of the X-ray loops. Moreover, the overall extent of the nebula is nearly the same in the two spectral bands, as is the structure of several other large-scale features such as the large loop in the eastern portion of the nebula. The nearly identical morphology is in complete contrast to the Crab Nebula, for example, in which the X-ray emission is confined to a much smaller region due to the short synchrotron lifetime of the high energy electrons. For 3C 58, the X-ray emitting particles persist nearly all the way to the edge of the radio nebula (Figure 3), indicating that synchrotron losses are not significant up to very high electron energies.

3.2. Spectral Analysis
X-ray spectra were extracted from various regions of 3C 58, with corresponding background spectra taken from a region of the CCD beyond the boundary of the nebula. Prior to extraction, a time-dependent gain correction was applied to the data using the tgain_corr software developed by A. Vikhlinin. Weighted spectral response and effective area tables for the extended emission regions were generated with the acisspec routine in ciao 3.0.2. The reduced effective area at low energies caused by contaminants that have condensed on the ACIS filter has been accounted for in the effective area tables.
The emission from 3C 58 is dominated by a power law component, typical of synchrotron emission. However, as described below, a faint thermal component is clearly detected in the outer regions of the PWN, and also contributes to the interior regions. Using a two component model consisting of a power law and a thermal plasma in ionization equilibrium (see Section 4.6), we performed joint fits to spectra from the annular regions indicated in Figure 2. We obtain a best-fit column density of . Fitting individual regions separately (both the annuli and also wedge-shaped regions shown in Figure 2) we do not find any significant evidence of spatial variations in For regions in which the count rate is to low to effectively constrain the absorption, we adopt this value. The uncertainties quoted here, and throughout the paper (unless otherwise noted), refer to 90% confidence intervals determined from chi-squared fitting of the data to the specified models.
The spectral index varies throughout 3C 58. We find, in particular, that the average spectral index increases with radius, as expected for synchrotron losses as the electrons diffuse away from the central regions, and consistent with the results based on studies of 3C 58 with ASCA (Torii et al. 2000) and XMM-Newton (Bocchino et al. 2001). Such an effect is also seen in G21.5–0.9 (Slane et al. 2000, Warwick et al. 2001) and other young PWNe. In 3C 58 the X-ray nebula extends nearly all the way to the edge of the radio nebula, indicating that the spectral break falls just below the soft X-ray band; only high energy electrons are significantly burned-off before reaching the outer regions of the nebula. In Figure 4 we plot the radial variation of the power law index in 3C 58, obtained by extracting spectra from annular regions centered on the pulsar. Here we have used only energies from keV in the fit in order to eliminate any contributions from a soft thermal component (see Section 4.6).

For the jet-like region protruding from the pulsar, we extracted spectra from the entire structure as well as three distinct regions extending across the feature. Fixing the column density for each region at the value derived above, we find a spectral index of with no significant evidence for variations along the jet (see Table 1).
As noted above, one of the remarkable features revealed by the deep ACIS observation of 3C 58 is the presence of loop-like filaments throughout the nebula. We have investigated the spectra from several individual filaments, and have compared these with the emission in the “void” regions interior to the loops to search for evidence of variations that might be expected if the synchrotron-emitting particles age as they diffuse from the loop regions. While we find spectral index differences between loop-like filaments in the interior and exterior regions of the nebula, the void regions have spectra similar to those of the corresponding filaments (Table 1), although the larger uncertainties on these values prevent us from ruling out softer spectra from regions outside of the filaments, as might be expected if particles are diffusing away from regions of acceleration. The jet-like feature extending westward from the pulsar appears to merge with a loop structure to the southwest, possibly suggesting that the former is not actually a jet. However, the spectrum of this feature is flatter than for the adjacent loop, indicating that the jet is a distinct feature.
| Jet | Loops | Voids | |||||||||
| Whole | A | B | C | A | B | C | A | B | C | ||
| 2.06 | 1.93 | 2.14 | 2.05 | 2.29 | 2.14 | 2.17 | 2.27 | 2.27 | 2.31 | ||
The overall morphology of 3C 58 reflects a symmetry associated with the pulsar rotation axis, whose projection is believed to lie in the E-W direction (Slane, Helfand, & Murray 2002). Blandford (2002) has suggested that the current flow in such pulsar-driven nebulae is directed along the polar regions, with a return current in the equatorial plane (or vice versa). This suggests possible spectral differences between the polar/equatorial regions and those regions in between. To investigate this, we extracted spectra in cone-like regions surrounding the pulsar (see Figure 2). We again restricted the energy band to keV and performed fits to a power law model. As shown in Figure 5, although there is some variation in the average index values, we find no obvious azimuthal variation in the spectral index that might be associated with this suggested large-scale current flow.
We note that the radial variation in spectral index shown in Figure 4 also appears to be at odds with a picture in which large-scale current flows connected with the pulsar extend to the outer reaches of the nebula. Rather, the trend appears more consistent with diffusion of particles injected into the central regions of the PWN. Indeed, the surface brightness of the nebula decreases with radius (Figure 6), and the decline is most dramatic for high energies, as expected for synchrotron aging. However, we note that the radial profile in the 0.5–1.0 keV band shows a bump at large radii, suggestive of a shell of soft emission.
The X-ray spectrum from the outermost region of 3C 58 (“Shell” region in Figure 2)111 Note that “Shell” region has been chosen to encompass emission only from the outer portions of 3C 58 that fall on the S3 chip because the adjacent S2 chip has considerably reduced low energy response, and thus is not sensitive to the soft thermal emission. is not well fit by a simple power law. Residual emission below keV requires an additional thermal model with keV and roughly a factor of 3 overabundance of Ne. This is similar to the results reported by Bocchino et al. (2001) based on XMM-Newton observations, and represents confirmation of the long-sought thermal shell of 3C 58. (See and Figure 9 for further details.)
4. Discussion
4.1. Large-Scale Structure of PWN
The large-scale elongated shape of 3C 58 is similar to that found (particularly in the radio band) for a number of other PWNe including the Crab Nebula and G54.1+0.3. Magnetohydrodynamical calculations by Begelman & Li (1992) and van der Swaluw (2003) show that such an elongation can result from the pinching effect of a toroidal magnetic field for which the projected axis lies along the long axis of the PWN. The pinching effect results in a low pressure at the edge of the bubble along the major axis with respect to the (higher) pressure at the edge of the minor axis, which yields the elongated structure. The elongation thus marks the projection of the spin axis of the pulsar producing the wound-up field. In 3C 58 this is consistent with the inference of an E-W direction for the projected spin axis based on the interpretation of the extended structure in the inner nebula as being associated with a tilted ring-shaped wind termination shock zone (Slane, Helfand, & Murray 2002 – see, also, Section 4.2).

Radio polarization measurements at 6, 21, and 50 cm show a complex magnetic field in the central regions of 3C 58 (Wilson & Weiler 1976), with some indications of a toroidal morphology. In the outer regions of the nebula, however, the component of the nebular magnetic field in the plane of the sky is predominantly oriented in an E-W direction, possibly indicating that the toroidal structure has been disturbed. However, small-scale variations in interstellar Faraday rotation could not not be ruled out as a source of the inferred polarization structure, and higher resolution measurements are clearly of interest. Begelman (1998) has noted that toroidal fields are susceptible to kink instabilities that may destroy the toroidal geometry. This could explain the lack of larger scale polarization evidence for a toroidal field. We discuss further evidence for the disruption of the toroidal field in Section 4.5.

The magnetic field strength inferred for 3C 58 from the minimum energy condition based on the radio spectrum is G (Green & Scheuer 1992). Using the historical age, this field results in a synchrotron burn-off break at Hz, or an energy of keV. This is consistent with fact that the nebula has very nearly the same size in the radio and X-ray bands; the effects of synchrotron aging become evident only just below the soft X-ray band (and are indeed observed in that band, as seen in Fig. 3), and only the electrons corresponding to the higher energy X-rays are appreciably diminished far from the pulsar. In fact, MHD calculations (Kennel & Coroniti 1984; hereafter KC84) show that the magnetic field strength initially increases with radius and reaches the equipartition value at a radius of depending upon the value of the magnetization parameter
which represents the ratio of the Poynting flux to particle flux in the wind. Here is the density, is the Lorentz factor of the wind, and is the termination shock radius defined by balancing the ram pressure of the wind with the internal pressure in the nebula, :
where is the spin-down power of the pulsar and is the fraction of a sphere covered by the wind. Beyond this point the field decreases as which means the effective synchrotron break extends to even higher energies.
Using the solutions of KC84, Reynolds (2003) has calculated the expected variation in spectral index in the soft X-ray band given synchrotron losses in the nebula. For any reasonable values of the expected photon index increases much more rapidly with radius in the outer nebula than we observe in 3C 58 (Fig. 3). Such a deviation from the predicted profile is also observed for G21.5–0.9 (Slane et al. 2000). This may be additional evidence for a magnetic field structure that deviates from the pure toroidal structure assumed by KC84, supporting the suggestion that kink instabilities disrupt the internal field structure (Begelman 1998).
We note that 3C 58 is not quite symmetric about the position of its pulsar, which is located closer to the western edge of the nebula. This may be an indication of a slightly lower density in the eastern direction, or could be associated with motion of the pulsar itself. For a simple geometric assumption based on the offset between the PWN center and the pulsar position, the latter interpretation would require a velocity of in the plane of the sky, which is fast but not unreasonable for a pulsar. However, when the hydrodynamics are considered this scenario appears problematic. The high sound speed in the PWN quickly smoothes out any pressure differences in the nebula, resulting in symmetric expansion (van der Swaluw, Downes & Keegan 2003). It is possible that the effects of internal magnetic fields alter this picture considerably; 3-D MHD simulations are needed to probe this more fully.
An alternative scenario would be that the western portion of the PWN has begun interacting with the reverse shock formed when the expanding ejecta meets the swept-up shell from the supernova blast wave. This could result if the ambient density is greater in the western direction, or if the pulsar is moving in that direction. In either case the compression of the PWN along this side naturally leads to an asymmetry of the PWN structure (see for example Figure 5 in van der Swaluw, Downes & Keegan 2003). The reverse shock scenario has been suggested by several authors as an explanation of the velocity/age discrepancy in 3C 58 (van der Swaluw 2003) and its low-frequency spectral break (Gallant et al. 2002). A serious drawback for this scenario is that in order for the reverse shock to propagate back to a distance of pc from the PWN center (i.e., to the observed western edge of the PWN), the required density of the medium surrounding the complete SNR is sufficiently high that one would expect to observe significant emission from an extended SNR shell, which is not the case. An estimate for this density can be obtained using the expansion model of a SNR from Truelove & McKee (1999), which yields roughly under the assumption that the energy of the SNR equals ergs. For lower explosion energies the inferred density will decrease.

4.2. The Inner Nebula
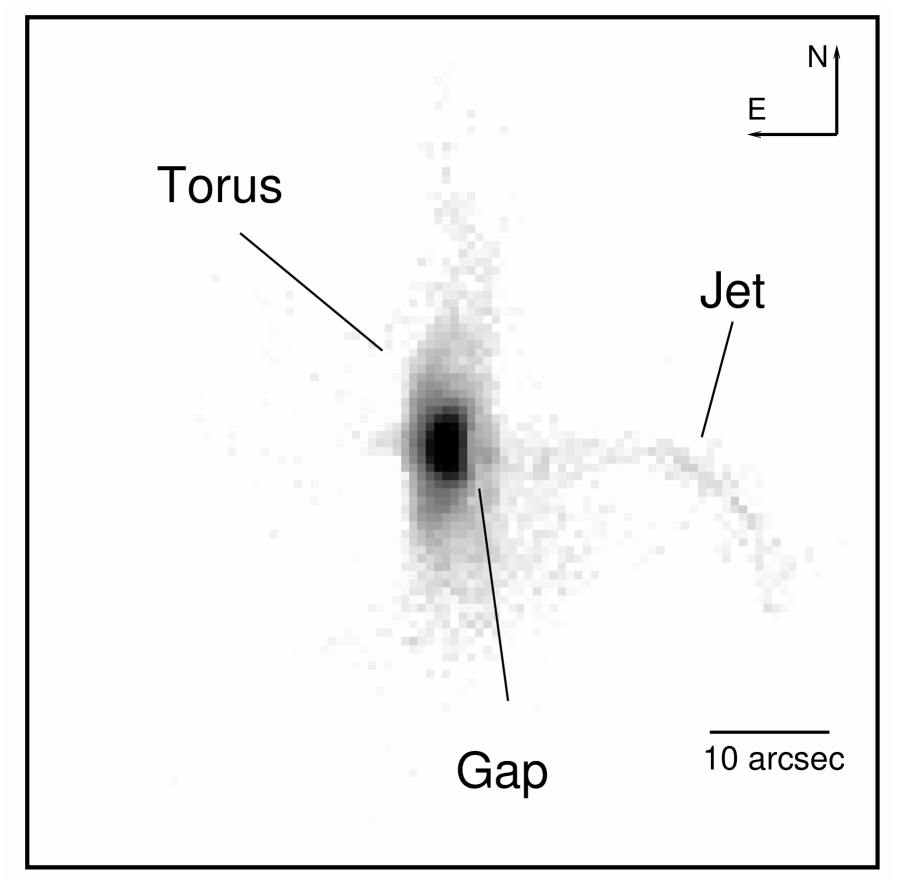
The innermost region of 3C 58 consists of a bright, elongated compact structure centered on the pulsar J0205+6449. This inner nebulosity is bounded along the western edge by a radio wisp (Frail & Moffet 1993) and was interpreted by Slane, Helfand, & Murray (2002) as emission from the pulsar wind termination shock. Our deeper observation modifies this interpretation slightly. As illustrated in Figure 7, the image of the central region is suggestive of a toroidal structure that is tilted about a north-south axis, with the pulsar at its center, and with a jet-like feature extending to the west. In Figure 8 we plot brightness profiles in three-pixel-wide slices through the nebula (in the east-west direction). In the lower panel, the profile extends through the pulsar position, while the upper panel shows profiles centered three pixels () north and south of the pulsar. The profile of the central emission is extended well beyond the point-spread function of the telescope, indicating that diffuse emission surrounds the pulsar. Immediately evident is a bump in the profile centered to the west of the pulsar. We interpret this as evidence of a ring surrounding the core of the nebula. Presumably, much like in the Crab Nebula (Weisskopf et al. 2000), we are seeing evidence of an inner diffuse emission region associated with the termination shock, and a surrounding torus. The brightness profile is asymmetric about the pulsar position, falling off more rapidly along the western side. This may indicate that the eastern side is beamed toward us, implying that the torus is tilted out of the plane of the sky on this side.
| Modela | (MK) | (km) | /dof | |||
| Neutron Star | ||||||
| PL | 0.91 | N/A | N/A | 431.5/304 | ||
| PL + BB | 1.02 | 10.7 | 357.5/302 | |||
| PL + NSA | 0.92 | 10.0 | 398.6/303 | |||
| Torus | ||||||
| PL | 4.06 | N/A | N/A | 578.2/418 | ||
| (a) Models are: power law (PL), blackbody (BB), and neutron star atmosphere (NSA) | ||||||
| (b) in units of | ||||||
| (c) Unabsorbed keV flux (in units of erg cm-2 s-1) | ||||||
The gap between the innermost extended region and the apparent ring feature to the west is located arcsec from the pulsar. A similar feature, though marginally significant, is observed northward of the pulsar at a distance of arcsec. If interpreted as a circular termination shock zone, the inferred inclination angle in the plane of the sky is roughly 70 degrees, similar to that inferred from the outer radii of the toroidal structure (Slane, Helfand, & Murray 2002). The luminosity of the toroidal region is .
4.3. The Neutron Star
Given the young age of 3C 58, the X-ray emission from PSR J0205+6449 places strong constraints on the rate at which the neutron star interior has cooled. Using a ks ACIS observation of 3C 58, Slane, Helfand, & Murray (2002) derived an upper limit of K for the surface temperature of the neutron star. Following the same technique for our deeper observation described here, we have extracted the spectrum from the pixel region centered on the pulsar; spectral fit results are summarized in Table 2. With the increased sensitivity of this exposure, we find that a power law model no longer adequately describes the spectrum. The best-fit model yields a reduced chi-squared value of There are significant residuals around the Si-K edge that suggest calibration-related effects, but the model also requires a column density significantly lower than that derived above for the nebula. Addition of a blackbody component improves the fit significantly (), but requires a column density larger than that for the PWN. With constrained to the PWN value, the blackbody component requires an emitting radius of only km and a temperature of keV. Constraining the size of the emitting region to that for a neutron star with km yields a upper limit of 0.086 keV ( K) on the temperature for emission from the entire surface based on fixing the column density at the upper limit of the 90% confidence level for that of the PWN.
Using a model for neutron star emission with a hydrogen atmosphere (Pavlov et al. 1995) and a surface magnetic field of G yields a significant improvement to the power law fit as well (). Here we have fixed the NS mass at 1.4 , the radius at 10 km, and the distance at 3.2 kpc. The best-fit models yields K.
We note that the emission from PSR J0205+6449 is not clearly resolved from the contributions of the surrounding compact nebula, and the spectral index of the pulsar may differ from that which we derived for the central emission. RXTE observations (Ransom et al. 2004) indicate a power law photon index of 1.0 for the pulsed component of the emission from PSR J0205+6449. The pulsed fraction derived from Chandra HRC observations (Murray et al. 2002) is in the keV band. Accounting for the ratio of encircled energy fractions for the HRC and ACIS source extraction regions, and also for the relative effective areas for the detectors, the expected ACIS count rate from this component is . Adding a component with these fixed parameters to the spectral model improves the spectral fit. Thus, while we do not uniquely identify such a spectral component, our results are consistent with those derived from RXTE observations. Moreover, if the neutron star atmosphere model described above is added to the model as well, the fit is improved again (with an F-test probability of that the improvement is random) and yields a NS temperature of K and a column density that is consistent with that for the PWN as a whole.
This temperature (as well as that derived without the second power law component, and the upper limit for blackbody emission from the entire surface) falls far below the predictions for standard cooling by the modified Urca process for a neutron star with a radius of 12 km. For larger masses, it is possible for the proton fraction in the interior to become sufficiently high to permit cooling through the direct Urca process (Kaminker, Yakovlev, & Gnedin 2002; Yakovlev et al. 2002), thus enabling the upper limit for PSR J0205+6449 to be accommodated. Alternatively, the presence of pion condensates (or other exotic particles) in the core would also lead to rapid cooling that results in such low temperatures (Tsuruta et al. 2002). The results presented here, combined with those for the Vela Pulsar (Pavlov et al. 2001) and other young neutron stars point to rapid cooling by nonstandard processes (i.e. something other than the modified Urca process). Page et al. (2004) identify “minimal cooling” scenarios which are able to accommodate the results for pulsars other than that in 3C 58. Recent limits for the compact object in CTA 1 (Slane et al. 2004; Halpern et al. 2004), as well as limits for undetected neutron stars in several nearby SNRs (Kaplan et al. 2004) may provide additional evidence for such “enhanced cooling” in neutron stars. Further observations are of considerable importance in constraining cooling models.
Thus, while the results reported here, combined with those for the Vela Pulsar and a number of other young neutron stars, point rather clearly to rapid cooling by non-standard processing (i.e., something other than the modified Urca process), further observations of other young neutron stars are required to differentiate between competing theoretical models.
4.4. The Jet-Like Feature
The elongated structure extending westward from the position of the pulsar has the appearance of a jet. Its orientation is consistent, in projection, with the pulsar rotation axis inferred from the wind termination shock region discussed above, and also the east-west elongation of the entire PWN. The structure shows considerable curvature, similar to that seen in the Crab Pulsar jet. The power law spectrum of the jet-like structure in 3C 58 has a photon index of . The spectral index does not vary along the length of the feature. The observed luminosity is , nearly a factor of 10 smaller than that for the torus. For the Crab Nebula, the torus is nearly 20 times more luminous than the jet in X-rays (F. Seward, private communication), while for PSR B1509–58 the jet is brighter than the extended inner emission (Gaensler et al. 2002).
Approximating the structure as a cylinder whose length is 35 arcsec, with a width of 6 arcsec, the volume is where is the volume filling factor. Using the X-ray spectrum, assuming synchrotron emission, the minimum total energy in this volume is then (see, e.g., Gaensler et al. 2001); here is the ratio of ion to electron energy. The corresponding magnetic field . We note that this is smaller than the equipartition field for the nebula as a whole, G as determined from radio measurements (Green & Scheuer 1992). This is consistent with the expectation that the magnetic field is lower in the central regions of the PWN, and rises to the equipartition value only at larger radii (KC84).
Since there is no spectral variation across the elongated structure, the synchrotron lifetime of the energetic particles constrains the rate at which energy is being injected. For particles radiating X-rays with energies of 5 keV, the synchrotron lifetime is . The outflow velocity of the material must then be , or . Note that for the Crab, (Willingale et al. 2001), a similar value.
For the X-ray emitting particles in the jet-like structure, the rate at which energy must be supplied by the pulsar is . This represents only of the energy loss rate from the pulsar itself (). The value for the jet in PSR B1509–58 is 0.5%. indicating that the 3C 58 jet (if it is indeed a jet) carries proportionally much less of the pulsar spin-down power in X-rays.
4.5. Filamentary Loop Structures
Our deep Chandra observation of 3C 58 reveals a complex of loop-like filaments most prominent near the central regions (Figure 1), but evident throughout the nebula. These structures, whose X-ray spectra are nonthermal, are very well correlated with features observed in the radio band (Figure 2). Extensive filamentary structure is also observed in radio images of the Crab Nebula. In this case, the filaments coincide with optical filaments observed in H, [OIII], and other lines, indicating thermal emission. MHD simulations suggest that the Crab filaments form from Rayleigh-Taylor instabilities as the expanding relativistic bubble encounters slower moving ejecta (Jun 1998; Bucciantini 2004). The enhanced radio emission presumably results from compression of the relativistic fluid in the expanding nebula as it encounters these embedded filaments. If this is correct, one might also expect X-ray emission from these radio filaments. In the Crab Nebula, however, the magnetic field is sufficiently high that the X-ray emitting electrons do not reach the outer portions of the nebula as a consequence of synchrotron losses. Because the radio filaments appear to be concentrated in a shell, there is very little X-ray emission coincident with these structures; indeed, the X-ray emission region is much smaller in extent than the radio nebula.222 Deep Chandra images of the Crab Nebula do reveal several filaments outside the bright X-ray torus that coincide with radio filaments (F. Seward - private communication).
Optical observations of 3C 58 reveal faint thermal filaments as well (van den Bergh 1978), which presumably have a similar origin. The velocities of these filaments are (Fesen 1983), sufficiently high to indicate that the PWN is young, but too small to account for the current size of 3C 58 if the historical age is assumed – one of several standing problems with regard to its evolution. In Figure 2 we present an H image obtained in a 8400 s integration with the 1.3 m McGraw-Hill telescope, along with a single contour marking the outer boundary of the radio nebula. The interior is filled with filaments, some organized into apparent ring-like shapes. Of particular note is the arcsec ring in the southwestern portion of the nebula, which coincides with an identical feature in the X-ray image, as well as in the radio image. This feature appears to be an example of the filamentary structures described above. However, it is apparent from Figure 2 that many of the X-ray filaments do not have corresponding optical structures. While comparisons with deeper optical images are clearly needed, the fact that many of the X-ray features without optical counterparts are brighter than average in X-rays suggests that these may actually arise from a different mechanism.
We propose that the bulk of the discrete structures seen in the X-ray and radio images of 3C 58 are magnetic loops torn from the toroidal field by kink instabilities. In the inner nebula, the loop sizes are similar to the size of the termination shock radius, as suggested by Begelman (1998). As the structures expand, they enlarge slightly as a consequence of the decreasing pressure in the nebula. Some of the observed X-ray structure in the outermost regions may be the result of thermal filaments produced by Rayleigh-Taylor instabilities, similar to the filaments in the Crab Nebula. The observed soft X-ray shell (see Section 4.6) demonstrates the presence of ejecta in these outer regions, and the optical/radio/X-ray emission from the southwest ring appears consistent with this scenario. While some of the optical filaments do appear to be located in the central regions, these may lie primarily along a shell seen in projection.
We note that considerable loop-like filamentary structure is evident in Chandra observations of the Crab Nebula (Weisskopf et al. 2000). These features are primarily observed encircling the bright Crab torus, perpendicular to the toroidal plane, and may result from currents within the torus itself. It is at least conceivable that such currents are signatures of the kink instabilities suggested above.
If the X-ray filaments in the inner portions of 3C 58 are indeed the result of a disrupted toroidal magnetic field, this may also explain the radio polarization results that show a primarily radial field in the outer regions (Wilson & Weiler 1976) as well as the discrepancy between the predicted and observed radial variation in the X-ray spectral index (Reynolds 2003). The large-scale structure of the nebula, which is well-described by MHD models invoking pinching by a toroidal field to confine the equatorial region (Begelman & Li 1992; van der Swaluw 2003), would seem to argue against this. However, it is possible that the innate asymmetry that results in this large-scale morphology is imprinted in the flow close to the termination shock, and that disruption of the field beyond this point does not strongly affect the expansion. New MHD modeling is necessary to investigate more fully the self-consistency of this scenario.

4.6. The Thermal Shell
Studies of 3C 58 with XMM-Newton reveal evidence for thermal emission in the outer regions of the nebula (Bocchino et al. 2001). Our observations confirm this result and provide improved parameters describing the nature of the emission. As shown in Figure 6, the X-ray surface brightness for 3C 58 declines monotonically with radius except at energies below keV where there is a noticeable plateau in the outer regions, suggestive of a shell of soft emission. The spectrum from the outer shell of the nebula is shown in Figure 9. Contrary to what is found for all regions in the nebula interior, a single power law model is not able to adequately fit the spectrum of the outer region. The best-fit power law is indicated in the Figure as the solid curve labeled 1; there is significant residual emission between keV. Adding a single equilibrium plasma model (Raymond & Smith 1977) with keV and enhanced Ne and Mg abundances provides an excellent fit to the data (curve 2). The curve labeled 3 in the Figure corresponds to power law component only for the best fit two-component model, illustrating the reasonably large contribution from the thermal shell.
Similar results are obtained with the vpshock model (Borkowski, Lyerly, & Reynolds 2001). The equilibrium model provides a slightly better fit, and the vpshock model requires an ionization timescale appropriate for equilibrium. The best-fit values for the thermal shell are given in Table 3.
Treating 3C 58 as a prolate ellipsoid, we estimate a total volume of . The region from which the shell spectrum has been extracted is complicated; we estimate its volume as roughly one-third that of the entire PWN, but this quantity is quite uncertain. Based on this estimate, the volume emission measure from the spectral fit implies a density of for the thermal material. This corresponds to a mass of in this volume, and roughly two times this amount for the entire shell (since less than half of the shell volume is contained in the spectral extraction region). Spectral fits for the inner regions of 3C 58 reveal emission from this same plasma component; this mass estimate is thus a lower limit. The enhanced abundance of Ne and Mg indicates that the shell is composed of ejecta. This is consistent with the picture wherein the optical filaments in 3C 58 result from interactions between the expanding bubble and the supernova ejecta. However, the mass estimated above appears to be in conflict with the assumed age for 3C 58. Chevalier (2003) notes that the amount of mass swept up by the PWN is for most supernova density distributions; here is the radius of the PWN. For 3C 58 this leads to a predicted swept-up mass nearly 500 times smaller than that inferred from the spectral fits. A more detailed study of this thermal component is currently underway using a large XMM-Newton dataset obtained from numerous calibration observations, and we defer further discussion of this emission component and its implications for the dynamics and evolution of 3C 58 to a future publication.
5. Summary
Deep Chandra observations of 3C 58 reveal a rich X-ray structure consisting of what appear to be magnetic loops. These structures predominate in the interior, just outside the pulsar termination shock, but are also found in outer regions. The structures are well correlated with radio features, but not, in general, with the optical filaments in 3C 58. They appear to have a different origin from the optical and radio filaments in the Crab Nebula, possibly originating from kink instabilities in the inner toroidal field. This notion may find additional support from radio polarization data, which appear to show a significant change in the field morphology away from the central regions, but improved radio observations are required to confirm this. The observed radial variation in the X-ray spectral index is shallower than expected from the KC84 model, possibly also indicating that the field structure differs from that assumed, although the discrepancy could arise from factors other than a modification of the toroidal field. The detection of a thermal shell confirms the earlier reports by Bocchino et al. (2001) based on XMM data. The emission is enriched in Ne and Mg, indicating that it is swept-up ejecta from the progenitor. The total mass of X-ray emitting ejecta is relatively uncertain due to the poorly defined volume and filling factor, as well as the dominant contribution from synchrotron emission throughout most of the PWN. It is at least several . The X-ray spectrum of PSR J0205+6449 in 3C 58 is not well described by a single power law. Evidence consistent with a hard spectrum () associated with the pulsed component observed with the HRC and RXTE is revealed, as is the apparent detection of thermal emission from a hydrogen atmosphere of a neutron star. At the most conservative level, new limits on any blackbody-like emission imply a surface temperature K which is far below predictions of standard models based on neutrino cooling through the modified Urca process, forcing one to consider either direct Urca cooling due to an increased proton fraction or the presence of exotic particles in the interior. Immediately surrounding the pulsar, the X-ray emission reveals an elongated structure that appears to be a tilted toroid along with a jet extended to the west and some evidence of a counterjet. In this regard, the inner portions of 3C 58 appear similar to the Crab nebula – if not in brightness, then in overall structure. The inferred position of the termination shock is inside the position of the radio wisp discovered by Frail and Moffett (1993), presumably indicating that this wisp bounds the outer torus. The X-ray spectrum of the jet shows no evidence of synchrotron aging, allowing us to to infer a flow velocity , similar to that for the Crab jet. The large-scale morphology of 3C 58, with its elongation in a direction perpendicular to the inferred pulsar rotation axis, is consistent with models for PWNe with embedded toroidal magnetic fields, but the radial variation in spectral index and the radio polarization observations seem to indicate that the field is more complicated than this, perhaps consistent with the small-scale loops described above. More sensitive radio polarization measurements are required to investigate this further, and deeper optical observations are also of interest to investigate more fully the relationship between optical filaments and the observed X-ray and radio structures.
References
- (1)
- (2) Becker, R. H., Helfand, D. J., & Szymkowiak, A. E. 1982, ApJ, 255, 557
- (3)
- (4) Begelman, M. C. 1998, 1998, ApJ, 493, 291
- (5)
- (6) Begelman, M. C. & Li, Z. 1992, ApJ, 397, 187
- (7)
- (8) Bietenholz, M. F., Kassim, N. E., & Weiler, K. W. 2001, ApJ, 560, 772
- (9)
- (10) Blandford, R. D. 2002, in Lighthouses of the Universe: The Most Luminous Celestial Objects and Their Use for Cosmology Proceedings of the MPA/ESO/, p. 381
- (11)
- (12) Bocchino, F., Warwick, R. S., Marty, P., Lumb, D., Becker, W., & Pigot, C. 2001, A&A, 369, 1078
- (13)
- (14) Borkowski, K. J., Lyerly, W. J., & Reynolds, S. P. 2001, ApJ, 548, 820
- (15)
- (16) Bucciantini, N., Amato, E., Bandiera, R., Blondin, J. M., & Del Zanna, L., 2004, A&A (accepted)
- (17)
- (18) Camilo, F. et al. 2002, ApJ, 571, L41
- (19)
- (20) Chevalier, R. 2004, ASR, 33, No. 4, 456
- (21)
- (22) Fesen, R. A. 1983, ApJ, 270, L53
- (23)
- (24) Frail, D. A. & Moffett, D. A. 1993, ApJ, 408, 637
- (25)
- (26) Gaensler, B. M., Arons, J., Kaspi, V. M., Pivovaroff, M. J., Kawai, N., & Tamura, K. 2002, ApJ, 569, 878
- (27)
- (28) Gallant, Y. A., van der Swaluw, E., Kirk, J. G., & Achterberg, A. 2002, in Neutron Stars in Supernova Remnants, ASP Conference Series, Vol. 271. Eds. P. O. Slane & B. M. Gaensler. San Francisco: ASP, 2002., p.99
- (29)
- (30) Green, D. A. & Scheuer, P. A. G. 1992, MNRAS, 258, 833
- (31)
- (32) Helfand, D. J., Becker, R. H., & White, R. L. 1995, ApJ, 453, 741
- (33)
- (34) Jun, B.-I. 1998, ApJ, 499, 282
- (35)
- (36) Kaminker, A. D., Yakovlev, D. G., Gnedin, O. Y. 2002, 2002, A&A, 383, 1076
- (37)
- (38) Kennel, C.F. & Coroniti 1984 (KC84), ApJ, 283, 694
- (39)
- (40) Murray, S. S., Slane, P. O., Seward, S. M., & Gaensler, B. M. 2002, ApJ, 568, 226
- (41)
- (42) Truelove, J. K., & McKee, C. F. 1999, ApJS, 120, 299
- (43)
- (44) Page, D., Lattimer, J. M., Prakash, M., & Steiner, A. W. 2004, astro-ph/0405196
- (45)
- (46) Pavlov, G. G., Shibanov, Y. A., Zavlin, V. E., & Meyer, R. D. 1995, in The Lives of the Neutron Stars, ed. M. A. Alpar, U. Kiziloglu, & J. van Paradijs (Dordrecht: Kluwer), 71
- (47)
- (48) Pavlov, G. G., Zavlin, V. E., Sanwal, D., Burwitz, V., & Garmire, G. P. 2001, ApJ, 552, L129
- (49) Ransom, S. et al. 2004, astro-ph/0401127, to appear in the proceedings of X-ray Timing 2003: Rossi and Beyond, ed. P. Kaaret, F.K. Lamb, & J.H. Swank (Melville, NY: American Institute of Physics)
- (50)
- (51) Raymond, J. C. & Smith, B. W. 1977, ApJS, 35, 419
- (52)
- (53) Reynolds, S. P. 2003, submitted to Proceedings of IAU Colloquium 192, 10 Years of SN1993J (Valencia, Spain, April 2003)
- (54)
- (55) Slane, P., Chen, Y., Schulz, N. S., Seward, F. D., Hughes, J. P. & Gaensler, B. M. 2000, ApJ, 533, L29
- (56)
- (57) Slane, P., Helfand, D. J., & Murray, S. S. 2002, ApJ, 571, L45
- (58)
- (59) Stephenson, F. R. & Green, D. A. 2002, Historical Supernovae and their Remnants (Oxford University Press)
- (60)
- (61) Torii, K., Slane, P. O., Kinigasa, K., Hashimotodani, K. & Tsunemi, H. 2000, PASJ, 52, 875
- (62)
- (63) Tsuruta, S. et al. 2002, ApJ, 571, L143
- (64)
- (65) van den Bergh, S. 1978, ApJ, 220, L9
- (66)
- (67) van der Swaluw, E. 2003, A&A, 404, 939
- (68)
- (69) van der Swaluw, E., Downes, T. P., & Keegan, R. 2004, A&A (submitted)
- (70)
- (71) Warwick, R. S. et al. 2001, A&A, 365, L248
- (72)
- (73) Weisskopf, M. C. et al. 2000, ApJ, 536, L81
- (74)
- (75) Willingale, R. et al. 2001, A&A, 365, L212
- (76)
- (77) Wilson, A. S. & Weiler, K. W. 1976 A&A, 49, 357
- (78)
- (79) Yakovlev, D. G., Kaminker, A. D., Haensel, P., & Gnedin, O. Y. 2002, A&A, 389, L24
- (80)