11email: jborisso, dante@astro.puc.cl 22institutetext: European Southern Observatory, Karl-Schwarzschild-Str. 2, D-85748 Garching b. München, Germany
22email: mrejkuba@eso.org 33institutetext: Columbia University, Dept. of Astronomy, New York, USA
33email: alves@astro.columbia.edu 44institutetext: Lawrence Livermore National Laboratory, Livermore, California, USA
44email: kcook@llnl.org 55institutetext: Mount Stromlo Observatory, Canberra ACT, Australia
55email: kcf@mso.anu.edu
Properties of RR Lyrae stars in the Inner Regions of the Large Magellanic Cloud. ††thanks: Based on observations collected with the Very Large Telescope and the New Technology Telescope of the European Southern Observatory within the Observing Programs 64.N-0176(B) and 70.B-0547. Tables 3, 4 and 6 are also available in electronic form at the CDS via anonymous ftp to cdsarc.u-strasbg.fr (130.79.128.5) or via http://cdsweb.u-strasbg.fr/cgi-bin/qcat?J/A+A/
We present the radial velocities, metallicities and the K-band magnitudes of 74 RR Lyrae stars in the inner regions of the LMC. The intermediate resolution spectra and infrared images were obtained with FORS1 at the ESO VLT and with the SOFI infrared imager at the ESO NTT. The best 43 RR Lyrae with measured velocities yield an observed velocity dispersion of km s-1. We obtain a true LMC RR Lyrae velocity dispersion of km s-1, which is higher than the velocity dispersion of any other LMC population previously measured. This is the first empirical evidence for a kinematically hot, metal-poor halo in the LMC as discussed in Minniti et al. (2003). Using Layden’s (1994) modification of the method we measured the metallicity for 23 of our stars. The mean value is [Fe/H] = dex. The absolute magnitudes and of RR Lyrae stars are linear functions of metallicity. In the V band, our data agree with the Olech et al. (2003) relation, in the K band the slope is flatter. The average apparent V luminosity of 70 RR Lyrae stars is and the average K luminosity of 37 RR Lyrae stars is . There is no obvious relation between apparent V magnitude and LogP, while the RR Lyrae K band magnitudes show a well defined linear trend with LogP. Using the Bono et al. (2001) and Bono et al. (2003) theoretical Near-Infrared Period-Luminosity-Metallicity relations we calculate the LMC distance modulus .
Galaxies: individual (LMC) – Galaxies: Formation – Stars: RR Lyrae
Key Words.:
:1 Introduction
RR Lyrae stars are old ( yr), metal-poor () pulsating variables. They are one of the most important steps in the distance ladder, and are also one of the best tracers of the primordial populations of the Milky Way. Their characteristic light curves make them easy to find in large microlensing surveys like the MACHO Project.
Studies of the LMC kinematics (Alves & Nelson 2000, Graff et al. 2000, Gyuk et al. 2000, Hardy et al. 2001, van der Marel et al. 2002) suggest that if they lie in a disk, like the globular clusters, the RR Lyrae stars would show fairly rapid systemic rotation (about km s-1), and a velocity dispersion of about km s-1. If they belong to a metal-poor halo, then the rotation will be low and the velocity dispersion will be about km s-1.
Walker (1992) measured the abundances of 182 RR Lyrae stars from the period-amplitude relation in seven LMC clusters (NGC 2257, Reticulum, NGC 1841, NGC 1466, NGC 1766, NGC 2210, NGC 1835). They fall in the interval -1.7 to -2.3, with the mean value [Fe/H]= dex. Recently, Clementini et al. (2003) measured metallicities of 101 LMC field, RR Lyrae stars using low-resolution spectra obtained with the Very Large Telescope. They found metallicities between -0.5 and -2.1, with an average value of [Fe/H]= dex.
The distance to the LMC has been the subject of many studies. There is a well known discrepancy of 0.2—0.3 mag between distances derived from Population I and II indicators. Population I distance indicators give a long distance modulus for the LMC, in the range from 18.5 to 18.7 mag, while Population II indicators support a shorter modulus in the range from 18.4 to 18.6. Clementini et al. (2003) summarized most of the distance determinations and using accurate photometry of 101 RR Lyrae stars, reported a common value of mag.
The goal of this project is to measure the properties (kinematics, distributions, abundances and distances) of the RR Lyrae stars in six selected inner region fields of the LMC. To use the LMC RR Lyrae as tracers of a putative LMC halo is not a new idea. Kinman et al. (1991), and Feast (1992) review the problem of measuring their kinematics. Because these LMC RR Lyrae stars are faint (), ten years ago this project was beyond the reach of the best telescopes. Metallicities and distance determination are additional products of this project.
2 Observations and Reductions
2.1 Selection of the sample
We have chosen our sample of RR Lyrae stars using the MACHO database from six central fields of the LMC bar, at distances from 0.7 to 1.5 degrees away from the rotation center. As a control sample for the LMC kinematic properties, we also selected known long period variables (LPV) from MACHO and OGLE (Zebrun et al. 2001) and Cepheids from the MACHO catalog in the same fields. The observed fields are shown on Fig. 1 and are summarized in Table 1. The fields are centered on the source stars of the LMC microlensing events discovered by MACHO Project (Alcock et al. 2001). The number of stars for each field with spectra and/or K band magnitudes is also given in the last column.
| Event | RA | DEC | MJD(SOFI) | ExpTime (min) | No of Exp. | Date(FOR1) | ExpTime (min) | No of Exp. | RRLyr’s |
|---|---|---|---|---|---|---|---|---|---|
| LMC-1 | 05:14:44.3 | -68:48:01 | 51594.107748 | 20 | 2 | 10.1.2003 | 20 | 2 | 23 |
| LMC-4 | 05:17:14.6 | -70:46:59 | 51594.129148 | 20 | 2 | 11.1.2003 | 20 | 2 | 13 |
| LMC-7 | 05:04:03.4 | -69:33:19 | 51594.204557 | 20 | 2 | 11.1.2003 | 20 | 2 | 5 |
| LMC-9 | 05:20:20.3 | -69:15:12 | 51594.172106 | 20 | 2 | 11.1.2003 | 20 | 2 | 13 |
| LMC-12 | 05:33:51.7 | -70:50:59 | 51594.214012 | 20 | 2 | 12.1.2003 | 20 | 2 | 8 |
| LMC-14 | 05:34:44.0 | -70:25:07 | 51594.254683 | 20 | 2 | 12.1.2003 | 20 | 2 | 13 |
The distribution over the period of our RR Lyrae stars is shown on Fig. 2. The solid line represents RRab stars, while the dotted line marks RRc+RRe stars. Our sample of RRab stars covers the interval from 0.35 days to the 0.75 days (only one star has period of 0.97 days), with a mean value of days, the RRc stars range from 0.25 to 0.43 days and the mean period is days. The mean periods of our RRab Lyrae sample is in good agreement with values determined by the MACHO team from approx. 7900 RR Lyrae stars: days (Alcock et al. 1996) and the recent work of the OGLE team (Soszynski et al. 2003): days. For RRc stars the mean periods are days, from the MACHO team, and , from the OGLE team. Therefore, despite the limited sample number, the properties of RR Lyrae stars in our sample should be representative of the whole population.
Soszynski et al. (2003) present the period distribution for OGLE RR Lyrae in the LMC fields and in old LMC globular clusters. Their period distribution and mean periods of field LMC RR Lyrae agree with those measured by Alcock et al. (2000). However, we note that the LMC globular cluster RR Lyrae show a different period distribution, peaked at shorter periods both for RRab and RRc stars. This difference is worth noticing, because it suggests that globular clusters and field RR Lyrae in the LMC do not trace similar populations. Below we will show that there are also differences in metallicities and kinematics.

2.2 Spectroscopy
The spectroscopic observations were taken with the FORS1 multi-slit spectrograph at the ESO Very Large Telescope (VLT) Unit Telescope 1 (UT1), during the nights of 10 and 11 January 2003. We used the GRIS_600B+12 grating, that gives and covers from to Å. This resolution is adequate for the measurement of radial velocities even in the broad-lined RR Lyrae spectra, provided that a good S/N is achieved. In total, two exposures of 20 minutes were obtained for each mask containing 5-10 RR Lyrae stars. As the FORS1 multi-slit spectrograph can take spectra of up to 19 objects simultaneously, we placed LPV and Cepheid variables on the remaining slits. We observed 58 RR Lyrae, 5 Cepheids, and 23 Miras of the LMC. The spectra of RR Lyrae variables are shown in Fig. 3. The spectra of Cepheid stars and LPV’s are shown in Fig. 4 and Fig. 5.


A substantial fraction of the observing time was devoted to calibrations. Two masks containing RR Lyrae of the globular cluster Cen (Clement et al. 2001, Mayor et al. 1997, Kaluzny et al. 1997) were acquired using the same setup. Thus, high quality spectra of 17 Cen RR Lyrae (6 RRab, 7 RRc, and 4 RRe) were secured. In addition, a few repeat observations of some of the RR Lyrae stars were taken, in order to assess the velocity errors. The spectra of Cen RR Lyrae stars are presented in Fig. 6.

The spectral data were reduced using the standard packages within IRAF. HeNeAr lamps were used for the wavelength calibration, which typically have 14 usable lines that yield 0.2 Å rms. The final extracted and calibrated spectra have on average S/N = 15. This is adequate to measure individual velocities good to about km s-1.
2.3 Photometry
The -band dataset was obtained with the SOFI infrared imager at the European Southern Observatory’s New Technology Telescope; SOFI has a 10241024 array with a pixel size of 0.292 arcsec, with a total field of view arcmin. We obtained two measurements for each star, in order to define the mean magnitude. The photometry was derived with DAOPHOT II (Stetson 1994), and calibrated with observations of 6 standard stars (Persson et al. 1998). The 1- standard deviation of the calibration solution is 0.028 mag. The V and I bands photometry was obtained with WFPC2 on board the HST (P.I. Cook, Alves at al. 2002). The HST photometry is single epoch F555W and F814W WFPC2 observations. Photometry with DAOPHOT II and the standard calibrations to the ground based system result in uncertainties of the order of 0.02-0.03 mag. The details of the data reduction, error and completeness analysis of the IR and HST photometry are given in Alves at al. (2002).
3 Color - magnitude diagrams
Fig. 7 shows the , color-magnitude diagram (CMD). Well populated red giant branch (RGB) up to and and red clump (RC) at are clearly visible. The variables from our sample, which have K measurements are superimposed: the open circles mark Cepheid stars, the LPV stars are shown as squares, solid circles indicated RRab Lyrae stars, crosses are for RRc stars and triangles are for Red Giant Branch stars + RR Lyrae (RGB+RR Lyr) blends. Everywhere in this paper we use optical mean V, I and R magnitudes of variable stars, taken from the MACHO and OGLE databases. The LPV stars are located at the tip of the giant branch, RR Lyrae and Cepheid stars are located within the Cepheid instability strips. Because of the difference between FORS1 multi-slit spectrograph (6.8 6.8 arcmin) and SOFI NTT fields (5 5 arcmin) only part of the stars with spectra have K magnitudes. In total we have the K band magnitudes for 38 RR Lyrae stars, 5 Cepheids and 12 LPV stars from MACHO database. Since we are using V and I mean magnitudes of the variable stars taken from MACHO and OGLE databases there is possibly a systematic error of up to 0.10 mag, because of the differences between MACHO and OGLE V and I mean magnitudes of the variable stars and HST V and I photometry.

Cross-identification with the OGLE database yields 70 additional variables in these fields. On the color-magnitude diagram (Fig. 8) they are overploted with large open circles. As can be seen most of them are bright LPV stars. Unfortunately, in OGLE database we could not find accurate classifications, periods or amplitudes of these stars.

Several OGLE variable stars lie well below the LMC red giant branch on Fig. 8. They are at the limit of the I-band photometry, and thus probably mismatched variables or noisy measurements.
3.1 Boundaries of the instability strip
The knowledge of the precise location of the RR Lyrae zone is a good test for the stellar pulsation theory. Using the calibration of Montegriffo et al. (1998) we calculated the effective temperature and bolometric magnitude of RR Lyrae stars which have colors and K magnitudes. We assume E(B-V)=0.11 (Clementini et al. 2003). A plot of () and (, Log ) of these variables is show on Fig. 9. Open circles are for RRab stars, crosses stand for RRc stars. The theoretical value of the blue edge of the RR Lyrae instability strip is located near the (Smith 1995), while the red edge is near 6100 (dashed lines on Fig. 9). Our calculations are in good agreement with the limit for the red edge: we calculated . For the blue edge, however we have five stars which are hotter, than the theoretical blue limit. Careful check of these stars show that three of them could be anomalous - one is an RRab with large period: P=0.616 days and relatively small amplitude: mag, two are RRc stars with larger than usual amplitudes in both V and R: . Taking into consideration the errors of our colors and calibration to the theoretical plane, we estimate the error of our determination to be approx. 100K. Since our mean K-band magnitudes are based on two random measurements, this can add additional uncertainty of appox. 0.15 in colors or 250K in temperature. Thus we calculate for the blue edge .

3.2 Period-Amplitude relations
The period–amplitude diagram, known as the Bailey diagram, is a widely used tool for analyzing features of RR Lyrae stars. Empirical and theoretical studies suggest that the distribution of RR Lyrae stars in the Bailey diagram depends on their metallicity. The period - (from MACHO databases) amplitude diagram of the RR Lyrae stars in our fields is shown in the left panel of Fig. 10. Since we have only two K images per fields, it was not possible to determine the K band amplitudes. In general, there is a clear separation between RRab (open circles), RRc (crosses) and RRe (filled squares). Fundamental mode RR Lyrae stars present an anti-correlation between the period and amplitude, which seems to be linear. Soszynski et al. (2003) found non-linearity in these diagrams using approx. 7600 RR Lyrae stars in the LMC. Our result is probably due to our small sample (only 70 stars). The width of the sequence is believed to be an effect of a spread in the metal content, which means that our sample has a relatively small metallicity spread. For RRc stars, we also found a weak anti-correlation of amplitudes and periods (Soszynski et al. 2003).
In the middle and right panels of Fig. 10 the (V-K) color - LogP and the (V-K) color - amplitude diagrams are shown. In general, these relations follow the same trends as amplitudes, although they are not so clearly visible, forming overlapping sequences.
According to the theoretical predictions of Bono et al. (1997) the luminosity amplitude depends marginally on the metallicity up to [Fe/H]=0.7 dex. For more metal-rich stars an increase in the metallicity causes a decrease in the amplitudes.

Our sample was derived from a preliminary classification of MACHO variables. Subsequent analysis has shown MACHO star 11.8750.1425 is not an RRab, while MACHO star 80.648.3667 is an RRab (Alcock et al. 2003). MACHO star 2.5507.6257 has not been confirmed to be an RRc, nor has MACHO star 11.8750.1425. These stars are omitted from the plots and calculations in the following sections.
3.3 Period-luminosity relations
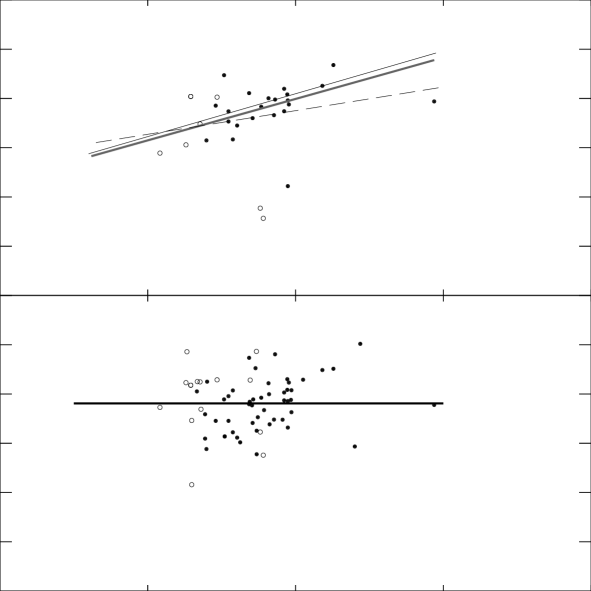
The average apparent luminosities (coming from MACHO databases) of 70 RR Lyrae stars is and average K luminosities of 33 RR Lyrae stars is . The RGB+RR Lyrae blends are not used for this calculation. The average MACHO database V luminosity of our sample is in agreement with Clementini et al (2003) determination ( ) with a systematic shift of 0.038. Fig. 11 shows vs. LogP and K-band vs. LogP, with magnitudes corrected for reddening. RRab Lyrae star are shown with solid circles, the RRc stars with open ones. Since the sample of RRc stars is limited, their periods are fundamentalized. There is no obvious relation between magnitude and LogP, while the RR Lyrae K band magnitudes show a well defined linear trend. Bono et al. (2001) published a new theoretical near-infrared Period-Luminosity-Metallicity relation and more recently it was improved on the basis of up-to-date pulsating models (Bono et al. 2003). The predicted theoretical relation for fundamental mode pulsators (solid line) is overploted on Fig. 11. The dashed line represents the best fit for RRab and fundamentalized RRc stars obtained using all data, the thin line is the same fit after the three faint outliers and RRab star with very large period were excluded. The agreement with Bono et al. (2003) prediction is good, when we exclude these four outliners. Following the same procedure as in Bono et al. (2001) we calculated = 0.332 at LogP= -0.30, obtaining an infrared distance modulus of . Here, we adopted (Clementini et al 2003) and dex (see Sec 8) and luminosity . The calculated distance is comparable within the errors with most of the LMC distance determinations from the literature.
4 Radial Velocities
It is well known (Smith 1995) that the line spectrum of RR Lyr star undergoes a cyclic change during the pulsation cycle. The observed radial velocity depends also upon which spectral lines are measured. In some phases of the pulsation cycle, the velocities based on measurements of the Balmer lines are systematically different from those based on metallic lines. The reason is that lines of different elements and ionization states arise from different levels within the moving stellar atmosphere. The difference is largest during rising light. The difference in the radial velocities of lines that form at high and low optical depths is due to a radial velocity gradient. This phenomenon also causes a systematic shift in the phase of maximum velocity (Bono et al. 1994).
There are two commonly used techniques to measure radial velocities: cross-correlation technique, which computes the radial velocities via Fourier cross correlation, and by centroiding the individual spectral lines. We measured the radial velocities of our sample using both of these techniques. The comparison between radial velocities measured by two methods for Cen RR Lyrae stars is shown on Fig. 12. The cross-correlation velocities are corrected for heliocentric velocity and are shifted to the mean velocity of Cen km s-1 (Mayor at al. 1997). In general, the agreement is good, except for a few cases with larger differences. We calculated the phases of all RR Lyrae stars at the moment of our observations using ephemeredes, amplitudes and periods from Kaluzny et al. (1997). As expected, these outlying stars (V266, V88, V271, V275 and V267 see Table 2) are around maximum light and the radial velocities of CaII-lines are significantly different from those of H-lines. In general, the two techniques yield similar results within 15 km s-1, but the individual errors of measurements are larger when we use the cross-correlation technique. The result is not surprising, taking into account the relatively broad lines of RR Lyrae stars.

Therefore, we prefer to measure the radial velocities as an unweighted mean value of individual radial velocities of H, H, H, and CaII K 3933.66 Å, excluding the Ca line velocities in the cases of rising light. We measured radial velocities of 58 RR Lyrae stars, 5 Cepheids and 33 LPV’s stars in our six LMC fields. The internal errors measured from the different lines range from 1 to 33 km s-1.
The pulsation of a RR Lyrae star induces a periodic variation in the radial velocity of the star. The radial velocity curve roughly reflects the light curve, with minimum radial velocity coming at maximum visible light for RRab variables. For RRc stars the maximum radial velocity is reached about 0.1 of a cycle after maximum light. The velocity amplitudes for RRab stars are between 60-70 km s-1. and for RRc stars are between 30-40 km s-1 (Smith 1995). Therefore, it is necessary to correct such measured radial velocities for this large velocity amplitude through their cycle of pulsation. Liu (1991) derived a correlation between the pulsational velocity vs. V light amplitudes for RRab stars. Unfortunately, we have only 6 RRab stars in our control sample of Cen RR Lyrae’s and two of them have only one line measured accurately. We used the Liu (1991) calibration to correct the raw velocities of these four stars and to estimate how the velocity dispersion will change after the correction. The mean value of measured radial velocities is km s-1. The pulsation amplitudes are between 67 and 83 km s-1 and the mean value of the corrected velocities is km s-1. For RRc stars Liu (1991) says that there should be a similar relation, but he had too few data to derive it. Although the pulsation amplitudes are large since the RR Lyrae are observed in random phase, the velocity dispersion does not change so much. The data for Cen stars are summarized in Table 2.
| Name | OGLE | Period | Type | Phase | |||||
|---|---|---|---|---|---|---|---|---|---|
| V139 | 118 | 14.35 | 0.71 | 0.6768 | RRab | 278 | 4 | 0.09 | 282 |
| V111 | 136 | 14.46 | 0.60 | 0.7629 | RRab | 228 | 16 | 0.16 | 238 |
| V118 | 109 | 14.43 | 1.00 | 0.6116 | RRab | 218 | 27 | 0.54 | 263 |
| V88 | 210 | 14.23 | 0.67 | 0.6904 | RRab | 266 | 13 | 0.97 | 273 |
| V144 | 112 | 14.41 | 0.48 | 0.8352 | RRab | 239 | 0.75 | 275 | |
| V113 | 128 | 14.41 | 1.20 | 0.5733 | RRab | 148 | 0.76 | 209 | |
| V273 | 139 | 14.60 | 0.39 | 0.3672 | RRc | 237 | 3 | 0.09 | |
| V153 | 140 | 14.55 | 0.44 | 0.3863 | RRc | 245 | 15 | 0.24 | |
| V264 | 108 | 14.75 | 0.45 | 0.3214 | RRc | 211 | 5 | 0.26 | |
| V145 | 130 | 14.56 | 0.44 | 0.3732 | RRc | 230 | 10 | 0.36 | |
| V157 | 138 | 14.56 | 0.45 | 0.4066 | RRc | 247 | 13 | 0.66 | |
| V275 | 149 | 14.50 | 0.34 | 0.3782 | RRc | 214 | 17 | 0.80 | |
| V271 | 132 | 14.44 | 0.43 | 0.4431 | RRc | 229 | 12 | 0.97 | |
| V119 | 106 | 14.65 | 0.29 | 0.3059 | RRe | 216 | 2 | 0.26 | |
| V166 | 142 | 14.54 | 0.13 | 0.3414 | RRe | 242 | 8 | 0.51 | |
| V267 | 121 | 14.46 | 0.25 | 0.3159 | RRe | 253 | 3 | 0.78 | |
| V266 | 115 | 14.54 | 0.27 | 0.3524 | RRe | 258 | 6 | 0.86 |
The same test was performed on the sample of RRab stars in the LMC. We used the MACHO database to derive the phases of the stars in the moment of our observations. The mean value of measured radial velocities is km s-1, the mean value of the corrected velocities is km s-1. The difference in the velocity dispersions for corrected and un-corrected radial velocities is small.
We decided to use un-corrected radial velocities for the calculation of the velocity dispersion for the whole sample, rather than correcting only part of the sample. The comparison of the velocity dispersion of RR Lyrae in the LMC with the other stellar populations will then be used to test for the presence of a stellar halo around the galaxy.
The data for the LMC RR Lyrae stars and Cepheids are summarized in Table 3, and in Table 4 we list the radial velocities of OGLE LPVs.
In columns 2,3,4 and 5 of Table 3 are mean V magnitude, amplitude, period of the pulsation and type of the star taken from MACHO database. Note uncertain/wrong classification of 11.8750.1425,80.6468.3667 and 2.5507.6257 (see Sec 3.1 and 3.2).
| MACHO name | Period(d) | Type | (km/s) | |||
|---|---|---|---|---|---|---|
| 10.3802.311 | 18.99 | 0.43 | 0.5460 | RRab | 182 | 10 |
| 10.3802.339 | 19.37 | 0.71 | 0.5120 | RRab | 173 | 6 |
| 10.3802.446 | 19.49 | 0.45 | 0.3080 | RRc | 82 | 13 |
| 10.3922.978 | 19.09 | 0.48 | 0.5568 | RRab | 315 | |
| 10.3923.351 | 19.24 | 0.34 | 0.3340 | RRc | 144 | 19 |
| 11.8622.757 | 19.11 | 0.34 | 0.6860 | RRab | 178 | 18 |
| 11.8623.3792 | 19.31 | 0.38 | 0.6149 | RRab | 187 | 11 |
| 11.8623.779 | 19.20 | 0.38 | 0.6150 | RRab | 196 | 11 |
| 11.8623.826 | 18.95 | 0.38 | 0.5902 | RRab | 288 | 20 |
| 11.8743.1422 | 20.27 | 0.56 | 0.3396 | RRc | 179 | 11 |
| 11.8744.658 | 18.92 | 0.25 | 0.4155 | RRc | 312 | 8 |
| 11.8744.752 | 19.14 | 0.37 | 0.2809 | RRe | 210 | 9 |
| 11.8744.830 | 19.47 | 0.48 | 0.5510 | RRab | 330 | 19 |
| 11.8749.1208 | 19.56 | 0.82 | 0.4757 | RRab | 257 | 23 |
| 11.8749.1324 | 19.63 | 0.43 | 0.5120 | RRab | 282 | |
| 11.8750.1425 | 19.26 | 0.09 | 0.3490 | RRab | 270 | 28 |
| 11.8750.1672 | 19.62 | 0.26 | 0.3400 | RRc | 231 | 14 |
| 11.8750.1827 | 19.74 | 0.30 | 0.5186 | RRab | 233 | 11 |
| 11.8750.2045 | 19.81 | 0.95 | 0.4763 | RRab | 267 | 33 |
| 11.8870.1275 | 19.33 | 0.74 | 0.4638 | RRab | 247 | 19 |
| 11.8871.1096 | 19.43 | 0.74 | 0.5473 | RRab | 291 | |
| 11.8871.1122 | 19.71 | 0.70 | 0.5010 | RGB+RR | 294 | |
| 11.8871.1299 | 19.61 | 0.56 | 0.5960 | RGB+RR | 233 | 22 |
| 11.8871.1362 | 19.61 | 0.31 | 0.6064 | RRab | 339 | 8 |
| 11.8871.1447 | 19.59 | 0.26 | 0.2640 | RRe | 148 | 6 |
| 11.8871.1516 | 19.46 | 0.59 | 0.5463 | RRab | 309 | |
| 13.5839.1023 | 19.66 | 0.65 | 0.5823 | RRab | 219 | |
| 13.5840.608 | 19.32 | 0.44 | 0.5188 | RRab | 234 | 14 |
| 13.5840.730 | 19.41 | 0.07 | 0.6215 | RRab | 228 | 24 |
| 13.5960.884 | 19.23 | 0.31 | 0.3459 | RRc | 183 | 11 |
| 13.5962.547 | 19.21 | 0.46 | 0.6464 | RRab | 207 | 14 |
| 13.6082.701 | 19.41 | 0.73 | 0.5525 | RRab | 214 | 8 |
| 2.5507.5945 | 19.54 | 0.52 | 0.6234 | RRab | 256 | 10 |
| 2.5507.6046 | 19.63 | 0.80 | 0.4920 | RRab | 338 | 31 |
| 2.5508.3096 | 19.96 | 0.71 | 0.5593 | RRab | 149 | 29 |
| 2.5628.5690 | 19.69 | 0.37 | 0.6156 | RRab | 144 | 18 |
| 2.5628.6276 | 19.91 | 1.08 | 0.4781 | RRab | 135 | |
| 79.5507.1039 | 19.59 | 0.78 | 0.5608 | RRab | 238 | 14 |
| 79.5507.1485 | 19.31 | 0.36 | 0.6234 | RRab | 261 | 9 |
| 79.5507.1580 | 19.46 | 0.53 | 0.9720 | RRab | 209 | 1 |
| 79.5508.427 | 19.73 | 0.73 | 0.5593 | RRab | 200 | 15 |
| 79.5508.534 | 19.52 | 0.48 | 0.5723 | RRab | 169 | |
| 79.5508.682 | 19.89 | 0.20 | 0.7591 | RRab | 161 | 13 |
| 79.5508.735 | 19.78 | 0.86 | 0.5057 | RRab | 215 | |
| 79.5628.1065 | 19.84 | 1.17 | 0.5305 | RRab | 274 | 19 |
| 79.5628.1300 | 19.42 | 0.33 | 0.6160 | RRab | 280 | |
| 79.5628.1597 | 19.51 | 0.38 | 0.2812 | RRe | 179 | 3 |
| 79.5628.1650 | 19.26 | 0.44 | 0.3389 | RRc | 147 | |
| 79.5628.2110 | 19.80 | 0.80 | 0.5260 | RRab | 247 | |
| 80.6347.1940 | 19.21 | 0.49 | 0.4083 | RRc | 184 | 14 |
| 80.6467.2128 | 19.35 | 0.74 | 0.5805 | RRab | 151 | 14 |
| 80.6468.1883 | 18.92 | 0.32 | 0.3346 | RRc | 266 | 11 |
| 80.6468.2616 | 19.21 | 0.39 | 0.3684 | RRc | 199 | 11 |
| 80.6468.3667 | 20.05 | 1.19 | 0.4308 | RRc | 101 | 1 |
| 80.6469.1657 | 19.24 | 0.65 | 0.5804 | RRab | 122 | 12 |
| 80.6469.1712 | 18.84 | 0.38 | 0.7720 | RRab | 232 | |
| 80.6588.2703 | 19.23 | 0.70 | 0.4794 | RRab | 259 | |
| 80.6589.2425 | 19.51 | 0.35 | 0.3497 | RRc | 198 | 11 |
| 80.6348.23 | 15.70 | 0.37 | 4.7348 | Cep | 328 | |
| 80.6468.21 | 15.52 | 0.12 | 3.1557 | Cep | 285 | 6 |
| 80.6468.46 | 15.82 | 0.58 | 3.3587 | Cep | 278 | 6 |
| 11.8622.24 | 15.90 | 0.24 | 2.0921 | Cep | 241 | 34 |
| 11.8870.40 | 16.26 | 0.59 | 2.9827 | Cep | 236 | 10 |
| OGLE name | (km/s) | |
|---|---|---|
| OGLE05145362-6846533 | 214 | 39 |
| OGLE05145091-6850289 | 247 | 10 |
| OGLE05145362-6846533 | 272 | |
| OGLE05144133-6848591 | 261 | 17 |
| OGLE05143819-6849131 | 223 | 40 |
| OGLE0514363-6849378 | 269 | 27 |
| OGLE05143421-685033 | 193 | 31 |
| OGLE05144922-684628 | 160 | |
| OGLE05144133-6848591 | 238 | 1 |
| OGLE05143815-6849217 | 226 | 34 |
| OGLE05143443-6849511 | 207 | 13 |
| OGLE05143421-685033 | 218 | 29 |
| OGLE05041263-6931104 | 164 | 17 |
| OGLE0504633-6931282 | 203 | 49 |
| OGLE05041042-6931483 | 193 | 34 |
| OGLE0504966-6932445 | 224 | 31 |
| OGLE05202161-6912358 | 81 | |
| OGLE05201061-6913378 | 243 | 36 |
| OGLE05202958-6914441 | 218 | |
| OGLE05201862-6916558 | 344 | 2 |
| OGLE05202644-6913122 | 47 | 2 |
| OGLE0520061-6913378 | 143 | 78 |
| OGLE05202958-6914441 | 253 | 32 |
| OGLE05202789-691596 | 211 | 32 |
| OGLE0520484-691531 | 201 | 37 |
| OGLE05202923-6915589 | 277 | 50 |
| OGLE05203023-6916347 | 206 | 4 |
| OGLE05202042-6917356 | 399 | |
| OGLE05344257-702531 | 261 | 26 |
| OGLE05343669-7027283 | 151 | |
| OGLE05343389-7027361 | 213 | |
| OGLE05345159-7026341 | 275 | |
| OGLE05344708-7025235 | 294 | |
| OGLE0534446-7027311 | 174 | 35 |
We discarded 15 RR Lyrae stars that have only one line measured accurately, leaving 43 stars that have 2-4 lines accurately measured. Of the final 43 stars considered, 29 are RRab, 11 are RRc and 3 are RRe according to the MACHO light curves. The same analysis was performed for LPV stars - here we have 23 stars with accurately measured velocities.
In the Fig. 13 the histogram of radial velocities of the whole sample of RR Lyrae and LPV stars are plotted with the solid lines and the selected samples, with the best measured velocities, are shown with the dotted lines. As can be seen the distributions are similar.

For the LMC RR Lyrae we measure km s-1 and km s-1 (Minniti et al. 2003). This is larger than the velocity dispersion of other populations: km s-1 for the LMC LPV stars, km s-1 for Cepheids and km s-1 for Cen RR Lyrae stars. This large velocity dispersion of km s-1 implies that RR Lyrae stars are distributed in a halo population as discussed in (Minniti et al. 2003).
In order to estimate the stability of the measured dispersion, we divide the sample in different sub samples. For the best N=29 RRab stars, km s-1, km s-1; for all N=43 RRab stars, km s-1, km s-1; for the best N=11 RRc stars, km s-1, km s-1; for all RRc stars, km s-1, km s-1.
In Fig. 14 we present radial velocity cumulative distributions of different LMC population as measured from our spectra. The solid line represents LMC RR Lyrae stars, the thin line is for Mira stars. Kolmogorov-Smirnov (KS) comparison of two data sets gives the maximum difference between the cumulative distributions, with a corresponding . KS finds that the LMC RR Lyrae stars distribution is consistent with a normal distribution where the normal distribution has mean km s-1. KS finds that the Mira stars distribution is consistent with a normal distribution where the normal distribution has km s-1. The comparison between the Cen RR Lyrae stars and the LMC RR Lyrae stars shows the maximum difference between the cumulative distributions: is 0.5102 with a corresponding of: 0.003. In the other words we have statistically significant difference with respect to Cen RR Lyrae stars and more data are necessary to confirm or reject the hypotheses of difference between the LMC Mira and RR Lyrae stars.

In general, the amount of rotation compared with the velocity dispersion determines whether a population is kinematically hot, , as opposed to kinematically cold, . The LMC RR Lyrae appear to belong to a kinematically hot population, the present data is insufficient to measure the rotation. The mean velocities are less precise than the velocity dispersion, as seen by comparing the different mean velocities of the Miras, RR Lyrae, and Cepheids. While there may be a hint of rotation for the RR Lyrae based on the sample of the best 43 stars, this signature disappears when we include the extended sample of 58 stars. In order to test how the rotation affects the velocity dispersion, we computed the dispersions independently for the different fields. The results are given in Table 5. In column 2 we put the number () of the stars with the ”best” radial velocity measurements, columns 3 and 4 give their mean velocity () and dispersion (), while next three columns , and are for the whole sample of stars.
| Field | ||||||
|---|---|---|---|---|---|---|
| 10 | 4 | 145 | 45 | 5 | 179 | 85 |
| 11 | 17 | 241 | 55 | 21 | 251 | 54 |
| 13 | 5 | 213 | 20 | 6 | 214 | 18 |
| 2 | 4 | 222 | 93 | 5 | 204 | 90 |
| 79 | 7 | 217 | 42 | 12 | 215 | 45 |
| 80 | 7 | 260 | 25 | 95 | 274 | 37 |
The field with the largest number of RR Lyrae, Field 11, provides the most accurate and stable measurement. The observed confirms that the RR Lyrae have larger velocity dispersion than all other measured populations, even though it is slightly smaller than the overall dispersion observed, . Clearly, more data are needed in order to estimate the rotation component.
In addition, we must point out a difference in the published rotational centers of the LMC, which bears on the measurement of the rotation of the various populations. For example, van der Marel et al. (2002) obtain , , while Alves & Nelson (2000) obtain , . The RR Lyrae maps of Soszynski et al. (2003) indicate that the center of the field RR Lyrae distribution in the LMC is located at: , , offset from these previous determinations.
5 Metallicities
Preston’s (1959) method is a classical method for determining RR Lyrae abundances from low resolution spectra. It measures the difference in spectral type between the CaII K line and the H ( ) lines relative to spectral type standards of approximately solar abundance. Several modifications of the method can be found in the literature – Butler (1975), Freeman & Rodgers (1975), Smith (1995), Clementini at al. (2003). Layden (1994) adopted Freeman & Rodgers (1975) method, which uses the equivalent width (EW) of the CaII K-line (W(K)) and the H-lines (W(H)) to estimate abundances but does not explicitly convert these measurements to spectral types. He derived the relation between W(K), W(H) and metallicities [Fe/H] on the Zinn & West (1984) scale for 142 field RRab Lyrae stars in our Galaxy. Equation 7 given in Layden (1994) is :
where W(K) and W(H) are the equivalent widths of CaII K-line and H-lines respectively, and [Fe/H] is the metallicity in Zinn & West (1984) scale. The a, b, c, and d coefficients are given in Table 8 of the paper for three different cases. The first one calibrates [Fe/H] vs. EW without correction for interstellar contribution to the K line. To avoid the metal line contamination of in the second case, Layden (1994) uses only and to measure the EW of H-lines. And finally in the third one he adds the line, after performing the corrections.
Since we did not observe enough standard stars for calibration, we used the above equation to determine the [Fe/H] of LMC RRab Lyrae stars. Following Layden’s (1994) three step approach, first we measured pseudo-equivalent widths of CaII K line and lines. We used the SPLOT routine in IRAF, fitting the spectral lines with a Voigt profile. The pseudo-EWs were computed by dividing the instrumental fluxes within a small spectral region centered on the selected feature, with the continuum. For RRab stars, the phases of rising light are to be avoided because of the effects of shock waves and/or rapidly changing surface gravity. Using light curves from Kaluzny et al. (1997) for Cen stars and from the MACHO database for LMC RR Lyrae’s we calculated the phases of variable stars at the moment of our observations and rejected all the stars which had phases greater than 0.75. No correction for interstellar contribution to the K line was made, because the resolution of the spectra is not sufficient to separate stellar and interstellar component. To correct the metal line contamination of line, we inspected the line profiles for signs of line doubling or for anomalously broad, shallow shapes. In these cases we calculated [Fe/H], using only mean value of and and the second coefficients of Layden’s calibration.
We observed 17 RR stars in Cen, but only 6 of them are RRab stars. The stars V88 and V111 (Clement et al. 2001 classification) have no CaII K line in their spectrum, the star V144 was observed in two masks, one of them is at phase 0.75. All these stars have [Fe/H] values measured by Butler et al. (1978) from low resolution spectra by classical method and by Rey et al. (2000), which calibrated index of the photometric system vs. metallicity. The mean differences between Rey et al. (2000) metallicities of these stars and our measurements is , between Butler et al. (1978) measurements and ours is , Rey et al. (2000) and Butler et al. (1978) metallicities have a differences . Taking into account the small correction needed for the interstellar K line we should expect sigma closer to 0.1. We have good agreement with spectroscopic measurements, but large discrepancies with Rey et al.(2000) determination. They discuss the large difference in results from different methods and concluded that metallicities of Cen are not accurate. Of course we have only 4 stars, but they support Jurcsik’s (1998) suggestion, who also finds significant discrepancy between metallicities obtained from Fourier decomposition of the light curves and the spectroscopic measurements. Jurcsik’s conclusion is that it is necessary to obtain high-accuracy spectroscopic observations in order to confirm and understand the nature of this difference.
The EW of the LMC RR Lyrae stars were measured independently by two of us (J.B. and M.R.) and the unweighted mean value and the errors of the mean calculated. The average [Fe/H] value of our 23 RRab Lyrae stars is [Fe/H] = dex. The metallicity of another four stars are calculated from Fourier decomposition of the light curves from Alcock et al. (2003) and are added to the spectroscopic measurements. As a result we have 27 metallicity determinations and the mean value is [Fe/H] = dex. The mean metallicity of RR Lyrae stars is in very good agreement with Clementini et al. (2003) average value [Fe/H] = dex. Thus, the field RR Lyrae stars seem to be more metal rich than globular cluster RR Lyrae star population (Walker 1992). Our metallicities are on the Zinn & West (1984) scale and they would be slightly different on the Carretta & Gratton (1997) scale. This would introduce systematic effects to the distance scale, that have been reviewed elsewhere (e.g. Walker 1998, Walker 2003). Based on these considerations, we estimate a global uncertainty of 0.2 dex in the metallicity.
The individual [Fe/H] determinations are given in Table 6. The distribution over the metallicity is shown on Fig. 15 and seems to fit well Gaussian distribution. Of course, more data are necessary to confirm this.

| MACHO name | [Fe/H] | Type | |||
|---|---|---|---|---|---|
| 10.3802.311 | 1.04 | 0.01 | RRab | 17.95 | 1.04 |
| 10.3802.339 | 1.13 | 0.11 | RRab | 18.23 | 1.01 |
| 10.3802.446 | RRc | 18.56 | 0.93 | ||
| 10.3922.978 | 1.87 | RRab | |||
| 10.3923.351 | RRc | 18.47 | 0.77 | ||
| 11.8622.757 | 2.22 | 0.11 | RRab | 17.87 | 1.24 |
| 11.8623.3792 | 1.46 | 0.05 | RRab | ||
| 11.8623.779 | 1.65 | 0.01 | RRab | 17.96 | 1.24 |
| 11.8623.826 | 0.73 | 0.02 | RRab | 18.01 | 0.94 |
| 11.8744.830 | 2.14 | 0.01 | RRab | ||
| 11.8749.1208 | 1.43 | 0.15 | RRab | ||
| 11.8749.1324 | 2.33 | 0.06 | RRab | 18.13 | 1.49 |
| 11.8750.1425 | 2.04 | 0.08 | RRab | 18.12 | 1.14 |
| 11.8750.1827 | 2.10 | 0.18 | RRab | 18.42 | 1.33 |
| 11.8750.2045 | 0.69 | 0.04 | RRab | ||
| 11.8870.1275 | 1.67 | 0.03 | RRab | ||
| 11.8871.1362 | 0.98 | 0.21 | RRab | ||
| 13.5840.608 | 1.08 | 0.06 | RRab | ||
| 13.5840.730 | 1.20 | 0.19 | RRab | ||
| 13.5840.768 | RRab | 18.20 | 1.45 | ||
| 13.5961.435 | RRab | 18.24 | 0.60 | ||
| 13.5961.511 | RRab | 17.66 | 1.44 | ||
| 13.5961.623 | RRab | 18.06 | 1.18 | ||
| 13.5961.648 | RRab | 18.08 | 1.31 | ||
| 13.5961.720 | RRab | 18.13 | 1.29 | ||
| 13.5962.547 | 1.31 | 0.04 | RRab | ||
| 13.5962.656 | RRab | 17.90 | 1.44 | ||
| 2.5507.6046 | RRab | 18.07 | 1.55 | ||
| 2.5507.6257 | RRc | 18.22 | 1.53 | ||
| 2.5627.4847 | RRc | 19.22 | 0.76 | ||
| 2.5628.5690 | RRab | 18.89 | 0.80 | ||
| 2.5628.6276 | 0.57 | 0.01 | RRab | 18.43 | 1.39 |
| 79.5507.1485 | 1.85 | 0.11 | RRab | ||
| 79.5507.1580 | RRab | 18.03 | 1.43 | ||
| 79.5508.427 | 1.66 | 0.17 | RRab | ||
| 79.5508.534 | 1.31 | 0.04 | RRab | ||
| 79.5508.682 | 1.92 | 0.06 | RRab | ||
| 79.5508.735 | 1.51 | 0.13 | RRab | ||
| 79.5627.1761 | RRc | 19.11 | 0.62 | ||
| 79.5628.1065 | 1.24 | RRab | |||
| 79.5628.1300 | RRab | 18.02 | 1.40 | ||
| 79.5628.1650 | RRc | 17.98 | 1.24 | ||
| 79.5628.2110 | RRab | 18.28 | 1.52 | ||
| 80.6468.2582 | RRab | 18.17 | 1.44 | ||
| 80.6468.2616 | RRc | 17.99 | 1.22 | ||
| 80.6468.2765 | RRc | 18.26 | 0.97 | ||
| 80.6468.2799 | RRab | 17.76 | 1.64 | ||
| 80.6468.3667 | RRc | 18.51 | 1.54 | ||
| 80.6469.1657 | 1.90 | 0.09 | RRab | 18.00 | 1.25 |
| 80.6469.1712 | -1.61 | 0.01 | RRab | ||
| 80.6588.2703 | 0.91 | 0.16 | RRab |
It is well known that the absolute magnitude of an RR Lyrae star, , is a function of metallicity [Fe/H] (Sandage 1981). Recently, Olech et al. (2003), using new photometry of RRab Lyrae stars in Cen, derived the relation in the form : . Despite the large scatter, in general our data agree with this relation as can be seen in Fig. 16. To calculate , we used the LMC distance modulus of 18.48 determined in Sec. 3 and the reddening of E(B-V)=0.11 (Clementini et al. 2003).

In the ,[Fe/H] plot, however, the relation is flatter than in the V band as can be seen on the bottom panel of Fig. 16. The best fit of our 9 points gives: dex. There is an indication that the absolute K magnitude is less sensitive to the metallicity.
6 Conclusions
We measure a velocity dispersion of km s-1 for 43 LMC RR Lyrae. This dispersion indicates a kinematically hot population, similar to the Milky Way, where the RR Lyrae are distributed in the halo. This velocity dispersion is also larger than that of the old LMC globular clusters.
We measure a mean dex based on field LMC RR Lyrae. This measurement agrees with the recent result of Clementini et al. (2003), who found dex based on field RR Lyrae in the LMC. This mean metallicity is different from the globular clusters: Walker (1992) finds dex based on RR Lyrae in seven LMC globular clusters. This difference, coupled with the difference in the kinematics and the period distributions, suggests that field RR Lyrae and globular clusters trace different populations in the LMC.
We measure the mean -band magnitudes of 37 field RR Lyrae in the LMC, . Based on this mean magnitude and on the theoretical near-IR period-luminosity-metallicity relations of Bono et al (2001, 2003), we compute an LMC distance modulus .
Acknowledgements.
JB, DM, and MR are supported by Fondap Center for Astrophysics 15010003. KHC’s work was performed under the auspices of the U.S. Department of Energy, National Nuclear Security Administration by the University of California, Lawrence Livermore National Laboratory under contract No. W-7405-Eng-48. The authors gratefully acknowledge the comments by the referee Dr. Bono and comments by M. Catelan and H. Smith.References
- (1) Alcock, C., et al. 1996, AJ, 111, 1146
- (2) Alcock, C., et al. 2000, AJ, 542, 257
- (3) Alcock, C., et al. 2001, Nature,414,617
- (4) Alcock, C., et al. 2003, ApJ, 598, 597
- (5) Alcock, C., et al. 2004, ApJ, 127, 334
- (6) Alves, D., & Nelson, C. 2000, ApJ, 542, 789
- (7) Alves, D. R., Rejkuba, M., Minniti, D., Cook, K.H. 2002, ApJ, 573, L54
- (8) Bono,G., Stellingwerf R. 1994, ApJS, 93, 233
- (9) Bono,G., Caputo,F., Castellani,V., Marconi,M. 1997, ApJ, 479, 279
- (10) Bono,G., Caputo,F., Castellani,V., Marconi,M., Storm,J. 2001, MNRAS, 326, 1183
- (11) Bono,G., Caputo,F., Castellani,V., Marconi,M., Storm,J., et al. 2004,MNRAS, 344, 1097
- (12) Butler, D. 1975, AJ, 200, 68
- (13) Butler, D., Dickens, R.J., Epps, E. 1978, AJ, 225, 148
- (14) Carretta, E. & Gratton, R. 1997, A&AS, 121, 95
- (15) Clement, C. M., Muzzin, A., Dufton, Q., Ponnampalam, T., Wang,J., al. 2001, AJ, 122, 2587
- (16) Clementini, G., Gratton, R., Bragaglia, A., Carretta, E., at al. 2003, AJ, 125, 1309
- (17) Feast, M. 1992, in ”Variable Stars and Galaxies”, ed. Brian Warner (ASP: San Francisco), ASP Conf. Series 30, p. 143
- (18) Freeman, K. C., Rodgers, A. 1975, ApJ, 201, L71
- (19) Graff, D. S., Gould, A., Suntzeff, N. B., Schommer, R., & Hardy, E. 2000, ApJ, 540, 211
- (20) Gyuk, G., Dalal, N., & Griest, K. 2000, ApJ, 535, 90
- (21) Hardy, E., Alves, D., Graff, D., Suntzeff, N., Schommer, R. 2001, ApJSS, 277, 471
- (22) Jurcsik, J., 1998, ApJ, 506, 113
- (23) Kaluzny, J., Kubiak, M., M. Szymanski, M., Udalski, A., Krzeminski, W., et al. 1997, A&ASS, 122, 471
- (24) Kinman, T., Stryker, L., Hesser, J., Graham, J., Walker,A., at al. 1991, PASP, 103, 1279
- (25) Layden, A. 1994, AJ, 108, 1016
- (26) Liu, T. PASP 1991, 103, 205
- (27) Mayor, M., Meylan, G., Udry, S., Duquennoy, A., Andersen, J., at al. 1997, A&A, 114, 1087
- (28) Minniti, D., Borissova, J., Rejkuba, M., Alves, D., Cook, K.H., Freeman, K.C. 2003, Science, 301, 1508
- (29) Montegriffo, P., Ferraro, F., Origlia, L., Fusi Pecci, F. 1998, MNRAS, 297, 872
- (30) Olech, A., Kaluzny, J., Thompson, I.B., Schwarzenberg-Czerny, A. 2003, MNRAS, 345, 86O
- (31) Persson, S., Murphy, D., Krzeminski, W., Roth, M., Rieke, M. 1998, AJ, 116, 2475
- (32) Preston, G. 1959, ApJ, 130, 507
- (33) Rey, S., Lee, Y., Joo, J., Walker, A., Baird, S. 2000, AJ, 119, 1824
- (34) Sandage, A. 1981, ApJ, 244, L23
- (35) Smith, H. A. 1995, “The RR Lyrae Stars” (Cambridge Univ. Press)
- (36) Soszynski, I., Udalski, A., Szymanski, M., Kubiak, M., Pietrzynski, G., et al. 2003, Acta Astron., 53, 93
- (37) Stetson, P. 1994, PASP, 106, 250
- (38) van der Marel, R. P., Alves, D. R., Hardy, E., Suntzeff, N. B. 2002, AJ, 124, 2639
- (39) Walker, A. 1992, ApJ, 390, L81
- (40) Walker, A. 1998, astro-ph/9808336
- (41) Walker, A. 2003, astro-ph/0303011
- (42) Zebrun et al. 2001, Acta Astron., 51, 317
- (43) Zinn, R., & West, M.J. 1984, ApJS, 55, 45