11email: tsgeorg@astro.bas.bg 22institutetext: Astronomisches Institut der Ruhr-Universität Bochum, Universitätsstr. 150, 44780 Bochum, Germany
22email: bomans@astro.ruhr-uni-bochum.de
BVR photometry of the resolved dwarf galaxy Ho IX ††thanks: This work is a part of a joined project between the Astronomical Institute of the Ruhr-University in Bochum and the Institute of Astronomy of the Bulgarian Academy of Sciences for the study of nearby dwarf galaxies.
We present BVR CCD photometry down to limiting magnitude B mag for 232 starlike objects and 11 diffuse objects in a field of Ho IX. The galaxy is a gas-rich irregular dwarf galaxy possibly very close to M 81, which makes it especially interesting in the context of the evolution of satellite galaxies and the accretion of dwarf galaxies. Investigations of Ho IX were hampered by relatively large contradictions in the magnitude scale between earlier studies. With our new photometry we resolved these discrepancies. The color magnitude diagram (CMD) of Ho IX is fairly typical of a star-forming dwarf irregular, consistent with earlier results. Distance estimates from our new CMD are consistent with Ho IX being very close to M 81 and therefore being a definite member of the M 81 group, apparently in very close physical proximity to M 81.
Key Words.:
Galaxies: individual: Ho IX – Galaxies: evolution – Galaxies: dwarf – Galaxies: photometry1 Introduction
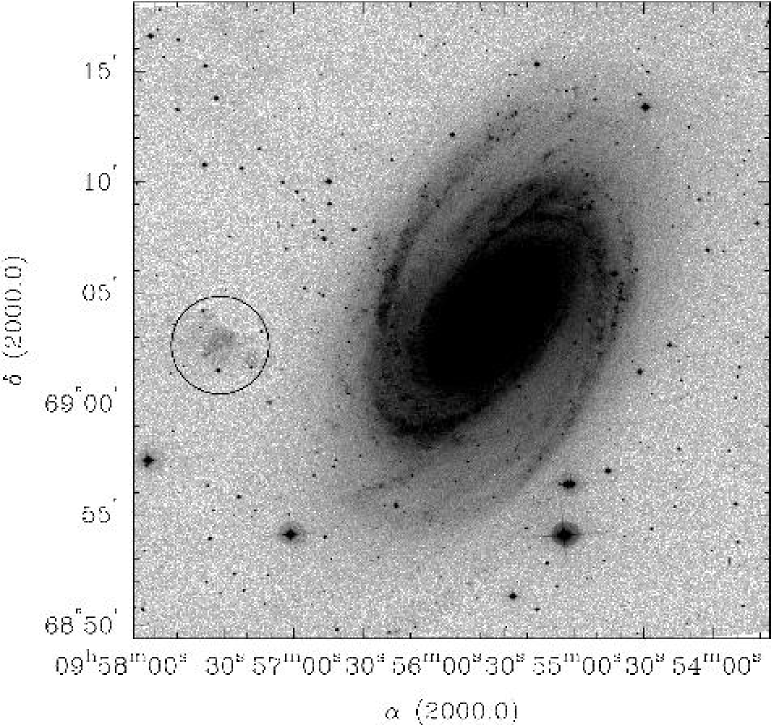
The dwarf irregular galaxy Ho IX = DDO 66 = UGC 5336 = PGC 28757 is a probable close companion of the nearby spiral galaxy M 81. It has an apparent size of about 2.6′ by 2.2′, a total magnitude of B = 14.41 mag, integrated colors of B-V = 0.2, U-B = , and a foreground extinction of A Paturel96 (Paturel et al. 1996). Ho IX is a possibly gas-rich ( mag) and low-luminosity (M mag) irregular galaxy with few prominent young stellar associations and low overall surface brightness () Hopp87 (Hopp & Schulte-Ladbeck 1987). The projected location of Ho IX on the sky is very near to M 81 (see Fig. 1) and coincides with one of the neutral hydrogen clouds floating around M 81 Yun94 (Yun et al. 1994). It is therefore very probable, that Ho IX has a very small physical distance from M 81. The complicated H I structure near M 81 makes any association of H I to Ho IX quite uncertain. Therefore the radial velocity (given as km s-1 in the NED database), and a distance based on the H I velocity of the H I detection coinciding with Ho IX is at least somewhat doubtful.
The first deep study of the stellar content of Ho IX, consisting of 41 preliminary selected blue and red stars, was made by Sandage (1984) on B and V photographs taken with the Palomar 5m telescope. The Sandage (1984) sample was enlarged and measured on plates of the SAO 6m telescope by Georgiev et al. (1991b). The photometric estimation of the distance modulus, based on the brightest blue and red stars, results in mag, which is practically equal to the distance modulus of M 81 from Cepheid data of mag, corresponding to Mpc Freedman94 (Freedman et al. 1994).
The stellar populations of Ho IX were studied using CCD detectors several times at the beginning of the ‘CCD era’. About 340 stars are measured in B, R, I by Hopp & Schulte-Ladbeck (1987) using the Calar Alto 3.5 m telescope and about 250 in V, I using the 3.6 m CFH Telescope by Davidge & Jones (1989). Hopp & Schulte-Ladbeck (1987) investigated the distribution of the brightest blue and red stars and the color index of the unresolved background in Ho IX. They also found candidates for OB associations. The most remarkable of them is situated to the southeast from the center of Ho IX. The evolved stellar content of Ho IX was studied by Davidge & Jones (1989). They found that the number of evolved stars increases markedly at magnitudes fainter than I mag and suggested this to be a consequence of a decrease in the rate of star formation roughly 50 Myr ago. They also found that the luminosity function of the asymptotic giant branch stars in Ho IX is in good agreement with that measured in the LMC, suggesting that the intermediate-age star-formation history of Ho IX is similar to that of the LMC.
The UIT images of Ho IX at wavelengths 249 nm and 152 nm, reported by Hill et al. (1994), show no prominent young OB associations like those seen in the spiral arms of M 81. They estimated that 60% to 70% of the V-flux of the galaxy is from an old population with an age of about 10 Gyr. The remainder of the stars formed about 20-200 Myr ago. Individual stars measured in additional B and V frames appear to be evolved stars of mass about 12 and an age of about 20 Myr, belonging to the youngest population in the galaxy Ho IX.
However, there are serious uncertainties about the magnitude scale in the field of Ho IX. In an attempt to improve the distance determinations to M 81 and Ho IX, Metcalfe & Shanks (1991) (hereafter MS91) made B, V, R CCD observations of the sample of Sandage (1984) using the 2.5 m Isaac Newton Telescope. They found significant offsets between the magnitude zeropoints of the published data and the zeropoints of their photometry. Generally, the correct zeropoint transfer seems to be a very serious problem in the photometry of resolved galaxies, see also Hopp & Schulte-Ladbeck (1995) and Aparicio et al. (1997).
The goals of the present work are (i) to survey the field of Ho IX with an independent transfer of the magnitude zero point, (ii) uses the new photometry to derive an improved distance to Ho IX, and (iii) construct photometric diagrams and luminosity functions of the blue stars to test the evolutionary status of the stellar content of Ho IX and the possible effects of its proximity to M 81.
2 Observations and reductions
The galaxy Ho IX has been observed with the 2m telescope of the Rozhen National Astronomical Observatory, equipped with a pixel Photometrics CCD camera on Feb 2, 2000. The resulting readout noise is 5.1 e-. The scale is 0.32″/pix, the frame size is 5.4′ by 5.4′. The air mass during the observations was 1.12 and the seeing was 1.4″. The exposure times in B, V and R bands were , , and min, respectively. The exposure times were selected to achieve approximately equal depth in the different bands for stars with intermediate color indices.
The reduction was performed in the same way as described in the papers of Makarova et al. (1997), Georgiev et al. (1997b), and Georgiev et al. (1999) using the Rozhen software Georgiev95b (Georgiev 1995b). This software is an extension of the package PCVISTA of Treffers & Richmond (1989,1997). The reduction of the frames consists of the following steps: cleaning of cosmics, rebinning to a common pixel grid, smoothing the noise and selecting the objects on the basis of their magnitudes, sizes and shapes. Detailed information about the methods, especially of those methods used for photometry, is given in the Appendix A.
The magnitudes were transferred from photometric standard stars in the open cluster NGC 7790 Christian85 (Christian et al. 1985) using an aperture diameter of 33 pix (). The observations of Ho IX and NGC 7790 are made during a stable photometric night at almost equal zenith distances. The color equations, without accounting for the air mass are:
| (1) | |||
| (2) | |||
| (3) |
The aperture size of the presented photometry in Ho IX is 11 pix or . The aperture corrections are between 0.6 and 0.8 mag. On the basis of our previous work we consider our total error (including the photometric error) to be mag in the region of V = 21 mag and 0.2-0.3 mag in the region of V = 23 mag.
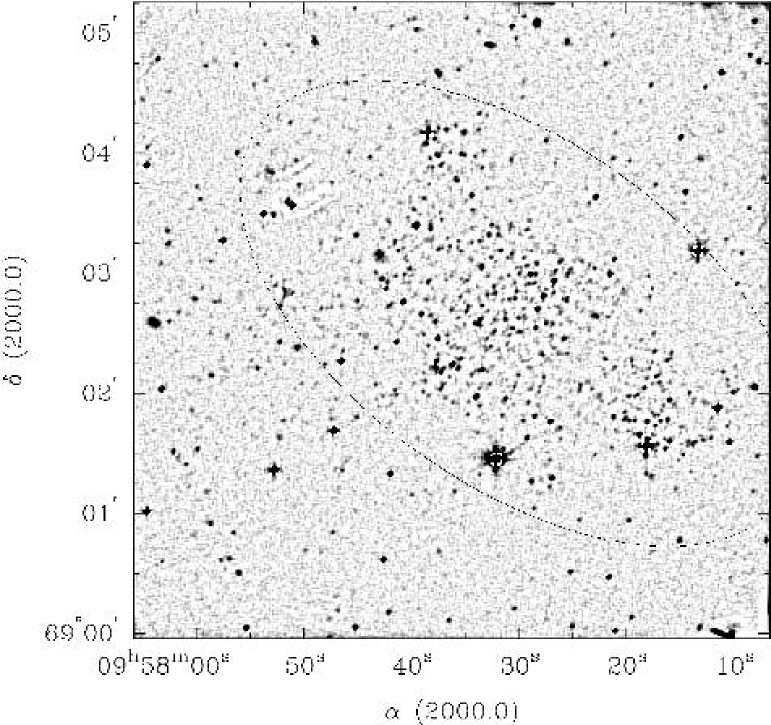
The map of the frame of Ho IX is given in Fig 2. It is made from the sum of the residual frames in the B, V and R bands, derived from the original frames by median filtering with a round window of 33 pix (10″) size. The limiting magnitude of the map is about 24 mag. The center of the frame is shifted to the west for better observation of the faint eastern periphery of Ho IX. Numerous faint stars with V 24 mag are suspected there, but the depth of our frames is not sufficient for reliable photometry at these faint light levels.

| ID | X | Y | V | B-V | V-R | note | ID | X | Y | V | B-V | V-R | note |
|---|---|---|---|---|---|---|---|---|---|---|---|---|---|
| S2 | 633 | 700 | 21.53 | 0.15 | 0.13 | s,d | 30 | 252 | 193 | 21.65 | 0.49 | 0.32 | i |
| S3 | 644 | 664 | 21.42 | 0.08 | 0.41 | s | 56 | 408 | 450 | 21.95 | 0.11 | 0.18 | i |
| S4 | 670 | 674 | 20.66 | 1.63 | 1.18 | s | 73 | 471 | 227 | 21.53 | 0.07 | 0.53 | i |
| S5 | 598 | 637 | 21.09 | 0.36 | 0.39 | s | 77 | 483 | 220 | 21.64 | 1.65 | 1.12 | i |
| S6 | 551 | 634 | 19.77 | 0.08 | 0.25 | s | 80 | 495 | 595 | 21.13 | 1.34 | 0.92 | i,d |
| S8 | 511 | 582 | 20.02 | 0.37 | 0.32 | s | 112 | 610 | 523 | 21.63 | 0.94 | 0.60 | i |
| S9 | 495 | 595 | 21.13 | 1.34 | 0.92 | s,d | 113 | 616 | 464 | 21.68 | 0.78 | 0.55 | i |
| S10 | 489 | 540 | 20.35 | 0.38 | 0.33 | s,d | 115 | 620 | 436 | 21.97 | 0.49 | 0.16 | i |
| S12 | 462 | 500 | 21.08 | -0.03 | 0.16 | s | 116 | 619 | 507 | 21.52 | 0.43 | -0.07 | i |
| S13 | 433 | 482 | 20.69 | 1.49 | 0.84 | s | 137 | 677 | 390 | 22.82 | 0.43 | 0.76 | i |
| S15 | 406 | 460 | 21.32 | 1.41 | 1.07 | s | 138 | 673 | 765 | 21.09 | 1.50 | 1.72 | i |
| S16 | 454 | 358 | 19.13 | 0.00 | 0.39 | s | 171 | 826 | 674 | 21.10 | 0.37 | 0.16 | i |
| S17 | 646 | 523 | 21.18 | 0.00 | 0.20 | s | 175 | 839 | 680 | 21.62 | 1.03 | 0.51 | i |
| S18 | 649 | 492 | 20.72 | 0.06 | -0.00 | s | 179 | 848 | 673 | 21.73 | 0.26 | 0.57 | i |
| S19 | 659 | 472 | 20.40 | 0.39 | 0.46 | s | 182 | 858 | 671 | 21.39 | 0.21 | 0.29 | i |
| S22 | 676 | 447 | 20.52 | 0.30 | 0.41 | s | 5 | 21 | 261 | 19.36 | 1.38 | 1.33 | o |
| S26 | 572 | 373 | 21.39 | -0.08 | 0.22 | s,d | 19 | 166 | 241 | 21.41 | 1.16 | 1.49 | o |
| S27 | 543 | 310 | 21.07 | 0.08 | 0.22 | s | 22 | 181 | 1006 | 20.15 | 0.55 | 0.53 | o |
| S29 | 813 | 695 | 19.98 | 0.79 | 0.73 | s | 47 | 356 | 1005 | 21.02 | 0.51 | 0.63 | o |
| S30 | 862 | 705 | 21.05 | -0.18 | 0.33 | s | 144 | 702 | 916 | 21.28 | 0.13 | 0.27 | o |
| S33 | 862 | 639 | 21.12 | -0.24 | 0.39 | s | 162 | 774 | 1011 | 20.99 | 1.32 | 1.38 | o |
| S34 | 958 | 707 | 19.50 | 1.39 | 1.10 | s | 190 | 880 | 216 | 20.90 | 0.91 | 1.35 | o |
| S35 | 965 | 626 | 21.04 | 0.60 | 0.44 | s | 193 | 888 | 304 | 20.32 | 0.66 | 0.57 | o |
| S36 | 766 | 436 | 20.54 | 0.27 | 0.28 | s | C2 | 999 | 618 | 20.49 | 1.04 | 0.75 | c |
| S37 | 773 | 413 | 21.37 | 0.02 | 0.42 | s | C4 | 649 | 32 | 19.28 | 0.57 | 0.50 | c |
| S38 | 743 | 312 | 20.43 | 1.18 | 0.88 | s | C5 | 945 | 112 | 20.47 | 0.70 | 0.56 | c |
| S40 | 939 | 652 | 17.45 | 0.82 | 0.67 | s | D1 | 220 | 273 | 21.14 | 0.06 | 0.34 | d |
| S41 | 483 | 220 | 21.64 | 1.65 | 1.12 | s | D2 | 241 | 465 | 21.46 | 1.27 | 1.06 | d |
| S44 | 20 | 818 | 18.56 | 1.30 | 1.26 | s | D3 | 264 | 555 | 21.03 | 0.08 | 0.25 | d |
| S45 | 144 | 382 | 19.41 | 1.22 | 1.50 | s | D4 | 396 | 405 | 20.68 | 1.07 | 1.08 | d |
| S46 | 209 | 340 | 19.76 | 1.42 | 1.48 | s | D5 | 410 | 980 | 21.41 | 0.61 | 0.90 | d |
| S48 | 321 | 689 | 17.73 | 1.27 | 0.92 | s | D6 | 532 | 209 | 21.07 | 0.90 | 1.01 | d |
| S49 | 333 | 577 | 19.66 | 1.29 | 1.36 | s | D7 | 745 | 504 | 21.03 | 0.09 | 0.39 | d |
| S50 | 412 | 758 | 20.37 | -0.04 | 0.12 | s | D8 | 877 | 865 | 21.27 | 0.77 | 1.12 | d |
| T10 | 254 | 326 | 18.20 | 0.38 | 0.45 | s |
3 Resolving magnitude scale discrepancies
MS91 made comparisons with the magnitudes of Sandage (1984), Hopp & Schulte-Ladbeck (1987), and Davidge & Jones (1989). All magnitude scales appear linear but with significant offsets:
| (4) | |||
| (5) | |||
| (6) | |||
| (7) | |||
| (8) |
The large standard errors of the offsets may be due to the relatively big pixels of the CCD observations, e.g. in MS91 the pixel scales of the two CCDs used are 0.54″/pix and 0.74″/pix and the photometric aperture is 3x3 pix.
Due to the nonlinear photographic extension of the magnitude scale down to 23 mag, based on standards of 16 mag, the faintest stars in the work of Georgiev et al. (1991b) are fainter than those in Sandage (1984) by about 0.4 mag in V and 0.6 mag in B band. For this reason the red supergiant candidates in Ho IX in Georgiev et al. (1991b) seem redder than in Sandage (1984) by about 0.2 mag.
Using 27 isolated stars down to 23 mag from the Sandage (1984) list, we compare the magnitudes of MS91 with our new photometry. The results are shown in Fig 4. We derive the magnitude zero point shifts to be:
| (9) | |||
| (10) | |||
| (11) |
This also means that compared to the photometry of Sandage (1984) our B magnitude zero point is fainter by 0.05 mag, while our V magnitude zero point is the same.

4 Color-magnitude diagrams
Using an ellipse with a size of 3′ by 5′ and a position angle of (as plotted in Fig. 2) we divided the observed field into two parts – Ho IX and surroundings. The areas inside and outside the ellipse are about 12 and 18. We derived the B, V, and R magnitudes for 166 stars inside the ellipse and 60 stars outside it. The observed number of stars with V = 22-23 mag inside the ellipse is about 3 time higher than outside it. In addition, we identified and measured 6 brighter stars as well as 11 round diffuse objects, which we suspect to be star cluster candidates.
The data for the stars with V22 mag as well as for the diffuse objects are given in Table 1. The first column of Table 1 contains the designation of the star. The letter S means that the number is from the Sandage (1984) list. Numbers larger than S41 as well as those beginning by T correspond to stars noted in Georgiev et al. (1991b). Other columns contain the X and Y coordinates in pixels, corresponding to the map in Fig. 3, V magnitudes and B-V and V-R color indices, and comments on the nature of the objects.


The color-magnitude diagrams of Ho IX are given in Fig. 5 and the (B-V) vs. (V-R) color-color diagram in Fig. 6. The lines represent the sequences of the brightest Milky Way stars from the data of Schmidt-Kaler (1965), and Straizys (1987) (the Johnson-Morgan R magnitudes were transformed into the Kron-Cousins R system by the relations of Fernie (1983)). Also plotted are isochrones for 20 Myr and 40 Myr Bertelli94 (Bertelli et al. 1994). The lines are shifted accounting for a foreground extinction A and a distance modulus mag.
The brightest diffuse objects are the globular cluster candidates in the periphery of M 81, designated by Georgiev et al. (1991a) and Georgiev et al. (1991b) as C2, C4 and C5. The blue diffuse objects D3 and D7 seem to be dense associations or young cluster candidates in Ho IX.
Note that our diffuse object D1, placed to NE from the bright star T1, coincides with the brightest X-ray source in the field of M 81 Roberts00 (Roberts & Warwick 2000). This object is visible also on the best B plate, taken with the 2m telescope of the Rozhen NAO and on the prints from the best B and V plates of the SAO 6 m telescope Georgiev91b (Georgiev et al. 1991b), Georgiev92 (Georgiev et al. 1992). The object appears to be a distant face-on spiral galaxy of type Sc or Sd with apparent sizes of its ”bulge” and very faint ”disk” of diameters of and , respectively. However, the inspection of the available material shows the presence of a blue spot, situated west of the center of D2. This blue spot may be identified with the brightest X-ray source rather than the center of D2.
The large bright red feature D4 is a H II region designated MH 10 in the survey of Miller & Hodge (1994). The remaining objects D2, D5, D6, and D8 may be distant galaxies, visible through Ho IX. If these diffuse objects are Ho IX members, the majority of them must have absolute magnitudes of about -6.5, which is consistent with compact star clusters at the distance modulus of Ho IX.
5 On the distance to Ho IX
In the absence of data for better distance estimators such as Cepheids or the tip of the red giant branch, we applied again the basic distance estimation method for star-forming galaxies, based on the apparent magnitudes of the brightest blue supergiant candidates (BBSC) and the brightest red supergiant candidates (BRSC) in Ho IX. This is a classic method of distance estimation Sandage74 (Sandage & Tammann 1974), which has the advantage of requiring only a limited amount of observing time for a result, but is limited by calibration problems Karachentsev94 such as metallicity effects or the long known correlation of the brightness of the most luminous stars with the luminosity of their parent galaxies Humphreys83 (Humphreys 1983). With a good empirical calibration the distance modulus can still be estimated to quite good accuracy. Here we use the recently published calibration of the method of the brightest stars (MBS), derived from published CCD surveys of nearby galaxies Georgiev97a (Georgiev et al. 1997a); Georgiev98 (Georgiev 1998):
| (12) | |||
| (13) | |||
| (14) | |||
| (15) |
Here V3r, B3b, R3r, and R3b are the mean apparent magnitudes of the 3 brightest blue supergiant candidates (BBSC) and the 3 brightest red supergiant candidates (BRSC) in the B,V, and R bands.
For the extinction correction of the Ho IX data we use an extinction value of Paturel96 (Paturel et al. 1996), which converts into , and Fitzpatrick99 (Fitzpatrick 1999).
One very critical part of this method is the selection of the brightest stars belonging to the target galaxy. One has to exclude foreground dwarfs, globular clusters of the target galaxy, and compact background galaxies. Equally important is to select single stars and not apparent double or multiple objects. Obviously, good photometric quality of the data and high spatial resolution is of essence here. For example: Some of the red stars around V = 19 - 20 mag in the periphery of Ho IX were suspected to be the brightest red supergiants usable for distance estimation by Georgiev et al. (1991b). Using our new data we checked the magnitudes and colors of star #40 of Sandage (1984) and stars ## 44, 45, 46, 48, 49 of Georgiev et al. (1991b). The B-V and V-R colors show that these stars are probable foreground red dwarfs. Therefore, the conclusion that the stars ## 34, 49 and 46 may be the brightest red supergiant candidates in Ho IX Georgiev91b (Georgiev et al. 1991b) is wrong. Due to this misclassification, the distance modulus derived in Georgiev et al. (1991b) cannot be correct (see Table 2).
The use of the brightest red stars has advantages because these stars can be classified as BRSC and distinguished from galactic foreground stars using the color-color diagram (Fig. 6). For Ho IX the stars which are near to the line of the red supergiant stars of classes KI and MI in the color-color diagram are the stars S4, S9, and S41. From its colors the star S9 is a probable K supergiant, with a somewhat lower confidence level as S4 and S41, but still the next best candidate. Another bright red star (#138) must be classified as a red dwarf. The V3r and R3r magnitudes of the detached BRSC give (D = 3.28 Mpc).
The brightest blue objects in the field of Ho IX are S16, S6, and S8. Analysing their shape, these stars appear slightly diffuse on our images. This may indicate that these objects are not single stars but tight groups of several stars, similar to the tight groups observed in the LMC (e.g. Heydari-Malayeri & Beuzit (1994)). If we would use these stars as distance estimators we derive mag (D = 1.8 Mpc) which would place Ho IX near the fringes of the Local Group totally inconsistent with our result from the red supergiants. Based on their colors and profile shapes on our B,V, and R images we consider the stars S10, S36, and S50 as best candidates for the brightest BBSC. Using these stars, we derive a distance modulus of 27.7 mag. Such a distance modulus has generally lower weight than a distance modulus based on red supergiants due to the stronger clustering of the blue supergiants. The tendency of blue supergiants to occur in tight groups, e.g. Heydari-Malayeri94 (Heydari-Malayeri & Beuzit 1994), is one of the basic disadvantages of using blue supergiants compared to the red supergiants.
Generally, using the stars S10, S36, and S50 as BBSC and the stars S4, S9, and S41 as BRSC and applying the four mentioned relation we estimate mag ( mag). However, the uncertainty of the relations in respect to the different evolutionary status of the dwarf galaxies used in the calibration, as well as the uncertainty in the choice of the brightest stars, lower the accuracy of this method for deriving to about 0.4 mag, corresponding to about 20% in distance.

As was pointed out above, depending on the choice of the BBSC, the distance estimation may be changed by up to 100%. The reason usually is that the brightest blue objects in the galaxies are young star clusters, compact associations or multiple stars seen as single ones. To avoid using multiple blue objects as distance indicators instead of single stars, we build the differential luminosity function of the bright blue stars (Fig. 7). Then we apply the magnitudes V(5b)0 and R(5b)0 for which the value of the smoothed luminosity functions represents five stars in an interval of 0.5 mag. Using these magnitudes for the calibration of the luminosity function, the brightest blue stars as distance indicator of Georgiev98 (Georgiev 1998) are:
| (16) | |||
| (17) |
| mM | |
| Sandage (1984) | 28.75 |
| Hopp & Schulte-Ladbeck (1987) | |
| Sandage data recalibrated | 29.4 |
| Davidge & Jones (1989) | 27.5 |
| Georgiev et al. (1991) | |
| Karachentsev & Tikhonov (1994) | 27.66 |
| this paper | |
| M 81: Freedman et al. (1994) |
In the present case using V(5b) 20.9 mag and R(5b) 20.5 mag we estimate m = 27.38 mag and m = 26.76 mag, corresponding to mean distance D = 2.63 Mpc. This is again a much lower distance than expected for a member of the M 81 group. However, Ho IX is a small galaxy with ongoing star formation and its luminosity functions are therefore strongly distorted and shifted to bright magnitudes.
Taking all these considerations into account the current best estimate of the distance of Ho IX is (D = 3.28 Mpc). This new distance estimation based on color selected red supergiants and a new calibration of the method is in agreement with Georgiev et al. (1991b), obtained by other BBSC and BRSC, using the calibrations of Karachentsev & Tikhonov (1994). The distance is also consistent with membership of the M 81 galaxy group as suggested by the proximity to M 81 and the possible correspondence to the HI cloud Yun94 (Yun et al. 1994).
It is important to note here that difference in the photometric zeropoints, differences in the choice of stars for the BBSC and BRSC, and different empirical calibrations of the relations can cancel out to some degree. We compiled the distance estimate of Ho IX in Table 2, clearly shows this point. We showed that the photometry of Sandage (1984) is essentially correct, as already suspected by Metcalfe & Shanks (1991). Still, the distance modulus is very large, which is an effect of the selection of stars and the calibration of the brightest supergiant method used in that paper. As another example Georgiev et al. (1991b) and the present paper give essentially the same distance modulus, but the earlier result is based on a wrong selection of stars and a different calibration of the method.
Note, that HST has not yet improved the distance estimate of Ho IX. The recent HST WFPC2 (Karachentsev et al. (2002); Makarova et al. (2002)) photometry of Ho IX did not yield a distance, since the red giant branch was not detected and the supergiant criterion could not be applied due to the incomplete coverage of the galaxy.

6 Recent star formation history of Ho IX
The properties of our CMD and that of other published CMDs of Ho IX by Hopp & Schulte-Ladbeck (1987) and Davidge & Jones (1989) are very similar. Ho IX is far less active than classical star forming or starbursting dwarf galaxies, e.g. Vallenari & Bomans (1996) or Hopp & Schulte-Ladbeck (1995).
The region of increased concentration of blue stars at V mag and B-V as well as R mag and V-R the V vs. (V-B) and R vs. (V-R) color-magnitude diagrams corresponds well to the main sequence location of B0V-O5V stars having absolute magnitudes of about to mag. The isochrones of Bertelli et al. (1994) are superimposed on the CMDs. The turn-off points of the evolved stellar population indicate an age of about 40 Myr.
The CMD is unfortunately not deep enough to draw more detailed conclusions on the star formation history directly. Together with the results from the literature some interesting points can nevertheless be noted. The surface brightness of Ho IX is quite low, putting it well into the regime of low surface brightness galaxies, still the intermediate age population seems to be similar to that of the LMC Davidge89 (Davidge & Jones 1989), a much more massive and higher surface brightness object. If true, this implies a significant star formation event a few Gyr ago, like the possibly tidally triggered burst of star formation in the LMC about 2 Gyr ago (e.g. Bomans et al. (1995)). The patchy structure of Ho IX and the location of the most significant region of relatively recent star formation may hint at tidal influence of M 81, but this remains speculation until much deeper imaging data reveal a much more detailed picture of the star formation history of Ho IX.
7 Summary and conclusions
In this paper we investigated the widely different photometric zeropoints of several photometries of the resolved stellar content of the dwarf galaxy Ho IX. It turned out that the zeropoints of the photometric work of Sandage (1984) is consistent with our CCD based photometry. Due to its immediate proximity to M 81 on the sky, Ho IX is a prime candidate for investigating tidal effects on the evolution of dwarf galaxies, as long as Ho IX is not offset significantly in front of or behind M 81.
The coincidence of Ho IX with a HI cloud at the ‘right’ velocity is not a fully convincing argument due to the low level of recent star formation activity in Ho IX. Ho IX could have no significant HI left and the detected HI would be unrelated to Ho IX, belonging to one of the tidal debris HI clouds seen around M 81, M 82, and NGC 3077.
In the absence of other distance indicators we used our photometry and a new calibration of the brightest red and blue supergiant criterion to estimate the distance to Ho IX. The brightest blue supergiant method (using CMD and luminosity function) yielded low distances, inconsistent with a membership of Ho IX of the M 81 group. Due to the low recent star formation rate and extended nature of several blue supergiant candidates, we regard this result as unreliable.
We improved the selection of the brightest red supergiants by using the B-V versus V-R color-color diagram (selection against galactic foreground stars), and again used the new calibration of Georgiev (1998). The resulting distance of mag ( Mpc) would place Ho IX in the immediate vicinity of M 81.
Still, the error in this distance is too large to declare the matter settled. Photometry which makes it possible to determine the distance from the tip of the red giant branch is highly needed. Such high quality data would also make it possible to search for tidally induced bursts in the star formation history of Ho IX.
Using HST WFPC2 snapshot observation a very good quality CMD has been produced (Karachentsev et al. (2002); Makarova et al. (2002)). Despite being much deeper than our observations, no red giant branch was detected and no independent distance estimate for Ho IX could me made. Still, the CMD seems to be consistent with a distance close to that of M 81. The absence of a giant branch in the CMD remains puzzling. Clearly, the star formation history and therefore the nature of Ho IX is far from understood.
Acknowledgements.
TSG thanks the Graduate Schools GRK 118 ‘The Magellanic System, Galaxy interaction, and the Evolution of Dwarf Galaxies’ and GRK 787 ‘Galaxy Groups as Laboratories for baryonic and Dark Matter’ for support during his visits to Bochum, and the staff of the Rozhen MAO for their help during the observations. The authors thank R.-J. Dettmar for critical reading of the manuscript and several helpful comments. The Digitized Sky Surveys were produced at the Space Telescope Science Institute under U.S. Government grant NAG W-2166. The images of these surveys are based on photographic data obtained using the Oschin Schmidt Telescope on Palomar Mountain and the UK Schmidt Telescope. The Second Palomar Observatory Sky Survey (POSS-II) was made by the California Institute of Technology with funds from the National Science Foundation, the National Geographic Society, the Sloan Foundation, the Samuel Oschin Foundation, and the Eastman Kodak Corporation. This research has made use of the NASA/IPAC Extragalactic Database (NED) which is operated by the Jet Propulsion Laboratory, California Institute of Technology, under contract with the National Aeronautics and Space Administration.Appendix A Notes on the methods
The aperture stellar photometry in this paper is made simultaneously in the three rebinned frames (in B, V and R bands) by the program UMAG (Upper MAGnitudes). This software is especially developed for photometry in crowded fields of galaxies where the number of star-like objects may be comparable to or lower than the number of slightly diffuse ones. Under these conditions PSF photometry is not as efficient as usual (Georgiev 1995b ; Notni et al. (1996); Georgiev et al. 1997b ).
The photometry method realized in the program UMAG is a generalization of the aperture photometry method. A fast algorithm for constructing the magnitude growing curve (MGC) of the image within the boundaries of a circular photometric aperture is implemented, based on histogram transforming. UMAG gives two kind of results – instrumental magnitudes and shape parameters, as well as MGCs of the images.
The program UMAG builds a special kind of MGCs. Each value of the usual MGC is derived using only one background plane, which corresponds to the periphery pixels of the photometric aperture. For this reason all values of the usual MGC have equal shifts due to the error of the background determination. Each value of our ”upper” MGC is an integral of the image within a circular sub-aperture (inside the photometric aperture) and above the background plane. This background is determined on the periphery of the sub-aperture. So each value of the upper MGC depends on its ”inner” background (and its error). The values of the upper MGC may be called ”upper” magnitudes, because each of them is determined using a background plane which is above the background around the image.
The last points of both kinds of MGC coincide. A photometric method which uses these values as instrumental magnitudes is the usual aperture photometry. However, the upper MGC is less steep than the normal MGC and its values depend more strongly on the shape of the image. Therefore, it provides information for image classification. We use the first and second derivatives of the upper MGC and distribute the images into shape classes – very sharp (stellar images which may be corrupted by cosmics), star like, cluster like, irregular (possible unresolved stellar associations or background galaxies).
Star images that are similar in their MGCs (normal MGC, as well as the upper MGC) are similar (proportional) in shape. However, the pixel sampling of the central parts of the stellar images disturbs the similarity and conserves some proportionality in a narrow magnitude interval, usually 6-7 magnitudes. For this reason we use small aperture diameters (no less than FWHM of the PSF) for an interval of about 6 magnitudes above the limiting magnitude of the frame. Brighter objects must be measured with a larger aperture.
The program UMAG determines the instrumental magnitudes by averaging the values of 6% of the brightest tails of the MGCs and adding an aperture correction. The mean values of the aperture correction in each band is calculated by the program. It uses isolated star images for which the instrumental magnitudes are determined and then extrapolated to a magnitude determined with an aperture with infinite radius. The list of isolated stars and their full instrumental magnitude, as well as the constants of the color transform must be prepared as input files for the final photometry. Then the program UMAG gives directly the standard magnitudes and colors of the images (as well as their shape parameters and upper MGC).
The difference between UMAG photometry and e.g. DAOPHOT aperture photometry Stetson87 (Stetson 1987) is only in the number of the background pixels. DAOPHOT uses rings of pixels around the photometric aperture while UMAG uses just the peripheral pixels of the same aperture and does not need additional background space. A similar method of photometry was applied independently by Notni et al. (1996) in the crowded field of the galaxy M 82. A comparison of the UMAG and DAOPHOT PSF photometry of stellar images in the crowded fields of 5 resolved dwarf galaxies is given by Makarova et al. (1997). It shows a good agreement in the range 18-24 mag within a standard error of 0.1 mag. The results from both programs differ primarily when the objects are slightly diffuse. UMAG underestimates and PSF DAOPHOT overestimates their brightness.
References
- Aparicio et al. (1997) Aparicio, A., Gallart, C., Bertelli, G. 1997, AJ, 114, 680
- (2) Bertelli, G., Bressan, A., Chiosi, C., Fagotto, F., Nasi, E. 1994, A&AS, 106, 275
- Bomans et al. (1995) Bomans, D. J., Vallenari, A., de Boer, K.S. 1995, A&A, 298, 427
- (4) Christian, C. A., Adams, M., Barnes, J. V., et al. 1985, PASP, 97, 363.
- (5) Davidge, T. J., & Jones, J.H. 1989, AJ, 97, 607
- Fernie (1983) Fernie, J. D. 1983, PASP, 95, 782
- (7) Fitzpatrick, E. L. 1999, PASP, 111, 63
- (8) Flower, P.J. 1977, A&A, 54, 31
- (9) Freedman, W. L., Hughes, S. M., Madore, B. F., et al. 1994, ApJ, 427, 628
- (10) Georgiev, T. B. 1995a, IAU Commision 9 WGWFI Newsletter, 7, 9
- (11) Georgiev, T. B. 1995b, IAU Commision 9 WGWFI Newsletter, 8, 29
- (12) Georgiev, T. B. 1998, Compt. rend. Acad. bulg. Sci., 51, No.11-12, 5
- Georgiev et al. (1991a) Georgiev, T. B., Tikhonov, N. A., Karachentsev, I. D. 1991a, Sov. Astron. Lett., 17(6), 416
- (14) Georgiev, T. B., Tikhonov, N. A., Karachentsev, I. D., Bilkina, B. I. 1991b, A&AS, 89, 529
- (15) Georgiev, T. B., Bilkina, B. I., Tikhonov, N. A. 1992, A&AS, 94, 569
- (16) Georgiev, T. B., Bilkina B. I, Dencheva N. M. 1997a, Astron. Lett., 23, 740
- Georgiev et al. (1997b) Georgiev, T. B. Karachentsev, I. D., Tikhonov, N. A. 1997b, Astron. Lett., 23, 514
- Georgiev et al. (1999) Georgiev, T. B., Bilkina, B. I., Dencheva, N. M., Ivanova, R. I., Valchev, T. S. 1999, Bulg. Journ. Phys., 26, No.1-2, 87.
- (19) Heydari-Malayeri, M., & Beuzit, J.-L. 1994, A&A, 287, L17
- Hill et al. (1994) Hill, J. K., Gessner, S. E., Bohlin, R. C., et al. 1993, ApJ, 402, L45
- (21) Hopp, U., & Schulte-Ladbeck, R. E. 1987, A&A, 188, 5
- Hopp & Schulte-Ladbeck (1995) Hopp, U., & Schulte-Ladbeck, R. E. 1995, A&AS, 111, 527
- (23) Humphreys, R. M., 1983, ApJ, 269, 335
- Karachentsev & Tikhonov (1994) Karachentsev, I. D., & Tikhonov, N. A. 1994, A&AS, 286,718
- Karachentsev et al. (2002) Karachentsev, I. D., Dolphin, A. E., Geisler, D. et al., 2002, A&A, 383, 125
- Makarova et al. (1997) Makarova, L. N., Karachentsev, I. D., Georgiev, T. B. 1997, Astron. Lett., 23, 378
- Makarova et al. (2002) Makarova, L. N., Grebel, E. K., Karachentsev, I. D. et al., 2002, A&A, 396, 473
- Metcalfe & Shanks (1991) Metcalfe, N., & Shanks, T. 1991, MNRAS, 250, 438 (MS91)
- Miller & Hodge (1994) Miller, B. W., Hodge, P. 1994, ApJ, 427, 656
- Notni et al. (1996) Notni, P., Makarova, L. N., Karachentsev, I. 1996, Astron. Nachr., 317, 16
- (31) Paturel, G., Bottinelli, L., Di Nella, H., et al. 1996, Principal Galaxy Catalogue, Observatoire de Lyon
- (32) Perelmuter, J.-M., & Racine, R. 1995, AJ, 109, 1055
- (33) Roberts, T. P., Warwick, R. S. 2000, MNRAS, 315, 98
- (34) Sandage, A., Tammann, G. A. 1974, ApJ, 191, 603
- (35) Sandage, A. 1984, AJ, 89, 621
- (36) Schmidt-Kaler, Th. 1965, in Landolt-Bornstein New Series, Group VI, Vol.I, ed. H.H. Voigh, Berlin, Springer, p.284
- (37) Stetson, P. B. 1987, PASP, 99, 191
- Straizys (1987) Straizys, V. 1987, Bull. Vilnius Observ., 78, 43
- Treffers & Richmond (1989,1997) Treffers, R. R., & Richmond, M. W. 1989, PASP, 101, 725
- (40) Treffers, R. R., & Richmond, M. W. 1997, priv. comm.
- Vallenari & Bomans (1996) Vallenari, A. & Bomans, D. J. 1996, A&A, 313, 713
- (42) Yun, M. S., Ho, P. T. P., Lo, K. Y. 1994, Nat, 372, 530
- Bertelli et al. (1994)
- Davidge & Jones (1989)
- Georgiev et al. (1991b)
- (46)
- (47)
- Georgiev (1998)
- Heydari-Malayeri & Beuzit (1994)
- Hopp & Schulte-Ladbeck (1987)
- Notni et al. (1996)
- Sandage (1984)
- Schmidt-Kaler (1965)