Classical and MgII-selected Damped Lyman- Absorbers: impact on at .
Abstract
The Damped-Ly systems (DLAs), seen in absorption in the spectrum of background quasars, are believed to contain a large fraction of the neutral gas in the Universe. Paradoxically, these systems are more difficult to observe at , since they are rare and their H I feature then falls in UV spectra, thus requiring the use of space-borne facilities. In order to overcome this observational difficulty, Rao Turnshek (2000) pioneered a method based on Mg II-selected DLAs, that is absorbers discovered thanks to our knowledge of their Mg II feature in optical spectra. In the present work, we use new observations undertaken at the TNG as well as a careful literature & archival search to build samples of low redshift absorbers classified according to the technique used for their discovery. We successfully recover and equivalent widths of Fe II 2600, Mg II 2796, Mg II 2803 and Mg I 2852 for a sample of 36 absorbers, 21 of which are Mg II-selected. We find that the Mg II-selected sample contains a marginally larger fraction of absorbers with )21.0 than seen otherwise at low redshift. If confirmed, this property will in turn affect estimates of which is dominated by the highest H I column densities. We investigate on the source of the potential discrepancy and find that ) does not correlate significantly with metal equivalent widths. Similarly, we find no evidence that gravitational lensing, the fraction of associated systems or redshift evolution affect the absorber samples in a different way. We conclude that the hint of discrepancies in distributions between the Mg II-selected DLAs and the others most likely arises from small number statistics. Therefore, further observations based on both H I and Mg II selection techniques are required to better clarify the impact on estimates of at low redshift.
keywords:
cosmology: observations – large scale structure of Universe – galaxies: evolution – galaxies: formation – intergalactic medium – quasars: absorption lines.| Coordinate | Alternative | Mag | Obs Date | Exp Time | |
|---|---|---|---|---|---|
| Name | Name | (sec) | |||
| Q02170144a | 0215015 | 1.715 | 18.3 | 19 Feb 2003 | 18002 |
| Q04560400 | Q0454039 | 1.345 | 16.5 | 18 Feb 2003 | 18002 |
| Q08134813 | 3C196 | 0.871 | 17.8 | 18 Feb 2003 | 18002 |
| Q09384129 | Q0935417 | 1.980 | 16.2 | 18 Feb 2003 | 18002 |
| Q10015553 | Q0957561 | 1.414 | 16.7 | 19 Feb 2003 | 18002 |
| Q11241705 | HE11221649 | 2.400 | 16.5 | 19 Feb 2003 | 18002 |
| Q12111030 | Q1209107 | 2.187 | 17.6 | 19 Feb 2003 | 18002 |
| Q12320224 | PKS1229021 | 1.045 | 17.6 | 21 Feb 2003 | 18002 |
| Q12502631 | Q1247267 | 2.038 | 15.8 | 19 Feb 2003 | 18001 |
| … | … | … | … | 21 Feb 2003 | 9002 |
| Q13313030 | Q1328307 | 0.849 | 17.2 | 22 Mar 2003 | 18002 |
| Q13543139 | Q1351318 | 1.326 | 17.4 | 26 Mar 2003 | 18002 |
| Q16242345 | Q1622238 | 0.927 | 17.5 | 10 Apr 2003 | 18002 |
| Q16311156 | Q1629120 | 1.795 | 18.5 | 10 Apr 2003 | 18001 |
| … | … | … | … | 11 Apr 2003 | 18001 |
a Quasar with Broad Absorption Lines (BAL).
1 Introduction
Intervening absorption systems in the line of sight towards distant quasars allow for direct observation of the distribution of gaseous matter from the epoch of initial galaxy formation to the present day (Lanzetta et al. 1991; Wolfe et al. 1995). In particular, these absorbers provide important ways of measuring the neutral gas and metallicity content of the Universe at high-redshifts (Vladilo et al. 2000; Savaglio 2001; Kulkarni & Fall 2002; Prochaska et al. 2003; Péroux et al. 2003a). The high-column density end of this population is composed of the Damped-Ly systems (DLAs) which have H I column densities, ), 20.3 cm-2 and the sub-Damped-Ly systems (sub-DLAs) with 19.0N(HI)20.3 cm-2. These two are found to contain a large fraction of the neutral gas in the Universe (Péroux et al. 2003b). Therefore, these systems can be used to compute the ratio of H I density to the critical density of the Universe, , which in turn provides information on the gas consumption and star formation over time.
This cosmological mass density is rather well constrained at high-redshift (Storrie-Lombardi et al. 1996; Storrie-Lombardi & Wolfe 2000; Péroux et al. 2003b). In contrast, measurements of at are paradoxically more difficult for several reasons: the observed absorber wavelengths are shifted to the ultraviolet requiring space observations and the geometry of the Universe combined with the paucity of DLA systems requires the observations of many quasar lines of sight. Nevertheless, this redshift range is of particular importance since it comprises 70% of the look-back time ( cosmology).
Lanzetta et al. (1995) were the first to derive at low redshift using the International Ultraviolet Explorer (IUE) satellite. Rao, Turnshek & Briggs (1995) proposed a new method based on the observational evidence which indicates that DLAs are always associated with a Mg II system, while the reverse is not true. From successful HST observations of a sample of Mg II-selected systems (Rao & Turnshek 2000), they estimate DLAs statistics by correcting for the observationally known incidence of Mg II systems in a random quasar sample. They then compute the mass of neutral gas using their “derived” sample of low redshift DLAs. Using the same technique, Churchill (2001) has also discovered new DLAs at very low redshifts: . These observations imply a rather flat distribution of the cosmological mass density of neutral hydrogen down to low redshift, at odds with current ideas and models of cosmic star formation (Pei & Fall 1995; Nagamine, Springel & Hernquist 2003). Moreover, local estimates of H I mass measured by Zwaan et al. (1997), and recently confirmed by Zwaan et al. (2003) are difficult to reconcile with such high values of in low redshift quasar absorbers.
In the present work, we compare the observed properties of Mg II-selected absorbers with more “classical” DLAs/sub-DLAs. The goal is to identify whether both observational methods sample the column density parameter space and do not impact the calculation of the cosmological mass density at low redshift. In section 2, we present the data samples which are from both a targeted observational program and a dedicated literature and archival search. We describe the data reduction process as well as the method used to make the measurements of ) and metal equivalent widths (hereafter EW). Constructing well-defined samples is challenging since the data have been taken at various epochs by different authors having distinct scientific goals in mind. Nevertheless, we have been extremely conservative in selecting the systems and, for the purpose of our analysis, we have also split the non-Mg II selected samples into two sub-samples which allow for comparison of the various discovery techniques. Details on this matter are given in sections 3 and 4 where we also compare the properties of the samples of classical and Mg II-selected quasar absorbers.


2 The Data
2.1 Mg II Measurements
In order to build the so-called “classical” sample, we have acquired optical spectra covering the Fe II 2600, Mg II 2796, Mg II 2803 and Mg I 2852 features of known DLAs/sub-DLAs with well constrained column densities. The observations were carried out in service mode with the DOLORES spectrograph at the 3.58 m Telescopio Nazionale Galileo (TNG) located at Roque de Los Muchachos Observatory in the Canary Islands. High signal-to-noise optical spectrophotometry was obtained covering the appropriate wavelength range so as to study the Mg II and other associated metal lines in quasar absorbers, the exact range depending on the grism used for the observations. A journal of the observations is presented in Table 1.
Thirteen quasars were observed between February and April 2003. The integrating times are all of a total of 1800 seconds regardless of the brightness of the object. Only in one case (Q13543139/Q1351318), the weather conditions were poor and the resulting spectrum thus suffers low signal-to-noise ratio. A combination of high and low-resolution modes of the DOLORES spectrograph is used. The camera is equipped with a Loral thinned and back-illuminated CCD with 2048 2048, 15 pixels. Grisms 1, 5, 6 and 7 (LRB, HRB, HRV and HRR respectively) are used for the observations. Therefore the dispersion of the spectra ranges from 0.8 to 2.8 Å pixel-1. All the observations were taken with a slit width of 1.0 – 1.5 arcsec.
The data reduction is done using the IRAF 111IRAF is distributed by the National Optical Astronomy Observatories, which are operated by the Association of Universities for Research in Astronomy, Inc., under cooperative agreement with the National Science Foundation. software package. The bias frames are so similar over successive nights that a master ‘zero’ frame for each month is created using the IMCOMBINE routine. After trimming the data, they are zero corrected using CCDPROC. Similarly a single flat-field frame is produced by taking the median of the flats. The overall background variation across this frame is removed using IMSURFIT to produce an image to correct for the pixel-to-pixel sensitivity variation of the data. The task APALL is used to extract 1-D multi-spectra from the 2-D frames of the quasars and spectrophotometric standard stars, while a cut through the 2-D frames of the Arc served as an extraction procedure. The APALL routine estimates the sky level by model fitting over specified regions on either side of the spectrum. In the case where the object is rather faint on the 2-D frame (i.e. for Q02381636/0235164), different exposures are IMCOMBINEd before extraction with APALL. The spectra are then wavelength calibrated using Ar, Ne or He arcs according to the grism used. We pay particular attention to this step of the data processing, since it is crucial for the later measurements of the metal equivalent widths. Given that the objects have magnitudes ranging from 15 to 19 but identical exposure time, the signal-to-noise ratios of the resulting spectra vary from one object to another.
| Coordinate | Alternative | ) | HST/ESO | Inst | Gratings | Selection | ||
|---|---|---|---|---|---|---|---|---|
| Name | Name | prog ID (PI) | Method | |||||
| Q04240204 | PKS0421019 | 1.638 | 3207 | 19.010.15 | 6577 (Rao) | FOS | 270 | Mg II |
| Q04271302 | PKS042413 | 1.408 | 2927 | 19.430.15 | 6577 (Rao) | FOS | 270 | Mg II |
| Q04271302 | PKS042413 | 1.562 | 3114 | 19.350.10 | 6577 (Rao) | FOS | 270 | Mg II |
| Q08262230 | PKS082322 | 0.910 | 2322 | 19.380.10 | 6577 (Rao) | FOS | 270 | Mg II |
| Q09384129 | Q0935417 | 1.373 | 2885 | 20.450.10 | 6237 (Beaver) | FOS | 270 | H I |
| Q11061821a | HE11041805 | 1.662 | 3236 | 20.750.10 | 60.A-9022 | UVES | … | H I |
| Q13256515 | 4C65.15 | 1.610 | 3173 | 19.760.10 | 6577 (Rao) | FOS | 270 | Mg II |
| Q13314101 | PG1329412 | 1.282 | 2774 | 19.860.10 | 6577 (Rao) | FOS | 270 | Mg II |
| Q13314101 | PG1329412 | 1.601 | 3162 | 19.330.15 | 6577 (Rao) | FOS | 270 | Mg II |
| Q14294747 | PG1427480 | 0.221 | 1484 | 19.730.10 | 6781 (Wills) | FOS | 130 | Mg II |
| Q21311207 | Q2128123/PHL1598 | 0.430 | 1738 | 19.550.10 | 4581 (Bahcall) | FOS | 190 | H I |
a UVES commissioning spectrum used for both ) and Mg II measurements.
In addition to these new data, we thoroughly checked published literature and public data sets for any other spectra of sufficient quality for us to estimate equivalent widths of metal features. Fe II 2600, Mg II 2796, Mg II 2803 and Mg I 2852 lines found in such a way are only kept if they are of comparable quality to the one obtained with our own TNG survey. Only two spectra met those criteria: the UVES commissioning spectrum of Q11061821/HE11041805 and the HST/STIS spectra of Q02381636/0235164 taken as part of program 7294 (PI: Cohen). In order to obtain a uniform set of data we degrade the UVES spectrum of Q11061821/HE11041805 to the TNG data resolution before undertaking the equivalent width measurements.
The Fe II 2600, Mg II 2796, Mg II 2803 and Mg I 2852 absorption features of all the 15 absorbers are shown in Figure 1. We compute the equivalent widths of the metal lines for the 15 spectra at our disposal. One object in our TNG sample (Q10015553/Q0957561) does not cover the Fe II 2600 line while on several occasions Fe II 2600 and/or Mg I 2852 are not detected at the redshift expected for the absorber. It can be seen from Figure 1 that the Mg II doublet is resolved in all the spectra used for this study.
2.2 Measurements
In addition to the systems presented in the section above, we search the literature for suitable ) measurements. In order to gather a significant sample, we look for any absorber down to the sub-DLA definition ()19.0) and with . We only include measurements derived from high signal-to-noise HST (STIS or FOS) spectra. We therefore exclude measurements based on IUE spectra or estimates from 21cm observations or other even more indirect methods. Furthermore, we thoroughly check ESO and HST archives for any available spectra for which the relevant measurements were not available in the literature. Eleven measurements are possible thanks to HST/FOS spectra recovered from the HST/ESO archives. The UVES commissioning spectrum of Q11061821/HE11041805 provides a further measurement of . In particular, we extend the Rao & Turnshek sample by including 7 sub-DLAs which were Mg II-selected but that these authors rejected because they had )20.3. We also include the two Mg II-selected absorbers mentioned by Churchill (2001) and for which the measurements could be made (Q14294747/PG1427480 and Q04414313/PKS0439433).
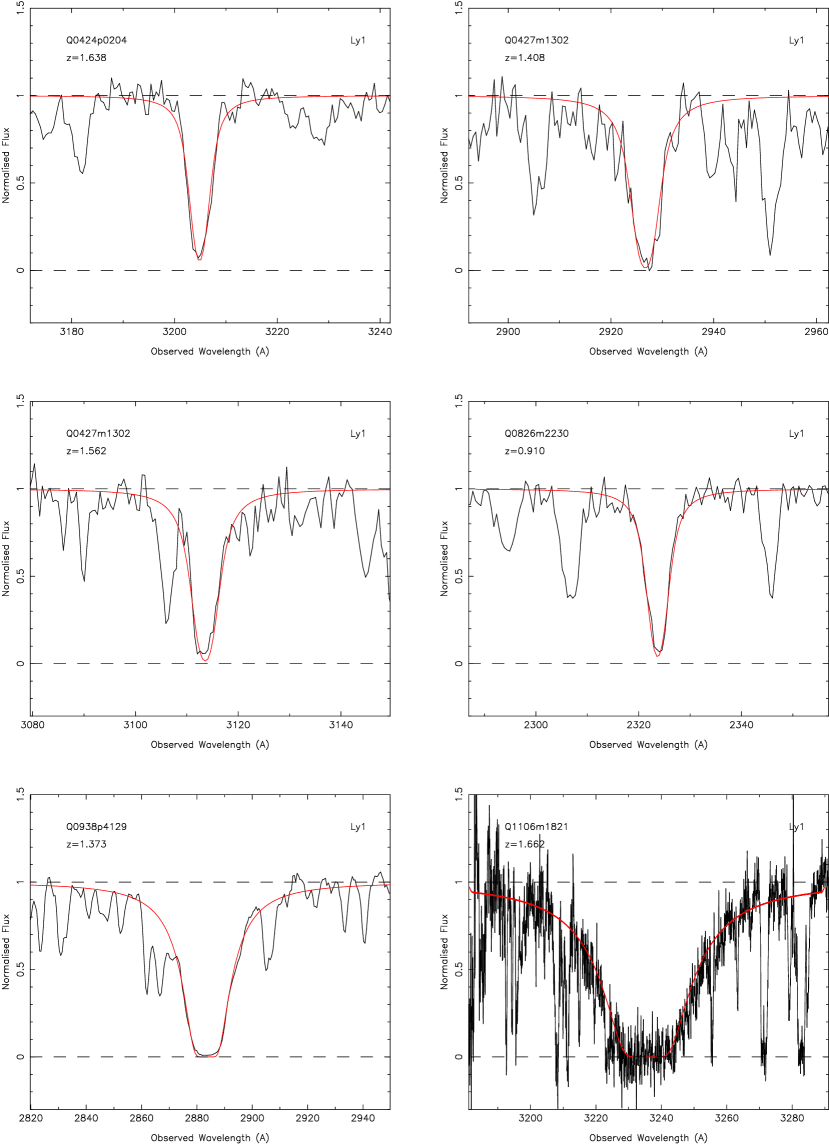
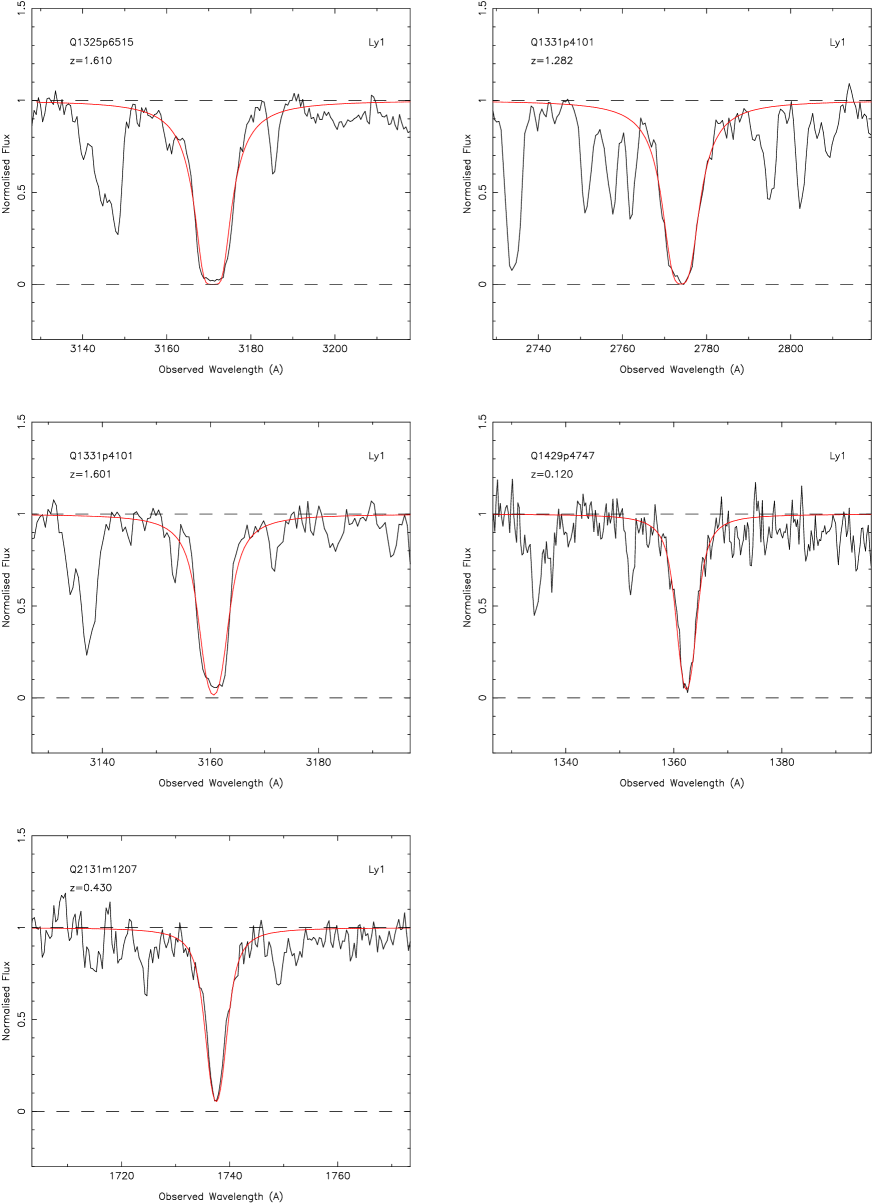
In order to measure column densities of the 11 absorbers available to use, we normalise the spectra in the region of interest using spline functions. We then fit Voigt profiles using the FITLYMAN package within MIDAS (Fontana & Ballester 1995). We note that for several HST/FOS spectra, the absorbing feature does not reach the zero flux level in its center, even if the line is clearly saturated. We use a convolution of the Voigt profile together with the instrumental line spread function to estimate whether this effect is real or not. Only in a few cases do we find it to be an artifact and we correct the spectrum by subtracting a few percent from the continuum level as is standard practice (Boissé et al. 1998; Rao & Turnshek 2000). The typical resulting error bar in ) measurements is 0.10 and never exceeds 0.15, but does not include error in the continuum placement. The resulting fits are shown in Figure 2 for the eleven systems, while information on the observing details is provided in Table 2.
3 Mg II Equivalent Widths Distributions
In this section, we study the distribution of the equivalent widths of metals in Mg II-selected absorbers as compared to that of more classical DLAs/sub-DLAs. The latter sample is further divided into two sub-samples: on one hand absorbers selected by their H I feature and on the other hand systems selected at 21cm or in one case, because a galaxy is known and later turns out to be a DLA.
3.1 Samples Definition
The method developed by Rao & Turnshek (2000) makes use of the empirical fact that all DLAs studied are found to have a corresponding Mg II metal-like absorption (Rao 1994; Rao, Turnshek & Briggs 1995). In their study, the authors select a sample of 243 , EW Mg II (2796)Å Mg II absorbers taken from various sources in the literature. A fraction of these absorbers (87) already has a spectrum as part of the HST archives (48 absorbers) while others are observed as part of their own HST observing program (39 Mg II doublets). Using these data, they measure whether a DLA is present or not at the expected absorbing redshift.
In the present study, the emphasis is on constructing well defined DLA/sub-DLA samples: one where the absorbers are Mg II-selected, and another for the remaining systems, discovered predominantly, but not only, on their H I feature. Therefore the latter also includes absorbers selected at 21 cm or a known galaxy which is further found to produce a DLA signature in a quasar spectrum. Moreover, we extend the work of Rao & Turnshek (2000) (as well as our literature search for “classical” systems) down to the sub-DLA definition in order to get a more statistically significant sample of absorbers. This is done by measuring the H I column densities of Rao & Turnshek’s (2000) HST program for which Mg II absorbers were detected.
The resulting Mg II-selected sample in the present study is thus larger than the original work from Rao & Turnshek (2000). It is composed of 21 systems defined as follows:
-
•
7 DLAs newly discovered in Rao & Turnshek (2000).
-
•
7 sub-DLAs in the same observing program and fitted by us.
-
•
1 of the 4 very low redshift systems of Churchill (2001) for which ) is reported in the literature (Q04414313/PKS0439433) and 1 other for which ) is determined by us (Q14294747/PG1427480).
-
•
1 sub-DLA (Q01000211/Q0058019PHL938) selected by Rao & Turnshek (2000) and 1 other DLA found by the same group with their new HST program (Q16311156/Q1629120).
-
•
2 systems (Q04560400/Q0454039 and Q12111030/Q1209107) observed during the HST program 5351 (PI: Bergeron) based on their metal features in optical spectra (see Boissé et al. 1998).
-
•
1 DLA (Q16242345,Q1622238/3C336) selected thanks to its Mg II signature and observed during HST program 5304 (PI: Steidel).
It should be noted that most of the quasar spectra with DLAs in the HST archives are clearly taken because the observer expects the absorber to be present. As an example, for the system along (Q03042211/EXPKS0302223), the HST proposal abstract (ID: 6224; PI: Burbidge) states that “This data set will yield high quality absorption line data for studies of the damped Lyman alpha absorption system”. Therefore, such absorbers are initially not selected on the basis of their Mg II feature and we do not include them in our Mg II-selected sample even if they have been “re-discovered” in the archive search of Rao & Turnshek (2000). Rather, we define the Mg II-selected sample as all systems which have been newly discovered based on their metal signature in optical quasar spectra.
The remaining systems form the classical sample which can be defined as follows:
-
•
10 DLAs/sub-DLAs directly discovered thanks to their H I signature. These systems also form the so-called H I-selected sample (see Section 4).
-
•
4 absorbers selected at 21cm and with measured in UV spectra (Q02381636/Q0235164; Q08134813/Q0809483/3C196; Q12320224/PKS1229021; Q13313030/Q1328307/3C286).
-
•
1 system for which the quasar-galaxy association is known prior to the HST observations (Q12153309/TON1480).
Altogether, the number of systems studied here is 36. A summary of the resulting sample is shown in Table 3 together with the properties of both the quasar itself and its absorbers. It should be emphasized once more that we only include systems for which both and metal equivalent widths can be securely recovered. Hence, while during the course of our literature search we have known of as many as 93 DLAs/sub-DLAs with , our criterion reduces the current sample to 36 absorbers, 21 of which are Mg II-selected. In particular, we choose not to include the two Mg II-selected DLAs ()=21.16 and )=21.41) recently reported by Turnshek et al. (2004) since these initial results might not be representative of the most recent HST UV spectroscopic survey undertaken by their group.
| Coordinate | Alternative | Mag | ) | Ref | Ref | Selection | ||||||
|---|---|---|---|---|---|---|---|---|---|---|---|---|
| Name | Name | [atom cm-2] | ) | Fe II2600 | Mg II2796 | Mg II2803 | Mg I2852 | Method | ||||
| Q01000211 | Q0058019/PHL938 | 1.954 | 17.2 | 0.613 | 20.08 | (3) | 1.39 | 1.70 | 1.51 | 0.35 | (5) | Mg II |
| Q02170144 | Q0215015a | 1.715 | 18.3 | 1.345 | 19.57 | (4) | 2.06 | 2.57 | 1.63 | 0.37 | (1) | H I |
| Q02381636 | Q0235164a | 0.940 | 19.0 | 0.524 | 21.70 | (3) | 2.13 | 2.42 | 3.28 | 0.79 | (1) | 21 cm |
| Q02514315 | Q0248430 | 1.310 | 17.4 | 0.394 | 21.56 | (5) | 1.03 | 1.86 | 1.42 | 0.70 | (5) | Mg II |
| Q03042211 | EX/PKS0302223 | 1.400 | 16.0 | 1.009 | 20.36 | (12) | 0.63 | 1.16 | 0.96 | 0.18 | (5) | H I |
| Q04240204 | PKS0421019 | 2.055 | 17.0 | 1.638 | 19.01 | (1) | 0.4 | 0.35 | 0.28 | 0.2 | (5) | Mg II |
| Q04271302 | PKS042413 | 2.166 | 17.5 | 1.408 | 19.43 | (1) | 0.44 | 0.55 | 0.35 | 0.3 | (5) | Mg II |
| Q04271302 | PKS042413 | 2.166 | 17.5 | 1.562 | 19.35 | (1) | 0.2 | 0.38 | 0.39 | 0.2 | (5) | Mg II |
| Q04414313 | PKS0439433 | 0.593 | 16.4 | 0.101 | 20.00 | (3) | 0.91 | 2.32 | 1.99 | 0.54 | (6) | Mg II |
| Q04560400 | Q0454039 | 1.345 | 16.5 | 0.859 | 20.69 | (7) | 1.21 | 1.48 | 1.49 | 0.30 | (1) | Mg II |
| Q07413112 | OI363/Q0738313 | 0.635 | 16.1 | 0.221 | 20.90 | (3) | 0.6 | 0.52 | 0.50 | 0.2 | (5) | Mg II |
| Q08134813 | Q0809483/3C196 | 0.871 | 17.8 | 0.437 | 20.80 | (8) | 1.93 | 1.97 | 2.06 | 1.38 | (1) | 21 cm |
| Q08262230 | PKS082322 | 0.920 | 16.2 | 0.910 | 19.38 | (1) | … | 1.15 | 0.68 | 0.4 | (5) | Mg II |
| Q08302410 | Q0827243 | 0.939 | 17.3 | 0.518 | 20.30 | (3) | 1.90 | 2.90 | 2.20 | … | (5) | Mg II |
| Q08534349 | Q0850440 | 0.514 | 16.4 | 0.164 | 19.81 | (9) | 0.2 | 0.2 | 0.43 | … | (9) | H I |
| Q09377301 | Q0933733 | 2.528 | 17.0 | 1.478 | 21.62 | (5) | 0.76 | 0.95 | 1.15 | 0.3 | (5) | Mg II |
| Q09384129 | Q0935417 | 1.980 | 16.2 | 1.373 | 20.45 | (1) | 0.61 | 1.04 | 1.02 | … | (1) | H I |
| Q09541743 | Q0952179 | 1.472 | 17.2 | 0.239 | 21.32 | (5) | … | 0.63 | 0.79 | 0.4 | (5) | Mg II |
| Q10015553 | Q0957561b | 1.414 | 16.7 | 1.391 | 20.28 | (10) | … | 2.25 | 1.93 | 0.38 | (1) | H I |
| Q11061821 | HE11041805b | 2.305 | 16.7 | 1.662 | 20.75 | (1) | 0.73 | 0.95 | 0.90 | 0.32 | (1) | H I |
| Q11241705 | HE11221649 | 2.400 | 16.5 | 0.680 | 20.45 | (3) | 1.23 | 1.72 | 1.57 | 0.10 | (1) | H I |
| Q11301449 | PKS112714 | 1.184 | 16.9 | 0.313 | 21.71 | (3) | 1.14 | 2.21 | 1.90 | 1.14 | (5) | Mg II |
| Q12111030 | Q1209107 | 2.187 | 17.6 | 0.629 | 20.20 | (7) | 1.11 | 2.54 | 2.35 | 0.56 | (1) | Mg II |
| Q12153309 | TON1480 | 0.614 | 17.0 | 0.004 | 20.34 | (11) | 0.68 | 1.21 | 0.86 | 0.20 | (11) | Gal |
| Q12320224 | PKS1229021 | 1.045 | 17.6 | 0.395 | 20.75 | (7) | 1.73 | 2.00 | 1.82 | 0.64 | (1) | 21 cm |
| Q12502631 | Q1247267 | 2.038 | 15.8 | 1.223 | 19.87 | (2) | 0.23 | 0.51 | 0.43 | 0.24 | (1) | H I |
| Q13256515 | 4C65.15 | 1.624 | 17.5 | 1.610 | 19.76 | (1) | 0.88 | 2.20 | 1.85 | 0.16 | (5) | Mg II |
| Q13313030 | Q1328307/3C286 | 0.849 | 17.2 | 0.692 | 21.19 | (7) | 0.21 | 0.31 | 0.25 | 0.36 | (1) | 21 cm |
| Q13314101 | PG1329412 | 1.937 | 17.2 | 1.282 | 19.86 | (1) | … | 0.49 | 0.31 | 0.3 | (5) | Mg II |
| Q13314101 | PG1329412 | 1.937 | 17.2 | 1.601 | 19.33 | (1) | 0.2 | 0.70 | 0.35 | 0.2 | (5) | Mg II |
| Q13543139 | Q1351318 | 1.326 | 17.4 | 1.149 | 20.23 | (2) | 1.12 | 2.10 | 1.53 | 0.75 | (1) | H I |
| Q13572537 | Q1354258 | 2.032 | 18.5 | 1.420 | 21.54 | (2) | 0.55 | 0.61 | 0.50 | 0.20 | (5) | Mg II |
| Q14294747 | PG1427480 | 0.221 | 16.3 | 0.120 | 19.73 | (1) | 0.40 | 0.78 | 0.66 | 0.5 | (6) | Mg II |
| Q16242345 | Q1622238/3C336 | 0.927 | 17.5 | 0.656 | 20.36 | (3) | 1.13 | 1.52 | 1.27 | 0.39 | (1) | Mg II |
| Q16311156 | Q1629120 | 1.795 | 18.5 | 0.532 | 20.70 | (3) | 0.68 | 1.55 | 1.34 | 0.43 | (1) | Mg II |
| Q21311207 | Q2128123/PHL1598 | 0.501 | 15.5 | 0.430 | 19.55 | (1) | 0.27 | 0.41 | 0.37 | 0.10 | (5) | H I |
a Quasar with Broad Absorption Lines (BAL).
b Gravitationally lensed quasar.
References:
(1) This work;
(2) Pettini et al. 1999;
(3) Chen & Lanzetta 2003;
(4) Ledoux et al. 2002;
(5) Rao & Turnshek 2000;
(6) Churchill 2001;
(7) Boissé et al. 1998;
(8) Boissé et al. 1990;
(9) Lanzetta 1997;
(10) Zuo et al. 1997;
(11) Miller et al. 1999;
(12) Turnshek & Rao 2002;
3.2 Metal Equivalent Widths
We compare the Mg II/Fe II EW distribution of Mg II-selected and classical systems. A simple picture would have Mg ii equivalent widths correlating with the column densities. Indeed, Churchill et al. (2000) observe that at the Mg II equivalent widths are dominated by kinematic spreads. They propose that these could be directly correlated to column density, implying in turn a correlation between EW and .
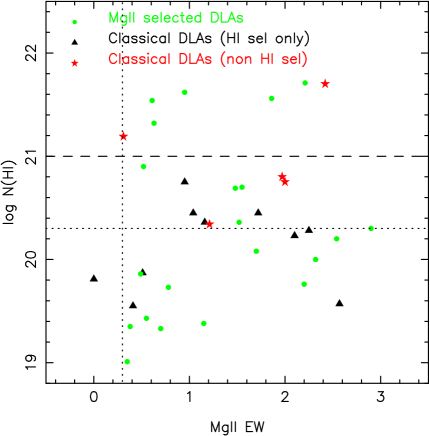
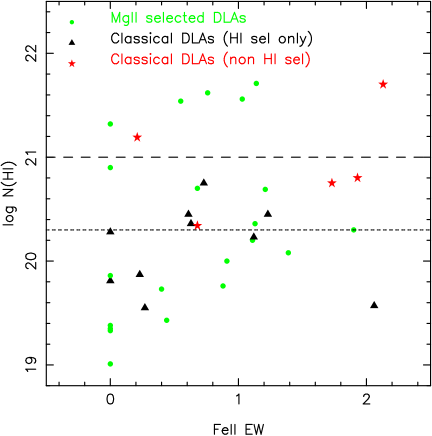
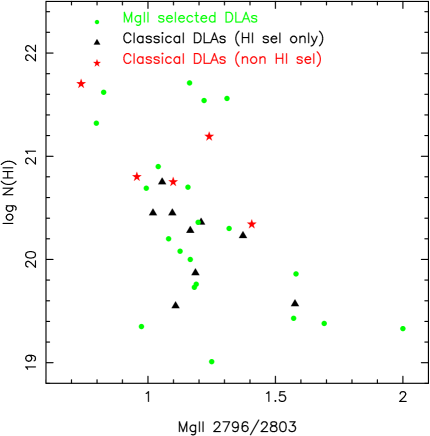
In order to address this issue we plot in Figure 3 Mg II 2796 (top panel) and Fe II 2600 (bottom panel) equivalent widths for each of the 36 systems. Upper limits and non-detections are plotted at zero.
In their work, Rao & Turnshek (2000) look for DLAs only when Mg II 2796 has a rest equivalent width EW0.3Å. This is illustrated in the top panel of Figure 3 by the vertical dotted line. It can be seen that indeed such a criterion is appropriate for selecting DLAs with ) cm-2 (which is precisely the aim of these authors), while any higher Mg II EW threshold will miss a fraction of the absorbers. This DLA definition is represented by the horizontal dotted line. In the present work, we extended both classical and Mg II-selected samples to the sub-DLA definition in order to get larger samples. We note that even down to lower column densities, the rest equivalent width threshold set by Rao & Turnshek (2000) is still a good tracer of quasar absorbers.
Nevertheless, it is puzzling to notice that the majority of absorbers with ) (horizontal dashed line) are Mg II-selected, while fewer of these systems have . Conversely, in general classical absorbers do not have such high column densities and this regardless of the way they have been selected (direct H I selection, 21 cm or known galaxy).
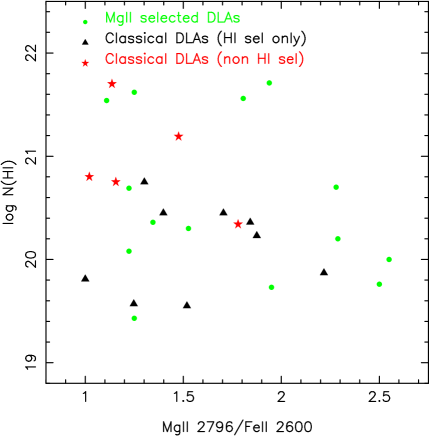
In Figure 4, we plot the ) column density as a function of metal equivalent widths ratios. The top panel shows while the bottom panel displays . We find again that both classical and Mg II-selected absorbers span a similar parameter range for both these quantities.
4 Distributions
4.1 Comparison of the Two Samples
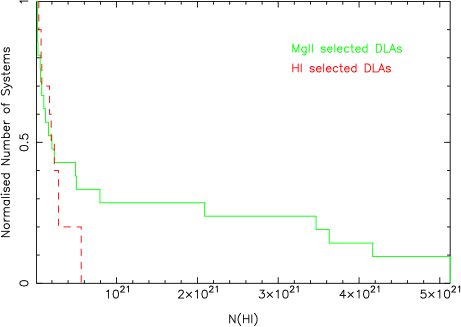
In this section, we analyse the normalised cumulative distributions of the Mg II-selected sample and compare it with a purely H I-selected sample. This distribution directly impacts measurements of the cosmological mass density, . Here, the Mg II-selected sample presented in section 3.1 is compared with the sample of DLAs/sub-DLAs selected only on their H I. The latter does not include absorbers selected at 21cm or otherwise but solely H I-selected systems. Therefore the total sample is now composed of 31 absorbers, 21 of which are Mg II-selected. Figure 5 presents the normalised cumulative distributions for these. The Mg II-selected curve is different from the other at the high column density end. In particular, there are systems with )21.0 in the Mg II-selected sample while H I-selected systems are never found to have ) 20.8. This cannot be due to a bias in the H I-selected sample, since that selection method should in principle favour high column densities. A Kolmogorov-Smirnov (KS) test shows that the two distributions are consistent at a 0.56 level of probability, but clearly we are dealing with small number statistics. In any case, the sheer fraction of high column density systems will in turn affect the determination of computed directly from the integration of the distribution function.
Further, we find that by comparing systems with )20.3 only, none of the H I-selected DLAs have ) 21 (out of 4), while 50% (5 out of 10) of the Mg II-selected DLAs have ) 21 (see Figure 3). Assuming a poisson distribution, the probability of obtaining zero H I-selected DLAs at ) 21 when expected 2 (i.e. half of 4) is 13.5%. Therefore the absence of H I-selected ) 21 systems might also be due to statistical fluctuation. When all classical DLAs are taken into account: only 25% (2 out of 8) have 21 even though these have been selected using different techniques. Already Rao & Turnshek (2000) note that the comparison of a sample of local gas-rich galaxies studied in 21 cm emission (=0) with Mg II-selected low redshift DLAs (=0.5) show an unexpectedly high rate of occurrence of very large column densities. This could be due to redshift evolution or the selection methods or a combination of both.
Therefore, the Mg II-selected sample has a higher fraction of ) 21 systems, but only marginally. Given the impact of this on , we try to identify what could be the origin of such a discrepancy by testing various scenarii in the following sections.
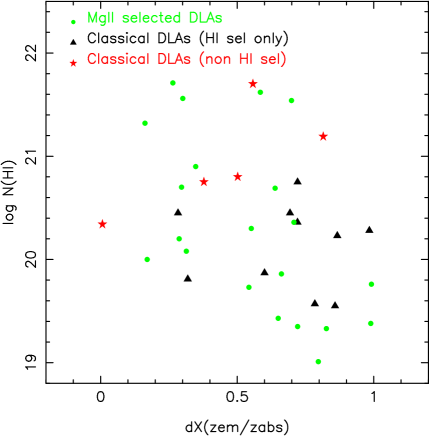
4.2 Gravitational Lensing
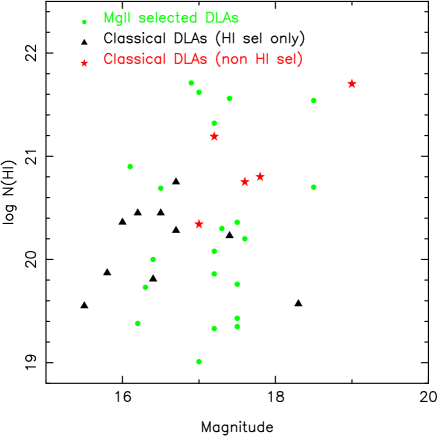
Another effect possibly at play could be gravitational lensing of the background quasar by the absorber itself. This could amplify the luminosity of the quasars and therefore make them preferentially selected as they would be easier targets to observe. In order to check whether gravitational lensing affects differently the two samples of absorbers, we plot the apparent magnitude of quasars for the samples of classical and Mg II-selected DLAs/sub-DLAs. Looking at the top panel of Figure 6, we find no evidence that the two populations are composed of quasars with different magnitude ranges. There might be hints of a trend where higher column density absorbers are found in fainter quasars, probably a signature of extinction by dust (Boissé et al. 1998), but this result is not currently statistically significant.
In order to test further the strong lensing hypothesis, we perform another test. It is known from gravitational lensing theory that the magnification effects are maximised when the lensing object is midway between the source and the observer in physical space. In our given cosmology, the physical distances can be expressed as:
| (1) |
In the bottom panel of Figure 6, we plot the ratio of the distance to the absorber over the distance to the quasar. The configuration which would most favour the occurence of gravitational lensing would have this ratio equal to 0.5. In our study, the two samples of absorbers do not show any significant difference. Therefore, gravitational lensing does not appear to be a viable explanation for the observed discrepancy in ) distributions of the classical and Mg II-selected DLAs/sub-DLAs. This finding is further supported by the results of Le Brun et al. (2000) who have used the DLA sample of Le Brun et al. (1997) to show that the amplification due to the presence of an absorber along the quasar line of sight does not exceed 0.3 mag.
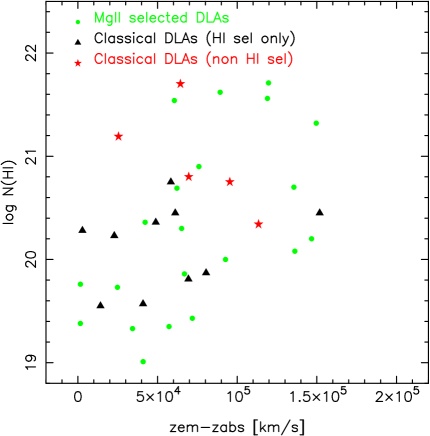
4.3 Associated Systems and Evolutionary Effects
Another scenario would have the absorbers associated with the quasar rather than being truly intervening systems. In order to test this hypothesis, we compute the velocity difference between the absorbers and the quasars themselves on the basis that the former are actually associated systems. The in km/s can be expressed as:
| (2) |
where is the speed of light in km/s. The result is shown in Figure 7. Interestingly, there seems to be a hint of a correlation between ) and for the Mg II-selected population, while this is not true for the classical DLAs/sub-DLAs. In any case, we see no differences between the two samples which could possibly explain their apparent discrepancy in terms of distributions.
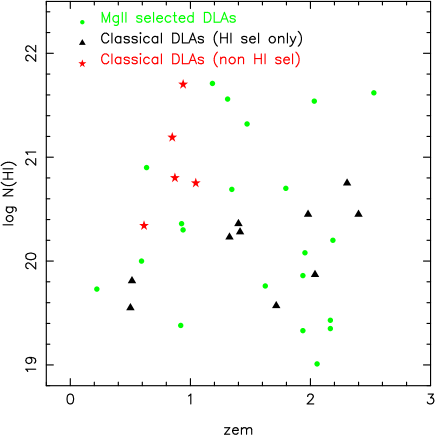
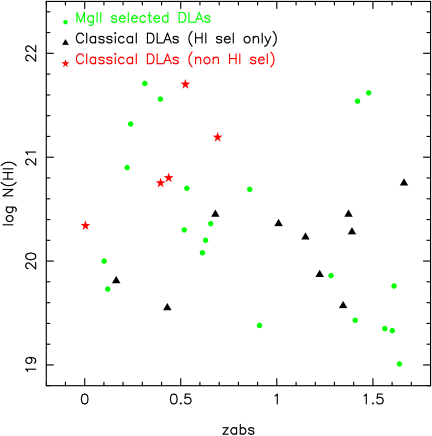
Finally, we test for potential evolutionary effects by analysing ) as a function of quasar emission redshift (top panel of Figure 8) and absorber redshift (bottom panel of Figure 8). Again, we find no obvious trend, and the two populations of quasar absorbers appear to sample the same parameter space.
5 Discussion and Conclusion
In this study, we compare the properties of the complete samples of Mg II-selected absorbers and more “classical” DLAs at . Constructing well-defined samples has proven a challenging task given the difficulties to build a homogeneous H I-selected sample. Nevertheless, we find that the metal EW criterion used by Rao & Turnshek (2000) to select DLAs traces well the population of these systems down to the )19.0. Moreover, we find that the Mg II-selected sample presented has a marginally larger fraction of absorbers with )21.0 than seen otherwise at low redshift. This property might in turn affect our estimates of which is dominated by the highest H I column densities.
We investigate the origin of the potential discrepancy and find that ) does not correlate in a significant way with either metal equivalent widths or ratios of combination of equivalent widths, quasar magnitude, quasar emission redshift, absorber redshift, velocity distance from the absorber to the quasar, or position of the absorber with respect to the quasar in physical space (a test for the gravitational lensing hypothesis). We conclude that the marginal discrepancy in distributions between the Mg II-selected ones and those discovered with other techniques most likely arises from small number statistics.
We note that regardless of the physical reason for selecting high-column density systems, these absorbers will directly affect calculation of at low redshift. In particular, comparison of calculations dominated by Mg II-selected absorbers at with high-redshift systems selected solely on H I might not be appropriate if the two methods are not consistent. Furthermore, if there is a discrepancy between classical and Mg II-selected absorption systems and if it holds at high-redshift, it would imply that H I-selected surveys for DLAs/sub-DLAs at z2 have been missing a large fraction of the neutral gas.
Since the Mg II method has proven an extremely efficient technique to find low redshift absorbers, we anticipate that forthcoming observations will help extend and refine the current results. Therefore, larger samples are required in order to better constrain at and enable comparison with high redshift results.
6 Acknowledgments
We thank Alberto Buzzoni for performing the TNG observations in service mode, Marisa Girardi and Piercarlo Bonifacio for hints on blue wavelength calibration, Jean-Claude Bouret for help with MAST and Patrick Petitjean for comments on an earlier version of the manuscript. We are grateful to the referee, Sandhya Rao, for openly providing objective and expert suggestions which improved our study. CP is supported by a Marie Curie fellowship. This work is supported in part by the European Communities RTN network ”The Physics of the Intergalactic Medium”. Based on observations made with the Italian Telescopio Nazionale Galileo (TNG) operated on the island of La Palma by the Centro Galileo Galilei of the INAF (Istituto Nazionale di Astrofisica) at the Spanish Observatorio del Roque de los Muchachos of the Instituto de Astrofisica de Canarias.
References
- [] Boissé, P. & Boulade, O., 1990, A&A, 236, 291.
- [] Boissé, P., Le Brun, V., Bergeron, J. & Deharveng, J-M., 1998, A&A, 333, 841.
- [] Churchill, C.W., Mellon, R.R., Charlton, J.C., Jannuzi, B.T., Kirhakos, S., Steidel, C.C., & Schneider, D.P., 2000, ApJ, 543, 577
- [] Churchill, C.W., 2001, ApJ, 560, 92
- [] Chen, H-W., & Lanzetta, K., 2003, ApJ, 597, 706
- [] Fontana A., & Ballester P., 1995, Messenger, 80, 37
- [] Kulkarni, V.P. & Fall, S.M., 2002, ApJ, 580, 732
- [] Lanzetta K., McMahon R.G., Wolfe A., Turnshek D., Hazard C., & Lu L., 1991, ApJS, 77, 1
- [] Lanzetta, K.M., Wolfe, A.M. & Turnshek, D.A., 1995, ApJ, 440, 435
- [] Lanzetta, K.M., et al., 1997, AJ, 114, 1337
- [] Le Brun, V., Bergeron, J., Boissé, P. & Deharveng, J-M., 1997, A&A, 321, 733
- [] Le Brun, V., Smette, A., Surdej, J., & Claeskens, J.-F., 2000, A&A, 363, 837
- [] Ledoux, C., Bergeron, J. & Petitjean, P., 2002, A&A, 385, 802
- [] Miller, E., Knezek, P., & Bregman, J., 1999, ApJ, 510, 95
- [] Nagamine, K., Springer, V. & Hernquist, L., 2003, MNRAS, in press, astro-ph/0302187
- [] Pei Y., & Fall M., 1995, ApJ, 454, 69
- [] Péroux, C., Dessauges-Zavadsky, M., D’Odorico, S., Kim, T.S. & McMahon, R.G., 2003a, MNRAS, 345, 480.
- [] Péroux, C., McMahon, R.G., Storrie-Lombardi, L.J. & Irwin, M., 2003b, MNRAS, 346, 1103.
- [] Pettini, M., Ellison, S. L., Steidel, C. C., & Bowen, D. V., 1999, ApJ 510, 576.
- [] Prochaska, J.X., Gawiser, E., Wolfe, A.M., Castro, S., & Djorgovski, S.G., 2003, ApJ, 595L, 9
- [] Rao, S.M., 1994, Ph.D. Thesis, Pittsburgh University.
- [] Rao, S.M., & Turnshek, D.A., 2000, ApJS, 130, 1
- [] Rao, S.M., Turnshek, D.A., & Briggs, F., 1995, ApJ, 449, 488
- [] Savaglio S., 2001, in Harwit M., ed., Proc. IAU Symp. 204, The Extragalactic Infrared Background and its Cosmological Implications. Astron. Soc. Pac., San Francisco, p. 307
- [] Storrie-Lombardi, L.J., McMahon, R.G., & Irwin, M., 1996, MNRAS, 283, L79
- [] Storrie-Lombardi, L.J. & Wolfe, A.M., 2000, ApJ, 543, 552
- [] Turnshek, D. A., Rao, S. M. & Nestor, D. B., ASP Conference Proceedings Vol. 254. Ed J. S. Mulchaey & J. Stocke. ASP, 2002., p.42
- [] Turnshek, D. A., Rao, S. M., Nestor, D. B., Vanden Berk, D., Belfort, M., & Monier, E. M., 2004, ApJL, in press (astro-ph/0404609)
- [] Vladilo, G., Bonifacio, P., Centurión, M., & Molaro, P., 2000, ApJ, 543, 24
- [] Wolfe A., Lanzetta K.M., Foltz C.B., & Chaffee F.H., 1995, ApJ, 454, 698
- [] Zuo, L., Beaver, E., Burbidge, M., Cohen, R., Junkkarinen, V., & Lyons, R., 1997, ApJ, 477, 568
- [] Zwaan, M. A., Briggs, F.H., Sprayberry, D., & Sorar, E., 1997, ApJ, 490, 173
- [] Zwaan, M. A. et al., 2003, AJ, 125, 2842