Dense gas in nearby galaxies
A multi-line millimeter-wave study of the nearby starburst galaxy NGC 4945 has been carried out using the Swedish-ESO Submillimeter Telescope (SEST). The study covers the frequency range from 82 GHz to 354 GHz and includes 80 transitions of 19 molecules. 1.3 mm continuum data of the nuclear source are also presented. An analysis of CO and 1.3 mm continuum fluxes indicates that the conversion factor between H2 column density and CO =1–0 integrated intensity is smaller than in the galactic disk by factors of 5–10. A large number of molecular species indicate the presence of a prominent high density interstellar gas component characterized by 105 cm-3. Some spectra show Gaussian profiles. Others exhibit two main velocity components, one at 450 km s-1, the other at 710 km s-1. While the gas in the former component has a higher linewidth, the latter component arises from gas that is more highly excited as is indicated by HCN, HCO+ and CN spectra. Abundances of molecular species are calculated and compared with abundances observed toward the starburst galaxies NGC 253 and M 82 and galactic sources. Apparent is an ‘overabundance’ of HNC in the nuclear environment of NGC 4945. While the HNC/HCN =1–0 line intensity ratio is 0.5, the HNC/HCN abundance ratio is 1. From a comparison of Ka=0 and 1 HNCO line intensities, an upper limit to the background radiation of 30 K is derived. While HCN is subthermally excited (8 K), CN is even less excited (3–4 K), indicating that it arises from a less dense gas component and that its =2–1 line can be optically thin even though its =1–0 emission is moderately optically thick. Overall, fractional abundances of NGC 4945 suggest that the starburst has reached a stage of evolution that is intermediate between those observed in NGC 253 and M 82. Carbon, nitrogen, oxygen and sulfur isotope ratios are also determined. Within the limits of uncertainty, carbon and oxygen isotope ratios appear to be the same in the nuclear regions of NGC 4945 and NGC 253. High 18O/17O, low 16O/18O and 14N/15N and perhaps also low 32S/34S ratios (6.40.3, 19545, 10525 and 13.52.5 in NGC 4945, respectively) appear to be characteristic properties of a starburst environment in which massive stars have had sufficient time to affect the isotopic composition of the surrounding interstellar medium.
Key Words.:
ISM: abundances – ISM: molecules – galaxies: individual: NGC 4945 – galaxies: starburst1 Introduction
NGC 4945, a nearby edge-on (=78∘) spiral starburst galaxy at a systemic velocity of 560 km s-1 (e.g. Ott et al. 2001), is one of the three brightest IRAS point sources ( = 686 Jy; IRAS 1989) beyond the Magellanic clouds and a goldmine for molecular cloud research. NGC 4945 contains a highly obscured ‘compton thick’ (e.g. Maiolino et al. 1999) Seyfert 2 nucleus and is classified as SB(s)cd or SAB(s)cd. Being a member of the Centaurus group, its distance was estimated to lie between 3.9 Mpc (de Vaucouleurs 1964; Bergman et al. 1992) and 8.1 Mpc (Baan 1985). The value of 6.7 Mpc is most often used (e.g. Dahlem et al. 1993; Henkel et al. 1994a, hereafter H94; Ott et al. 2001), but 4 Mpc (20′′ correspond to 390 pc) is a more realistic estimation (Bergman et al. 1992) and will be used throughout the article.
Numerous studies from the cm-waveband to hard X-rays have been made towards this prominent southern galaxy. Associated with the nuclear region is a strong radio continuum source with = 4.8 Jy (Whiteoak & Bunton, 1985; Ott et al. 2001) and the first known megamaser (Dos Santos & Lépine 1979; Batchelor et al. 1982), detected in the 22 GHz water vapor line. Numerous molecular emission lines were detected, initially at cm and later at mm wavelengths (Whiteoak & Gardner 1975; Whiteoak & Wilson 1990; Henkel et al. 1990; H94; Curran et al. 2001, hereafter C01). An edge-on nuclear gas ring with a size of 30′′ was discovered by Whiteoak et al. (1990) in the 12C16O =1–0 line. A detailed analysis of 12C16O and 13C16O profiles by Bergman et al. (1992) and additional CO observations by Dahlem et al. (1993) and Mauersberger et al. (1996a) further support the presence of this ring. An HCN map indicates that low and high density molecular gas coexists in the central 30′′ (H94). On a much smaller scale, the distribution of H2O megamaser emission suggests the presence of a circumnuclear disk with a radius of 20 milliarcseconds and a binding mass of 106 M⊙ (Greenhill et al. 1997).
A nuclear source with a column density of (H) 41024 cm-2 and possibly disk-like morphology is indicated by X-ray data (Done et al. 2003). Strongly processed ices were detected near 4.65m in the more extended nuclear environment (Spoon et al. 2003). A conical wind-blown cavity was revealed by ground based spectra and images at optical and IR wavelengths (Nakai 1989; Moorwood et al. 1996). With the NICMOS Camera on-board of the Hubble Space Telescope (HST) a starburst ring of size 5′′ was found in Pa ; the walls of a conical cavity blown by supernova driven winds were detected in H2 (Marconi et al. 2000). X-ray observations reveal a complex morphology including a strong variable nuclear source at 2–10 keV and a conically shaped ‘plume’ at 0.3–2 keV (Schurch et al. 2002).
To better understand the nuclear environment of NGC 4945, we present observations of a large number of molecular lines towards its central region and calculate relative abundances, isotope ratios and H2 densities.
| (GHz) | (arcsec) | (pc) | (K) | |
|---|---|---|---|---|
| 82–99 | 63–53 | 1220–1030 | 150–200 | 0.78–0.73 |
| 100–153 | 52–34 | 1000–660 | 300–400 | 0.73–0.61 |
| 154–230 | 33–22 | 640–420 | 600–1000 | 0.61–0.46 |
| 241–267 | 21–19 | 410–370 | 1500–2300 | 0.44–0.41 |
| 330–354 | 19–15 | 370–290 | 3000 | 0.32–0.30 |
-
a)
Full width to half power (FWHP) beam widths. To establish linear scales, =4 Mpc was adopted.
-
b)
System temperatures in units of main beam brightness temperature ()
-
c)
Beam efficiencies derived from measurements of Jupiter (L. Knee, priv. comm.)
2 Observations
2.1 Spectroscopic observations
The observations were carried out in May 1994, September 1995, March and June 1996, January and July 1997, January and July 1998, September 2001 and February 2003 with the 15-m SEST telescope at La Silla. 3 mm and 2 mm receivers as well as 3 mm and 1.3 mm receivers were employed simultaneously. For the observations at 330–354 GHz, another SIS receiver was used that was described in detail by Mauersberger et al. (1996a). Two acousto-optical backends (AOS) each covered a bandwidth of 1 GHz. With a total of 1600 and 1440 channels, the channel spacing was 0.68 MHz.
All measurements were made in a dual beam switching mode (switching frequency 6 Hz) with a beam throw of 11′40′′ in azimuth. Since rapid beam switching was used in conjunction with reference positions on both sides of the galaxy, baselines are of good quality. Calibration was obtained with the chopper wheel method (for internal consistency and comparisons with other telescopes, see e.g. Sect. 3.2 and H94 (their Sect. 2) and Chin et al. (1996, their Sect. 2)). Observed frequency ranges, beam widths, system temperatures and beam efficiencies are given in Table 1. The latter, measured at 94, 115, 230 and 345 GHz, were interpolated and, if necessary, also extrapolated to convert antenna temperatures () to a main beam brightness temperature () scale. The pointing accuracy, obtained from measurements of the nearby continuum source Cen A, was mostly better than 10′′ (see Sect. 3.2).
2.2 1.3 mm continuum measurements
In July 1997, we mapped the 1.3 mm continuum emission toward the central region of NGC 4945 with a single pixel bolometer at the SEST. We first searched for extended emission by mapping a area using the on the fly dual beam technique. In addition, the inner were mapped in raster mode yielding a better signal-to-noise ratio.
Dual beam switching was performed using the SEST focal plane chopping mirror with an offset of 67.5′′ in azimuth and 3′′ in elevation. Pointing was frequently checked on Cen A and on NGC 4945 itself. The mean pointing accuracy was . Uranus was used as the primary calibrator with an assumed flux density of 37 Jy/beam. Fitting two dimensional (2D) Gaussians to maps of Uranus yields a deconvolved full width to half power (FWHP) beam size of . The sensitivity of the bolometer system was determined to be 190 mJy/beam s-1.
The double beam maps were taken in a horizontal system with an extent of , a scanning velocity of 8′′/s in azimuth, and a step size in elevation of 8′′. We took 36 individual maps, which were corrected for atmospheric extinction using opacities obtained from skydips, and for the SEST gain-elevation curve. Using the MOPSI package, the double beam maps were converted into single-beam maps and transformed into equatorial coordinates. The final coadded map has an rms of 30 mJy/beam. The raster map was taken in asymmetric on-off mode (off-on-on-on, 10 s each phase) with an accumulated integration time of 300 s per point, thus reaching an rms of 11 mJy/beam. The 1.3 mm emission is slightly more extended than the beam size. Fitting a 2D Gaussian to the on the fly map the FWHP extent is with a position angle of 15o, corresponding to a deconvolved size of or pc. Both the on-the-fly map and the raster map yield a maximum flux of 1.4 Jy/beam including the line emission. The flux density of the total emission mapped in our OTF map is Jy of which Jy come from the Gaussian shaped central emission. Again these values also include spectral line emission. The separation of line and continuum flux and a column density estimate are presented in Sect. 8.1.
3 Results
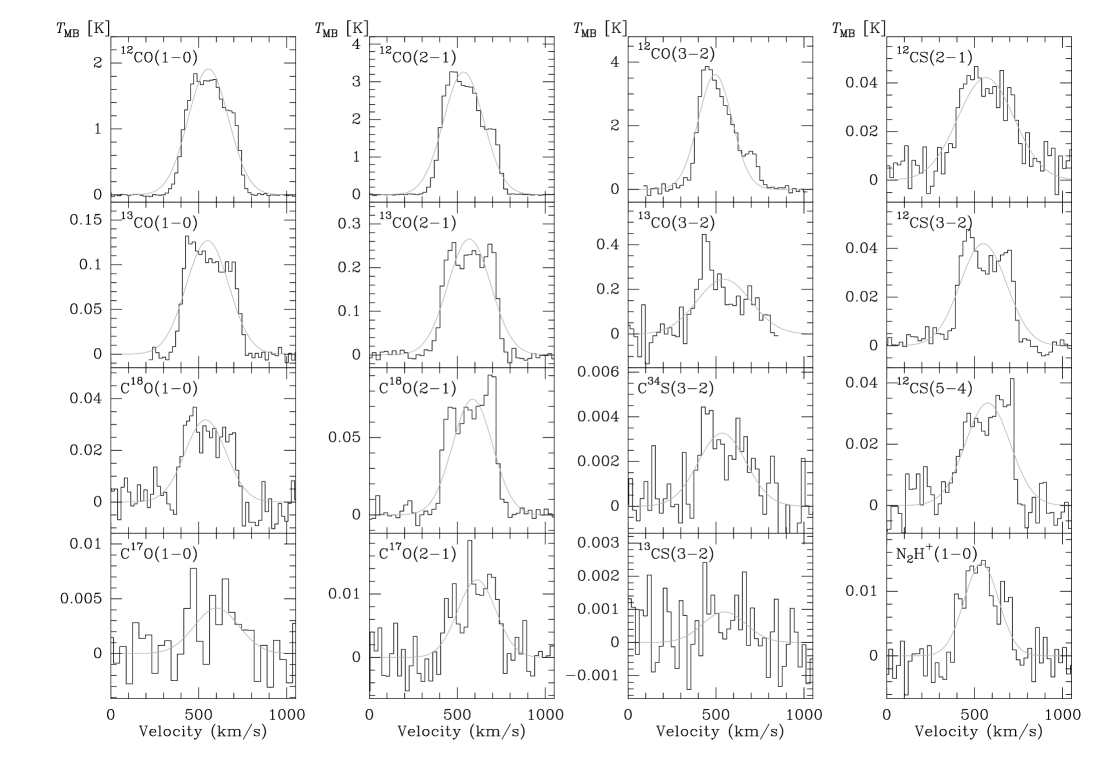
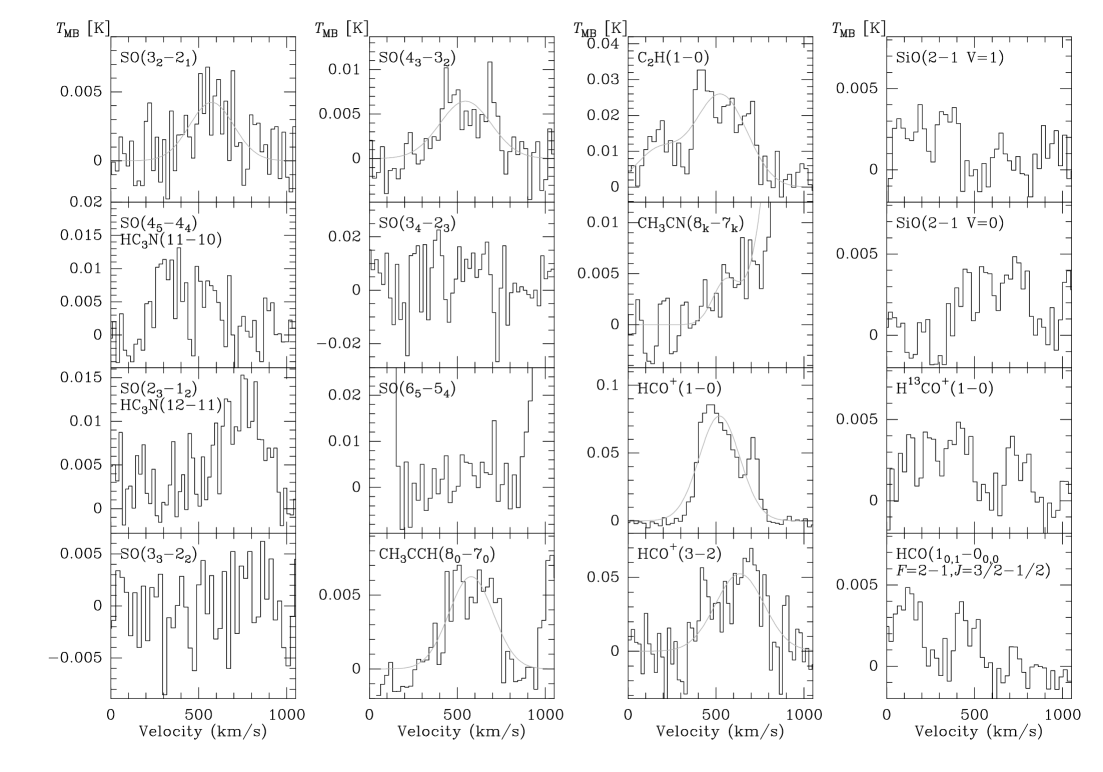
3.1 The observed line profiles
Figs. 1–5 display the spectra from a total of 19 molecular
species that were measured toward the nuclear region of NGC 4945,
nominally within 2′′ of , (J2000.0). According to the
overall rotation curve (see Fig. 5 in Mauersberger et al. 1996a),
blue-shifted line emission should arise southwest, red-shifted
emission should originate northeast of the dynamical center. For
lineshapes, see H94 (their Sect. 5.2). Gaussian line parameters
to provide integrated intensities are given in Table 2, including
49 detected line features, 9 tentatively detected transitions and
22 undetected lines (for the notes to Table 2, see footnote
111 a) ‘+’: detection; ‘’: non-detection; ‘?’: tentative
detection ‘B’: blended with
other lines, ‘N’: no baseline.
b) Integrated from 300 to 800 km s-1 after subtracting a first order baseline
or a constant offset in . The errors were derived from Gaussian fits
and do not account for calibration and pointing uncertainties.
c) Obtained from single component Gaussian fits. =
4.5 km s-1.
d) rms values for a 20 km s-1 channel width on a scale.
e) Channel spacings after smoothing as shown in Figs. 15.
)
| Transition | Frequency | Detectiona) | db) | c) | c) | rmsd) | e) | |||
| (MHz) | (K km s-1) | (km s-1) | (km s-1) | (mK) | (km s-1) | |||||
| HC3N 9–8 | 81881.468 | + | 2.16 | 0.50 | 554.7 | 28.4 | 233.2 | 54.8 | 7.2 | 24.9 |
| C3H2 21,2–10,1 | 85338.905 | + | 2.71 | 0.26 | 515.8 | 21.8 | 459.5 | 48.2 | 1.9 | 23.9 |
| C3H2 43,2–42,3 | 85656.422 | + | 1.00 | 0.16 | 494.6 | 20.3 | 239.5 | 36.4 | 2.4 | 24.1 |
| HC15N 1–0 | 86054.961 | + | 0.46 | 0.05 | 540.5 | 12.2 | 235.9 | 28.1 | 1.4 | 24.1 |
| SiO 2–1 =1 | 86243.442 | … | … | … | 1.9 | 24.1 | ||||
| H13CN 1–0 | 86340.184 | + | 0.96 | 0.08 | 551.1 | 12.8 | 301.2 | 21.6 | 1.0 | 23.6 |
| HCO 10,1–00,0, =3/2–1/2 | 86670.820 | B | 0.38 | see Sect. 5.3 | 2.1 | 23.5 | ||||
| H13CO+ 1–0 | 86754.294 | B | 0.59 | see Sect. 5.3 | 2.1 | 23.5 | ||||
| SiO 2–1 =0 | 86846.998 | B | 0.74 | see Sect. 5.3 | 2.1 | 23.5 | ||||
| HN13C 1–0 | 87090.942 | + | 1.06 | 0.13 | 615.0 | 21.8 | 358.0 | 48.8 | 1.5 | 23.5 |
| C2H 1–0 | 87316.925 | + | 10.7 | 0.82 | 511.0 | 13.4 | 391.2 | 36.2 | 7.4 | 23.3 |
| HNCO 41,4–31,3 | 87597.333 | … | … | … | 1.9 | 23.3 | ||||
| HNCO 40,4–30,3 | 87925.238 | + | 2.83 | 0.55 | 575.0 | 27.5 | 289.6 | 64.0 | 4.5 | 23.2 |
| HCN 1–0 | 88631.847 | + | 22.4 | 0.40 | 549.7 | 2.8 | 304.8 | 5.6 | 10.5 | 23.0 |
| HCO+ 1–0 | 89188.518 | + | 24.0 | 0.20 | 522.4 | 1.2 | 284.9 | 2.7 | 5.2 | 22.9 |
| HNC 1–0 | 90663.543 | + | 12.0 | 0.22 | 536.6 | 3.0 | 309.3 | 6.2 | 2.9 | 22.4 |
| HC3N 10–9 | 90978.993 | + | 1.99 | 0.21 | 527.2 | 15.7 | 288.8 | 28.7 | 2.8 | 22.4 |
| N2H+ 1–0 | 93171.947 | + | 3.50 | 0.27 | 539.0 | 9.1 | 230.3 | 18.5 | 4.0 | 21.9 |
| CH3OH 21–11 A+ | 96396.010 | ? | 1.55 | 0.33 | 468.3 | 33.1 | 294.5 | 61.6 | 3.0 | 21.5 |
| CH3OH 2–1 | 96741.420 | + | 6.00 | 0.38 | 576.8 | 7.8 | 245.6 | 17.6 | 3.6 | 21.5 |
| OCS 8–7 | 97301.208 | … | … | … | 1.9 | 21.0 | ||||
| CS 2–1 | 97980.968 | + | 16.9 | 0.91 | 564.8 | 9.7 | 378.6 | 25.5 | 6.6 | 20.8 |
| SO 32–21 | 99299.879 | + | 1.24 | 0.28 | 568.9 | 25.9 | 259.9 | 75.6 | 2.6 | 20.5 |
| SO 45–44 | 100029.569 | B | … | … | … | 1.9 | 20.4 | |||
| HC3N 11–10 | 100076.389 | + | 2.92 | 0.35 | 542.9 | 23.2 | 341.2 | 42.7 | 4.6 | 20.4 |
| 13CN 1–0, =1/2–1/2 | 108657.646 | … | … | … | 1.9 | 18.8 | ||||
| 13CN 1–0, =3/2–1/2 | 108780.201 | … | … | … | 1.9 | 18.8 | ||||
| HC3N 12–11 | 109173.634 | + | 4.18 | 0.38 | 521.7 | 15.1 | 341.1 | 39.0 | 4.5 | 18.7 |
| SO 23–12 | 109252.184 | B | … | … | … | 1.9 | 18.7 | |||
| OCS 9–8 | 109463.063 | ? | 2.93 | 0.67 | 669.9 | 34.7 | 483.9 | 122 | 4.3 | 18.7 |
| C18O 1–0 | 109782.160 | + | 9.29 | 0.42 | 539.2 | 6.4 | 274.8 | 12.5 | 12.9 | 18.6 |
| HNCO 50,5–40,4 | 109905.753 | ? | 1.13 | 0.43 | 478.7 | 44.5 | 200.3 | 62.3 | 5.5 | 18.6 |
| 13CO 1–0 | 110201.353 | + | 34.4 | 1.2 | 538.4 | 4.5 | 246.4 | 8.7 | 19.5 | 18.6 |
| C17O 1–0 | 112358.780 | + | 1.21 | 0.23 | 596.8 | 30.4 | 297.3 | 54.5 | 2.1 | 36.4 |
| CN 1–0, =1/2–1/2 | 113191.317 | + | 15.5 | 0.5 | 405.9 | 5.8 | 351.5 | 11.8 | 6.7 | 18.0 |
| CN 1–0, =3/2–1/2 | 113490.982 | + | 24.5 | 0.5 | 499.3 | 3.4 | 304.7 | 8.1 | 7.6 | 18.0 |
| CO 1–0 | 115271.204 | + | 523.1 | 1.5 | 545.5 | 0.4 | 268.8 | 0.9 | 50.8 | 17.7 |
| SO 33-22 | 129138.898 | … | … | … | 1.9 | 24.2 | ||||
| HNCO 60,6–50,5 | 131885.740 | + | 2.93 | 0.18 | 570.0 | 8.8 | 284.1 | 17.6 | 2.9 | 23.7 |
| HC3N 15–14 | 136464.400 | + | 2.13 | 0.29 | 582.2 | 18.9 | 249.0 | 32.2 | 5.4 | 22.9 |
| CH3CCH 80–70 | 136728.010 | + | 1.77 | 0.23 | 576.7 | 18.9 | 280.2 | 35.8 | 3.9 | 22.9 |
| SO 43–32 | 138178.648 | + | 2.41 | 0.15 | 548.0 | 11.2 | 335.1 | 21.5 | 2.4 | 22.6 |
| 13CS 3–2 | 138739.309 | ? | 0.28 | 0.10 | 547.8 | 51.9 | 289.2 | 93.3 | 8.9 | 22.5 |
| H2CO 21,2–11,1 | 140839.518 | + | 3.73 | 0.28 | 535.0 | 9.5 | 241.4 | 18.6 | 5.1 | 22.2 |
| C34S 3–2 | 144617.147 | + | 1.34 | 0.10 | 574.2 | 11.4 | 298.3 | 23.8 | 1.1 | 21.7 |
| DCN 2–1 | 144828.000 | N | … | … | … | 1.9 | 21.6 | |||
| CH3OH 3–2 | 145124.410 | + | 9.36 | 0.06 | 603.3 | 0.9 | 268.7 | 2.0 | 2.3 | 21.7 |
| HC3N 16–15 | 145560.946 | + | 5.02 | 0.19 | 518.8 | 6.2 | 327.6 | 13.5 | 3.0 | 21.4 |
| H2CO 20,2–10,1 | 145602.953 | + | 5.02 | 0.19 | 605.7 | 6.2 | 327.6 | 13.5 | 3.0 | 21.4 |
| CS 3–2 | 146969.049 | + | 13.9 | 0.2 | 549.4 | 2.2 | 311.5 | 4.1 | 5.8 | 21.4 |
| CH3CN 8k–7k | 147174.592 | ? | 0.77 | 0.12 | 555.2 | 23.4 | 173.5 | 40.0 | 2.0 | 21.2 |
| CH3OH 140–14-1 E | 150141.680 | ? | 1.65 | 0.28 | 460.6 | 27.7 | 311.5 | 54.2 | 4.7 | 20.7 |
| H2CO 21,1–11,0 | 150498.339 | + | 5.78 | 0.19 | 535.1 | 5.4 | 320.9 | 11.4 | 3.1 | 20.7 |
| C3H2 40,4–31,3 & 41,4–30,3 | 150835.000 | + | 1.79 | 0.22 | 576.4 | 16.7 | 259.5 | 30.2 | 4.1 | 20.7 |
| HNCO 70,7–60,6 | 153865.092 | + | 6.23 | 0.39 | 589.8 | 10.2 | 352.4 | 29.3 | 2.9 | 20.3 |
| HC3N 17–16 | 154657.283 | ? | 2.26 | 0.55 | 525.8 | 36.1 | 282.5 | 76.3 | 4.9 | 20.2 |
| SO 34–23 | 158971.814 | … | … | … | 1.9 | 19.6 | ||||
| H2CO 30,3–20,2 | 218222.191 | … | … | … | 1.9 | 19.0 | ||||
| HC3N 24–23 | 218324.744 | … | … | … | 1.9 | 22.9 | ||||
| C18O 2–1 | 219560.319 | + | 24.5 | 0.5 | 585.6 | 3.1 | 287.3 | 6.1 | 10.6 | 22.7 |
| HNCO 100,10–90,9 | 219798.282 | … | … | … | 1.9 | 22.7 | ||||
| SO 65–54 | 219949.391 | … | … | … | 1.9 | 18.9 | ||||
| 13CO 2–1 | 220398.686 | + | 81.2 | 0.7 | 568.1 | 1.3 | 287.3 | 2.5 | 15.1 | 22.6 |
| C17O 2–1 | 224714.368 | + | 3.31 | 0.31 | 611.4 | 12.3 | 252.7 | 25.6 | 4.1 | 22.2 |
| H2CO 31,2–21,1 | 225697.772 | ? | 1.73 | 0.46 | 567.3 | 36.0 | 247.9 | 60.2 | 5.6 | 22.1 |
| CN 2–1 | 226874.764 | + | 29.4 | 0.39 | 638.2 | 18.9 | 343.3 | 33.3 | 18.1 | 22.0 |
| CH3OH 211–200 E | 227094.600 | … | … | … | 1.9 | 22.1 | ||||
| HC3N 25–24 | 227418.957 | … | … | … | 1.9 | 22.1 | ||||
| CO 2–1 | 230538.000 | + | 920.9 | 0.6 | 555.8 | 0.1 | 275.1 | 0.2 | 25.6 | 21.6 |
| CH3OH 5–4 | 241767.224 | + | 6.80 | 0.88 | 582.5 | 21.8 | 325.0 | 43.7 | 6.5 | 20.6 |
| HNCO 110,11–100,10 | 241774.037 | B | 6.80 | 0.88 | 591.0 | 21.8 | 325.0 | 43.7 | 6.5 | 20.6 |
| CH3OH 51–41,A- | 243915.826 | … | … | … | 1.9 | 17.0 | ||||
| CS 5–4 | 244935.606 | + | 9.98 | 0.67 | 582.8 | 9.9 | 286.1 | 20.3 | 6.0 | 20.5 |
| CH3OH 21-3–21-2 A | 245223.000 | … | … | … | 1.9 | 20.4 | ||||
| H13CN 3–2 | 259011.790 | + | 0.98 | 0.17 | 543.3 | 21.7 | 250.7 | 46.9 | 8.1 | 19.4 |
| HCN 3–2 | 265886.432 | + | 29.6 | 0.7 | 592.6 | 4.1 | 352.6 | 8.1 | 27.9 | 18.8 |
| HCO+ 3–2 | 267557.625 | + | 18.3 | 1.9 | 635.2 | 17.0 | 330.7 | 37.8 | 20.3 | 18.6 |
| 13CO 3–2 | 330587.957 | + | 87.9 | 9.6 | 499.9 | 17.8 | 304.0 | 44.4 | 135 | 21.5 |
| CO 3–2 | 345795.991 | + | 870.6 | 7.7 | 495.9 | 1.0 | 226.8 | 2.5 | 211 | 20.6 |
| HCN 4–3 | 354505.472 | ? | 7.18 | 1.74 | 627.9 | 50.5 | 400.9 | 87.2 | 14.1 | 20.1 |
3.2 Line intensities
In order to compare our observational data with previously published results, we list in Table 3 integrated line intensities ( d) and peak line temperatures (). In columns 2 and 5, we display integrated intensities and peak line temperatures derived from our data. In columns 3, 4, 6 and 7, data from C01, H94 and Mauersberger et al. (1996a) are given. There is good agreement for the strong CO lines, i.e. CO and 13CO. Differences are 20% or less for the =1–0 and 2–1 transitions. Not surprisingly, for the weaker lines, differences are larger. This is likely a consequence of lower signal-to-noise ratios and a lower pointing quality, caused by pointing shifts during one hour long integrations and the fact that checks of the shape of the profile, showing whether the pointing was stable or not, were not possible for individual scans. Because the CO and 13CO spectra encompass the entire frequency range of our observations, we conclude that serious systematic calibration problems are absent in H94, Mauersberger et al. (1996a), C01 and our new data. Significant differences in line intensity and lineshape that are seen in the weaker lines are interpreted as the simultaneous consequence of noise and pointing errors and will be analysed in the following sections.
| line | d | |||||
|---|---|---|---|---|---|---|
| (K km s-1) | (K) | |||||
| (1)a | (2)b | (3)c | (4)d | (5)b | (6)c | (7)d |
| CO 1–0 | 523 | 510 | 466e | 1.8 | 1.7e | 1.6e |
| CO 2–1 | 921 | 740 | 1050 | 3.2 | 2.4 | 3.2 |
| CO 3–2 | 871 | 760 | 3.5 | 1.6 | 2.5f | |
| 13CO 1–0 | 34.4 | 30 | 32.3 | 0.12 | 0.114 | 0.107 |
| 13CO 2–1 | 81.2 | 86 | 123.2 | 0.24 | 0.37 | 0.4 |
| 13CO 3–2 | 88.0 | 0.30 | 0.25f | |||
| C18O 1–0 | 9.29 | 8.4 | 10.9 | 0.03 | 0.026 | 0.037 |
| C18O 2–1 | 24.5 | 29 | 32.4 | 0.07 | 0.12 | 0.12 |
| C17O 1–0 | 1.21 | 1.8 | 1.33 | 0.004 | 0.005 | 0.0057 |
| C17O 2–1 | 3.31 | 5 | 0.012 | 0.019 | ||
| CS 2–1 | 17.0 | 9.3 | 0.04 | 0.031 | ||
| CS 3–2 | 13.9 | 11 | 0.038 | 0.038 | ||
| HCN 1–0 | 22.4 | 24 | 23.5 | 0.065 | 0.08 | 0.08 |
| HCN 3–2 | 29.6 | 45 | 0.09 | 0.2 | ||
| HCO+ 1–0 | 24.0 | 21 | 0.08 | 0.08 | ||
| HCO+ 3–2 | 18.3 | 37 | 0.06 | 0.225 | ||
| H2CO 21,2–11,1 | 3.73 | 6.5 | 0.013 | 0.02 | ||
| H2CO 20,2–10,1 | 5.02 | 5.4 | 0.014 | 0.017 | ||
| H2CO 21,1–11,0 | 5.78 | 5.9 | 0.019 | 0.013 | ||
-
a
(1) lines selected from C01 except 13CO 3–2, which is from Mauersberger et al. 1996a;
-
b
(2) & (5) our data;
-
c
(3) & (6) C01;
-
d
(4) & (7) H94;
-
e
applied beam efficiencies for columns (4), (6) and (7): 0.75 for HCN 1–0 and HCO+ 1–0; 0.70 for CO 1–0, 13CO 1–0, C18O 1–0, C17O 1–0 and CS 2–1; 0.60 for CS 3–2 and the three H2CO lines; 0.50 for CO 2–1, 13CO 2–1, C18O 2–1, and C17O 2–1; 0.40 for CO 3–2, 13CO 3–2, HCN 3–2 and HCO+ 3–2;
-
f
Mauersberger et al. 1996a
3.3 Extent of the survey
The number of measured lines toward NGC 4945 is significantly larger than that in previous studies (Henkel et al. 1990; H94; C01). While the most complete study carried out so far, that of C01, contains a comparable number of lines from CO and its isotopomers as well as from H2CO, the number of CS and SO lines studied in our survey is larger. About 51% of the frequency range between 81.4 GHz and 115.8 GHz, 42% of the frequency range between 128.6 GHz and 159.5 GHz, and 27% of the frequency range between 217.7 GHz and 268.1 GHz are covered. Of particular importance is HC3N which was not clearly detected in any previous study (see H94 for a tentative detection) but which was detected in our survey in at least half a dozen of lines. This molecule is useful to determine H2 densities (e.g. Mauersberger et al. 1990) and can be used to check previously determined physical parameters of molecular clouds (e.g. C01). The (tentative) detection of a number of additional molecular species, like CH3CCH and CH3CN provides a broader view of chemical abundances while the detection of C34S and the non-detection of 13CN give new insights into isotopic ratios in the nuclear environment of NGC 4945 (see Henkel & Mauersberger 1993 and C01 for earlier summaries on extragalactic CNO isotope ratios, including NGC 4945).
4 Radiative transfer calculations
With the peak and integrated line intensities determined from our measured profiles, we can derive a number of relevant line intensity ratios that can be used to estimate density, column density and kinetic temperature. The excitation problem involves statistical equilibrium of a multilevel system that was solved in most cases by the Large Velocity Gradient (LVG) method. This allows us to determine a local source function in which optical depths are related to escape probabilities of the photons. The model gas cloud has spherical geometry and uniform kinetic temperature and density. While there may be molecules which are significantly affected by the intense radiation field in the nuclear region of NGC 4945 (for effects on HNCO, see Churchwell et al. 1986 and Sect. 4.9; for the negligible effects on CO, see Mao et al. 2000 and their Appendix C), such effects are difficult to quantify. If not said otherwise, a background temperature of 2.73 K is therefore used throughout the discussion.
With lineshapes being approximately similar (for a discussion of the moderate differences obtained, see e.g. Bergman et al. 1992 and H94), measured peak intensities (i.e. not the peak intensities obtained from Gaussian fits) appear to be more reliable input parameters for the model than integrated intensities (see Sect. 4.1). Taking CO source sizes according to Table 4 of C01, i.e. 29′′ for the =1–0, 20′′ for the 2–1 and 15′′ for the 3–2 transition, we corrected for beam dilution effects by calculating =/, with = /(+), and denoting the Gaussian FWHP source and beam size, respectively. Again following C01, for the other molecular species a source size of 20′′ was adopted. This appears to be a reasonable guess in view of the CO data and the extent of the 1.3 mm continuum emission (see Sect. 2.2). Table 4 gives beam dilution corrected line temperatures, which are used for the LVG calculations.
Results of the model calculations are shown below, displaying line intensities and line intensity ratios as a function of H2 density and molecular column density. Common to all these plots are source size averaged line temperatures. Cloud averaged line temperatures may be significantly larger, depending on the degree of clumping. To give an example: if the HCN =1–0 emission arises from the innermost 20′′ of the galaxy and if we assume a rotation temperature of =10 K and (HCN 1–0) 1 (H94), the ‘clumping factor’ within the 20′′ sized region would become 0.1. As long as the lines are optically thin, this does not imply a change in excitation or in the line temperature ratios. If, however, the transition from source to cloud averaged quantities involves optical depths near unity or higher, significant changes are expected.
In the following, LVG simulations are discussed for some of the most important molecular species, carefully discriminating between optically thick and optically thin line emission. Most calculations were made for kinetic temperatures of 50 and 100 K. Such high values are justified as e.g. suggested by the multilevel CO studies of Mao et al. (2000) and Bradford et al. (2003) on M 82 and NGC 253, respectively, and by the NH3 study of Mauersberger et al. (2003) towards NGC 253, Mafffei 2, IC 342, and M 82. As we shall see, even for = 100 K H2 densities are larger than previously anticipated (c.f. C01 and Sect. 7) and would have to be further enhanced if lower values would be adopted.
4.1 CO
Plotting CO/13CO =1–0 and 2–1 line intensity ratios as a function of velocity (Fig. 6), we obtain maxima and minima that agree with those shown by Bergman et al. (1992; their Figs. 2 and 3) for the =1–0 lines alone. This is consistent with the hypothesized ring-like morphology of the emitting gas (see also Whiteoak et al. 1990; Dahlem et al. 1993; Mauersberger et al. 1996a).
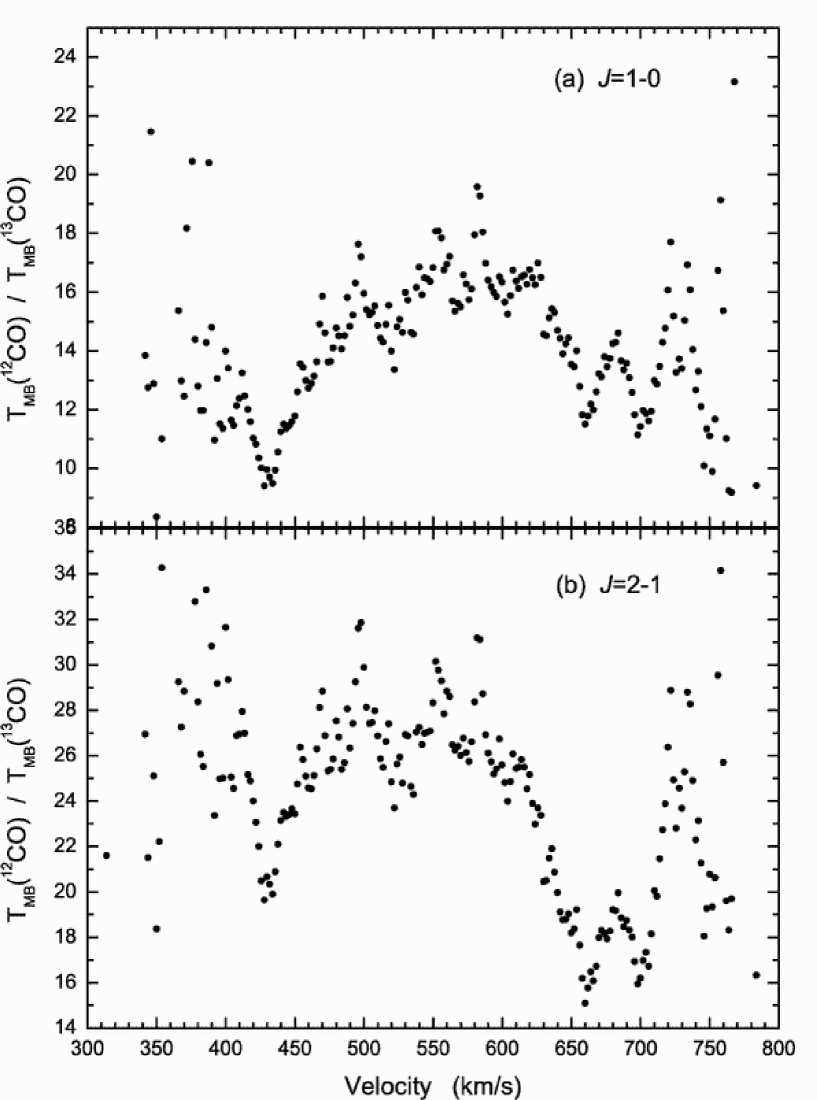
Among the 10 detected lines of carbon monoxide (CO; Fig. 1, first three panels), the C17O =1–0 and the two =3–2 profiles are the most uncertain. The signal-to-noise ratio of the C17O =1–0 line is small, but the line intensity is similar to that of the higher signal-to-noise detection reported by C01. Our C17O =2–1 profile is of better quality. With respect to the CO and 13CO =3–2 profiles, that were not measured simultaneously, we note that the lineshape is narrow, mainly confined to the lower radial velocity range of the CO 1–0 and 2–1 profiles. Since we know from Mauersberger et al. (1996a) that CO =3–2 lines have no peculiar shape, the effect must be due to small pointing errors. These can substantially affect our submillimeter data that were obtained with a relatively small beam. The CO and 13CO =3–2 profiles, while not showing emission over the entire velocity range, likely indicate the correct peak line temperatures, since the =1–0 and 2–1 line peaks are broad ( 100 km s-1) and since the peak temperatures are not lower than those reported by Mauersberger et al. (1996a) and C01. This is the major motivation to use peak and not integrated line intensities for the model calculations.
Applying an LVG code to the CO data (see Mao et al. 2000) and reproducing C17O and C18O =1–0 and 2–1 lines, we obtain an excitation parameter of 2107 K cm-9/2, i.e. a kinetic temperature of 100 K yields a density of 3.5103 cm-3, in good agreement with C01 (their Table 5). Also the resulting column densities
(: column density in cm-2; : LVG density parameter of the specifically studied molecule in cm-3; : velocity gradient in km s-1 pc-1; : linewidth in km s-1, the adopted value is 300 km s-1), show with 3.71015 cm-2 and 2.41016 cm-2 for C17O and C18O, respectively, good agreement. If we consider errors in individual line temperatures by 10%, we obtain (C18O)/(C17O)=6.40.3.
Fits to the 13CO and CO peak line intensities, involving three transitions in each case, are more difficult to interpret. Using the temperature and density deduced above implies 2–1/1–0 and 2–1/3–2 line intensity ratios that are larger than those observed. A 13CO column density of 9.21016 cm-2, that approximately reproduces observed line intensities, leads to 2–1/1–0 and 2–1/3–2 line intensity ratios of 1.8 and 1.6, respectively, that have to be compared with observed values of 1.3 and 0.9. Assuming that the 2–1 line, that has the highest optical depth, arises from a particularly large volume, makes the discrepancy even more pronounced (note that this is independent of the overall extent of the emission that is given in Table 4 of C01; it refers instead to the source filling or clumping factor within that volume). The same holds for CO, where a model fit with (CO) = 1.81018 cm-2 yields 2–1/1–0 and 2–1/3–2 ratios of 1.6 and 1.3, respectively, instead of the observed ratios of 1.2 and 1.0. Furthermore, an abundance ratio of 20 between CO and 13CO may be too small in view of a 12C/13C ratio of 50, that was suggested as a likely value by H94 and C01.
What can resolve the obtained discrepancies? As already mentioned, =3–2 peak line temperatures may be particularly uncertain. Here calibration errors can be more significant than for the other lines. Our CO =3–2 peak intensity is larger by 30% than that reported by C01. Taking their spectrum would lead to a reasonable model fit. The shape of our 13CO =3–2 spectrum (Fig. 1) is unusual. It remains open whether the narrow feature at 430 km s-1 ( 0.4 K) or the wider component at higher velocities ( 0.25 K) represents the proper peak intensity value. A good match with the model would imply 0.12 K. Thus there could be a serious discrepancy between the model and the observational data that has to be addressed by future studies.
Measured 2–1/1–0 line intensity ratios are more accurate. The CO =2–1 line of C01 is weaker than the corresponding line measured by us and would enhance the conflict between the model and observations. Having observed the line on many occasions, however, we believe that our calibration (and that of H94) is more appropriate. Otherwise, differences with previously reported =1–0 and 2–1 intensities are negligible.
One way to reconcile observed line intensities with those of the model is to assume clumping. As long as all line emission is optically thin, intensities will be proportional to , i.e. to the product of the clumping factor (the line emitting area the cloud size given in Sect. 4) and optical depth. For a given line intensity a decrease in the clumping factor would then imply a corresponding increase in optical depth. If approaches unity, however, does not determine line intensities any longer and each of the factors has to be analyzed separately. The C17O, C18O, 13CO and CO column densities were derived assuming =1, reducing all optical depths to their possible minimum. For CO, however, this approach is too simple. If is identical for all CO isotopomers and , optical depths and column densities will be larger than the so far calculated values ignoring clumping within the CO emission region. Higher opacities imply more photon trapping and thermalization, thus reducing differences between =1–0, 2–1 and 3–2 line intensities and leading to a better agreement with observed line temperature ratios. As already mentioned, homogeneous cloud coverage yields (CO) cm-2 (Fig. 7a,b), (CO)/(13CO) 20, and 2–1/1–0 and 2–1/3–2 line intensity ratios of 1.6 and 1.3. A cloud averaged column density of (CO) 61018 cm-2 implies (CO)/(13CO) 50 (; see Fig. 7c) and line intensity ratios of 1.4 and 1.2, that agree better with the observed ratios of 1.2 and 1.0, respectively.
While moderate (0.21) clumping is thus likely, the procedure is not accurate enough to provide reliable values for , (CO) and (CO)/(13CO). In the following subsections, we will therefore try to constrain the 12C/13C isotope ratio in other ways. Assuming a constant carbon isotope ratio throughout the nuclear region, this will yield the proper (CO)/(13CO) abundance and 12C/13C isotope ratios. A comparison with the beam averaged CO column density will then also determine the clumping factor.

4.2 CS
Unlike CO with its high column density, optical depth and small critical density (where rates of collisional and radiative deexcitation become similar), carbon monosulfide (CS) is characterized by smaller column densities and larger critical densities. While CO may arise predominantly from warm layers at the surface of clouds that are irradiated by a strong UV radiation field (e.g. Mao et al. 2000), CS emission likely originates from denser clumps of gas deeper inside the clouds where kinetic temperatures might be lower. While the study of C01 was confined to the CS =2–1 and 3–2 lines, our LVG model fit (see Mauersberger & Henkel 1989) also includes the =5–4 line that is crucial for an excitation analysis as well as the =3–2 lines of two rare isotopomers, those of C34S and 13CS.
At a kinetic temperature of 100 K, the =2–1, 3–2, and 5–4 line temperatures lead to (CS) 41014 cm-2 and 5104 cm-3 (see Fig. 8). The CS column density is smaller, the H2 density is larger than reported by C01, by factors of five. Assuming a lower kinetic temperature does not significantly alter (CS), but increases the density further. At =25 K, would be in excess of 105 cm-3. The reason for the discrepancy between C01 and our data lies in the fits to the =2–1 and =5–4 lines. With the parameters suggested by C01, the =2–1 line would be stronger and the =5–4 line would be weaker than observed.
The model calculations of C01 and our results both indicate that CS lines, if arising from a homogeneous 20′′ sized region, are optically thin ( (CS 3–2) 0.086). Our C34S and 13CS spectra thus imply (CS)/(C34S) 12 and (CS)/(13CS) 50. If, however, clumping within the assumed 20′′ sized emission region is substantial and source filling factors become 0.1, CS line saturation may play a role, leading to higher (CS)/(C34S) and (CS)/(13CS) ratios. The latter also holds if our tentative 13CS profile is an artefact.

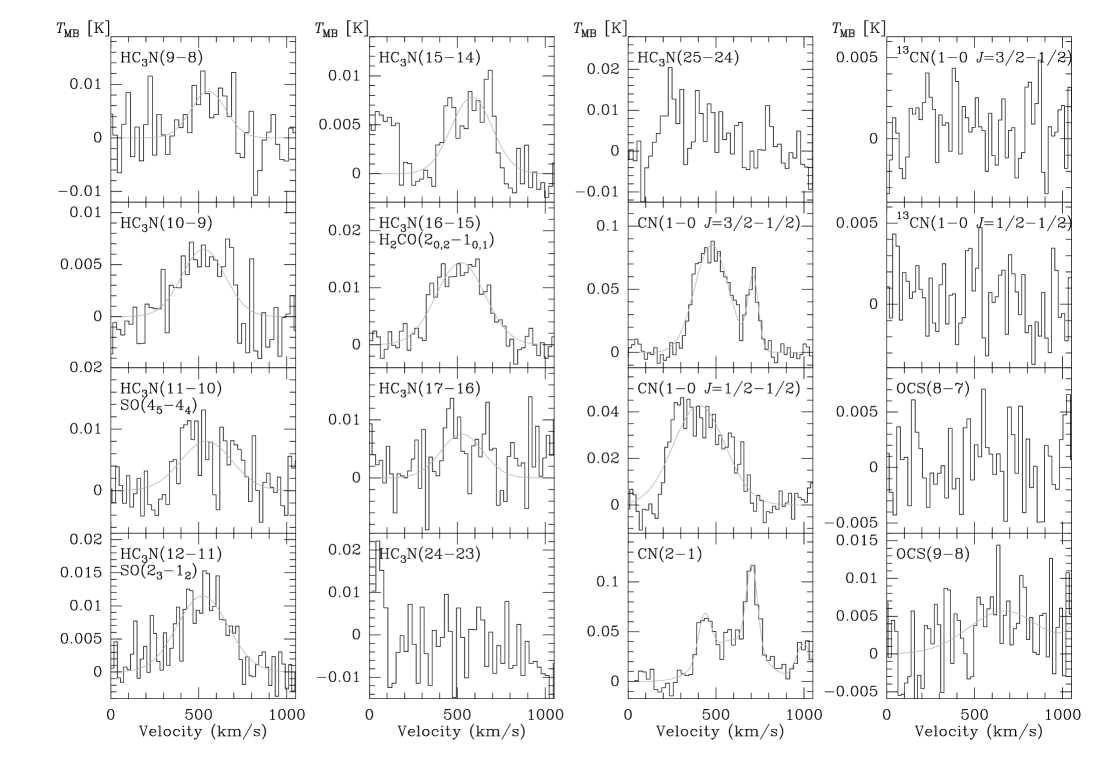
4.3 HC3N
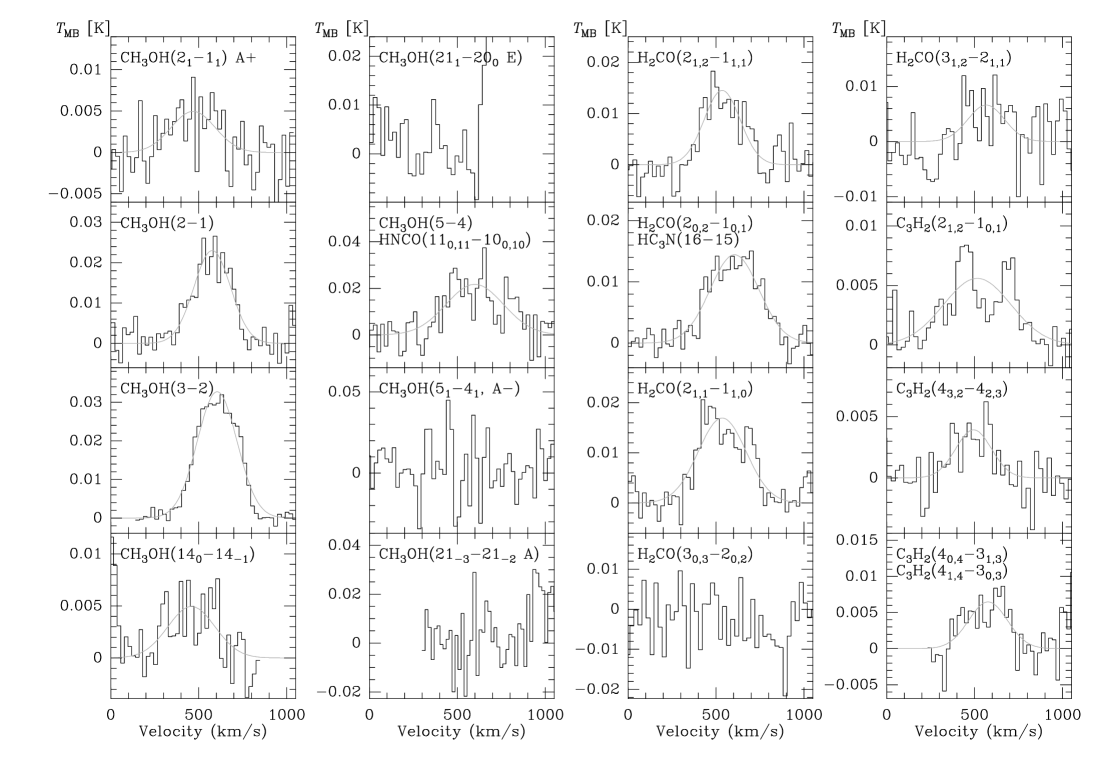
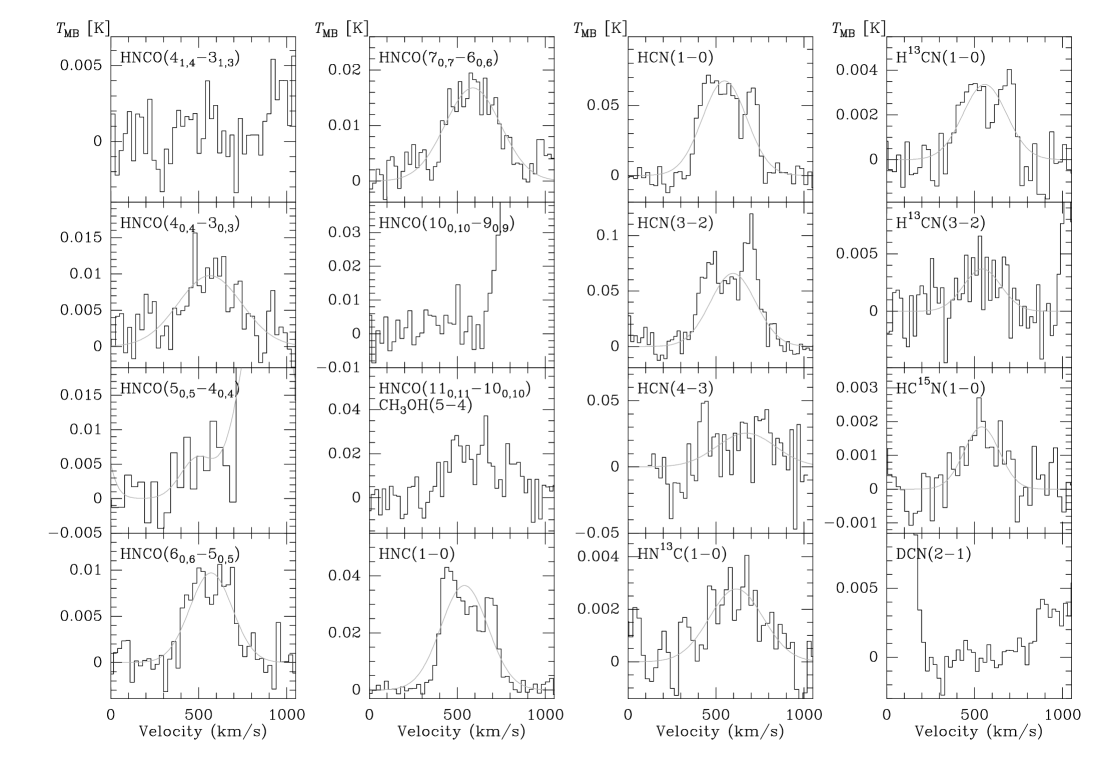
Cyanoacetylene (HC3N) is another probe of the higher density gas, providing a particularly large number of transitions that are, unlike those of CO and possibly CS, almost certainly all optically thin. We observed 9 rotational HC3N lines, 6 or 7 of which were detected (first two panels and the first spectrum of the third panel of Fig. 4). Including a total of 22 lines and assuming that the =17–16 line was detected, the LVG fit (see Mauersberger et al. 1990) gives for =100 K (HC3N) 71013 cm-2 and 105 cm-3 (Fig. 9), the latter in good agreement with the results from CS. For smaller kinetic temperatures, H2 densities would be even larger. The maximum optical depth is (HC3N 12-11) 0.0024 (100K), or (HC3N 10-9) 0.0030 (50K). The clumping factor would therefore have to be small, of order 0.005 or less, to induce line saturation. According to the model, the =21–20 line is an order of magnitude weaker than the tentatively detected =17–16 feature. Therefore it is not surprising that the =24–23 and 25–24 transitions remain undetected. If the tentative =17–16 line profile is not an artefact, the 145.6 GHz feature is the superpostion of two lines with approximately equal intensities, the =16–15 line of HC3N and the 202–101 line of ortho-H2CO (Fig. 4). Otherwise, H2CO is dominating the line profile.

4.4 SO
Seven lines of sulfur monoxide (SO) were observed, two of which were detected (first two panels of Fig. 5). As a comparison with the HC3N =10–9 and 12–11 line intensities shows (Fig. 4), the 100.1 GHz profile is dominated by HC3N 11–10, not by SO 4 emission. An LVG fit to the SO 32–21 and 43–32 lines (Fig. 10; for molecular constants and collision rates, see Tiemann 1974; Green 1994) gives for =100 K, (SO) 11014 cm-2 and 105 cm-3. For =50 K, is about 50% larger while (SO) is not significantly changed. For the two detected lines source averaged optical depths are of order 0.005. Densities are high enough to yield excitation temperatures that are approaching . The computed brightness temperature of the ground state 10–01 transition ( 30 GHz) is 35% of the lines detected by us.

4.5 HCN
H94 presented an HCN =1–0 map that showed that the emission is not spatially resolved by the 50′′ beam of the SEST. C01 detected the HCN =1–0 and 3–2 transitions, while Chin et al. (1999) reported the detection of the =1–0 lines of HCN, H13CN, and HC15N, indicating a surprisingly small 14N/15N isotope ratio. Here we combine the three =1–0 transitions with detections of the HCN and H13CN =3–2 lines and a highly tentative detection of the HCN =4–3 transition (Fig. 3). The undetected DCN =2–1 line is bracketed by two comparatively strong lines, those of CH3OH (3–2) and C34S (3–2), so that even the baseline remains undetermined (see Fig. 3).
LVG fits with collision rates from Green & Thaddeus (1974) are shown in Fig. 11. In M 82, the bulk of the HCN emission arises from gas that is not only denser but also cooler than the CO emitting gas (e.g. Mao et al. 2000). We therefore present data with =50 and 100 K to study differences in the model parameters. For =100 K and assuming optically thin emission we obtain a density of 1.5105 cm-3 and column densities of (HCN) 2.61014 cm-2, (H13CN) 1.71013 cm-2 and (HC15N) 9.31012 cm-2. For =50 K we find instead 3105 cm-3. Excitation temperatures in the low- lines are 8 and 6 K for =100 and 50 K, respectively. The lines are subthermally excited. Therefore the HCN =4–3 line should be 3–4 times weaker than the =3–2 line, which is consistent with the observations. Optical depths are of order 0.05–0.1 for the main species. This implies that line saturation likely affects the HCN =1–0 line and possibly also the =3–2 transition. Assuming Local Thermodynamic Equilibrium (LTE) and taking excitation temperatures from the LVG simulations, (H13CN)2.6cm-2 from the intensity of the =1–0 line. With 12C/13C50 (Sect. 6.1), (HCN)1.3cm-2.
Apparently, the gas emitting at 710 km s-1 is more highly excited than that observed at lower velocities. In the =3–2 line the HCN peak is observed at 710 km s-1, while the feature is less dominant in the =1–0 transition (see also Sects. 5.1.3 and 5.3).
The HCN/H13CN =1–0 line intensity ratio of 20–25, reflecting an abundance ratio of 15 in the optically thin limit, is similar to that found for the corresponding CO/13CO line intensity ratios. This indicates similar optical depths in the CO and HCN main isotopomers, while the line emitting volume may be larger in the case of CO. The line intensity ratios between the main and the 13C bearing species can be taken as lower limits to the 12C/13C isotope ratio.

4.6 H2CO
Formaldehyde (H2CO) line profiles are displayed in the last two panels of Fig. 2. Fig. 12 shows results from our LVG calculations, including the observed =1 transitions of ortho-H2CO, i.e. the 21,2–11,1, 21,1–11,0 and 31,2–21,1 lines (for details of the code, see Henkel et al. 1980), for =100 and 50 K. For =100 K we obtain (ortho-H2CO) 1014 cm-2 and 4105 cm-3. Optical depths are highest in the =2–1 lines but do not exceed 0.013. Excitation temperatures are below 40 K.

4.7 OCS
For carbonyl sulfide (OCS) we have a tentative detection of the =9–8 line (Fig. 4). If the detection is real, we obtain with the LVG code already used by Mauersberger et al. (1995) and assuming =100 K (OCS) 51014 cm-2 (Fig. 13). As can be seen in Fig. 13, the column density is not significantly changed for =50 and 25 K, while the H2 density is poorly constrained.

4.8 CH3OH
Eight methanol (CH3OH) features were searched for, three of which were detected (first two panels of Fig. 2). The =2–1 profile at 96 GHz is composed of 4 transitions, and the =3–2 feature at 145 GHz is composed of 8 lines. An LVG source code for methanol (CH3OH) was kindly provided by S. Leurini. Einstein coefficients were taken from Cragg et al. (1993), energy levels were adopted from Xu & Lovas (1997), and collision rates are from Pottage et al. (2001, 2002) for 20K and from D. Flower (priv. comm.) for higher . Because of the large linewidths observed towards NGC 4945, CH3OH lines are often blended and cannot be observed individually. In our calculations we therefore added the line intensities of the four =2–1 transitions near 96 GHz, of the eight =3–2 transitions near 145 GHz and of the sixteen =5–4 transitions near 241 GHz, respectively. The =2–1 and 3–2 lines are found within a velocity interval of 80 km s-1 (25 and 40 MHz, respectively) that is small with respect to the linewidth of the source. The observed =5–4 feature is only slightly wider than 300 km s-1 (Table 2). Thus only few of the 16 lines can contribute significantly to the total intensity. According to the model, the 5-1–4-1 E transition should dominate. In view of the weak HNCO 100,10–90,9 line (Fig. 3) we assume that the contribution from the HNCO 110,11–100,10 line is negligible and that the observed profile is entirely due to CH3OH =5–4 emission. The results (Fig. 14) show that for =100 K, (CH3OH) 5.51014 cm-2 and 1104 cm-3. For =25 K, the column density is similar, but the density becomes a few times 104 cm-3. Optical depths are less than 0.03 for a source size of 20′′.

4.9 HNCO
Isocyanic acid (HNCO), observed in six rotational transitions (see Fig. 3), is a particularly interesting molecule because it can probe the far-infrared radiation field ( 330m) with its =1 ladder (see Churchwell et al. 1986). As a consequence, the rotational population distribution of HNCO can be dominated by far-infrared radiation.
For the radiative transfer calculations of HNCO (see Lapinov et al. 2001) collision rates were taken from S. Green (http://www.giss.nasa.gov/data/mcrates/#hnco). Taking a background temperature of 2.73 K and ignoring the 11 line that is blended by a CH3OH feature (see Sect. 4.8), we obtain for =100 K (HNCO) 2.31014 cm-2 and 1.6104 cm-3. Optical depths are less than 0.02.
Fig. 3 shows the 40,4–30,3 (or 40–30) and 41,4–31,3 (or 4-1–3-1) line profiles. While the former =0 transition is clearly detected, the latter =1 line may be an artefact. The line temperature ratio is therefore 5:1. Reproducing a line intensity ratio of 5:1 with the model, we find a background temperature of 30 K (see the lower panel of Fig. 15), that can be taken as an upper limit to the actual background temperature in the inner 20′′ of NGC 4945. Consistent with Churchwell et al. (1986), our excitation temperatures then reach an equilibrium with the radiation field so that observed line intensity ratios fail to constrain H2 densities. The solution with =30 K cannot provide more than a crude approximation. In contrast to our solution with =2.73 K (Fig. 15a), lines with measured intensities do not intersect in Fig. 15b and are thus not properly reproducing our measurements. A realistic approach, however, also requires the introduction of a ‘dilution factor’ that remains observationally unconstrained.

| Transition | a) | |
| (K) | ||
| CO 1–0 | 6.143 | 0.293 |
| CO 2–1 | 7.080 | 0.452 |
| CO 3–2 | 7.000 | 0.500 |
| 13CO 1–0 | 0.410 | 0.293 |
| 13CO 2–1 | 0.531 | 0.452 |
| 13CO 3–2 | 0.600 | 0.500 |
| C18O 1–0 | 0.102 | 0.293 |
| C18O 2–1 | 0.155 | 0.452 |
| C17O 1–0 | 0.014 | 0.293 |
| C17O 2–1 | 0.027 | 0.452 |
| CS 2–1 | 0.320 | 0.125 |
| CS 3–2 | 0.156 | 0.243 |
| CS 5–4 | 0.042 | 0.471 |
| C34S 3–2 | 0.013 | 0.237 |
| 13CS 3–2 | 0.004 | 0.222 |
| CH3OH 2–1 | 0.180 | 0.122 |
| CH3OH 3–2 | 0.126 | 0.238 |
| CH3OH 5–4 | 0.054 | 0.465 |
| H2CO 21,2–11,1 | 0.066 | 0.228 |
| H2CO 21,1–11,0 | 0.063 | 0.252 |
| H2CO 31,2–21,1 | 0.014 | 0.431 |
| HNCO 40,4–30,3 | 0.097 | 0.103 |
| HNCO 50,5–40,4 | 0.046 | 0.152 |
| HNCO 60,6–50,5 | 0.049 | 0.205 |
| HNCO 70,7–60,6 | 0.069 | 0.260 |
| HNCO 100,10–90,9 | 0.014 | 0.418 |
| HNCO 110,11–100,10 | 0.054 | 0.465 |
| HCN 1–0 | 0.622 | 0.105 |
| HCN 3–2 | 0.176 | 0.512 |
| HCN 4–3 | 0.038 | 0.651 |
| H13CN 1–0 | 0.035 | 0.100 |
| H13CN 3–2 | 0.007 | 0.499 |
| HC15N 1–0 | 0.020 | 0.099 |
| HC3N 9–8 | 0.088 | 0.091 |
| HC3N 10–9 | 0.055 | 0.110 |
| HC3N 11–10 | 0.062 | 0.130 |
| HC3N 12–11 | 0.080 | 0.151 |
| HC3N 15–14 | 0.037 | 0.217 |
| HC3N 16–15 | 0.058 | 0.240 |
| HC3N 17–16 | 0.030 | 0.262 |
| SO 32–21 | 0.035 | 0.128 |
| SO 43–32 | 0.032 | 0.221 |
| OCS 9–8 | 0.033 | 0.151 |
| CN 1-0 =3/2–1/2 | 0.436 | 0.161 |
| CN 1-0 =1/2–1/2 | 0.263 | 0.160 |
| CN 2-1 =5/2–3/2 | 0.162 | 0.433 |
| HNC 1–0 | 0.413 | 0.109 |
| HN13C 1–0 | 0.028 | 0.101 |
| HCO+ 1–0 | 0.797 | 0.106 |
| HCO+ 3–2 | 0.115 | 0.520 |
-
a)
for the definition of , see Sect. 4
5 Other molecular species
In Sect. 4 a variety of molecular species were analyzed with an LVG code. Other molecules, mostly with a smaller number of detected transitions, were analyzed with an LTE approach. In the following some of these molecules are introduced, among them CN with the =1–0 and 2–1 lines being observed.
5.1 CN
5.1.1 The [CN]/[13CN] abundance ratio
For the CN =1–0 transition we find a group of =1/2–1/2 lines ( 113.17 GHz) and a group of =3/2–1/2 lines ( 113.5 GHz) that were detected with high signal-to-noise ratios (Fig. 4). According to Henkel et al. (1998), CN provides the most stringent limits on 12C/13C isotope ratios in extragalactic molecular clouds. Because the =1–0 transition is split into several lines (spin-rotation and nuclear magnetic and electric quadrupole interactions), optical depths are not large and can be determined by an analysis of line intensity ratios. Deviations from LTE (Local Thermodynamic Equilibrium) intensities appear not to be large.
In order to determine the optical depth of the CN =1–0 lines, we denote the =3/2–1/2 lines with the index 1 and the =1/2–1/2 lines with the index 2. With an observed line intensity ratio of 1.580.06 (Table 2) and =2 (see Skatrud et al. 1983 for relative LTE intensities under optically thin conditions) we then find
For we obtain =1.090.21
The =3/2–1/2 and 1/2–1/2 lines are part of the same spectrum so that their line intensity ratio is not affected by calibration errors. With and known and
and
where and are 0.667 and 0.333, respectively (Skatrud et al. 1983), we then obtain for the ‘optical depth corrected’ total CN =1–0 line intensities ==60.45.4 K km s-1.
For 13CN (spectra are shown in Fig. 4) we took the frequencies and relative line intensities (LTE, 1) from Bogey et al. (1984) and Gerin et al. (1984). With a 3 noise level of 5.7 mK in an 18.82 km s-1 wide channel (see Table 2 and Fig. 4) we obtain for a 300 km s-1 wide line an upper limit to the integrated intensity of
The resulting 3 upper limit is 0.43 K km s-1.
As in the case of CN we have to correct for the fact that the 13CN =1–0 lines are distributed over a frequency range (108.4–108.8 GHz). In contrast to CN, 13CN does not require any corrections related to line saturation. The most prominent group of 13CN lines, located between 108.7802 and 108.7964 GHz (the difference corresponds to 45 km s-1 that is small with respect to a total linewidth of 300 km s-1) comprises 42.7% of the total LTE intensity. As a consequence we find
Henkel et al. (H94) reported a 3 lower limit to the HCN/H13CN line intensity ratio of 31, while the actual ratio is 23.41.9 (Table 2). In view of this discrepancy we conservatively estimate that the [12CN]/[13CN] abundance ratio should be 45 or larger.
5.1.2 CN line intensity anomalies
The =1–0 transition:
As already mentioned, the CN transitions represent the superposition of a number of hyperfine (HF) components that are displayed in Fig. 16. While the =1–0 =3/2–1/2 profile (‘HF1’ in Fig. 16a) consists of a broad blue- and a narrow redshifted line, the =1/2–1/2 profile (‘HF2’ in Fig. 16a) is wider and shows a single broad feature (see also the observed spectra in Fig. 4). Is this difference caused by a different intrinsic lineshape? A fit with two velocity components, characterized by =450 km s-1, =300 km s-1 and =710 km s-1, =50 km s-1 reproduces the observed =3/2–1/2 and 1/2–1/2 profiles in a satisfactory way (the linewidths refer to full width to half power Gaussians in optical depth). The lack of a prominent redshifted spike in the =1/2–1/2 lines is not caused by a different intrinsic lineshape but is a consequence of the different frequencies and strengths of the individual HF components (see Fig. 16).
For the fit to the line profile we assumed optical depth ratios between individual HF components
that are consistent with the relative intensities given by Skatrud et al. (1983). To scale
optical depths, we took =1.09 for the =3/2–1/2 and =0.545
(=2, see Sect. 5.1.1) for the =1/2–1/2 HF components, the index denoting
individual HF features. It is remarkable that the sum of these optical depths is, within the
limits of noise, the same for the blue- (450 km s-1) and redshifted
(710 km s-1) velocity components.
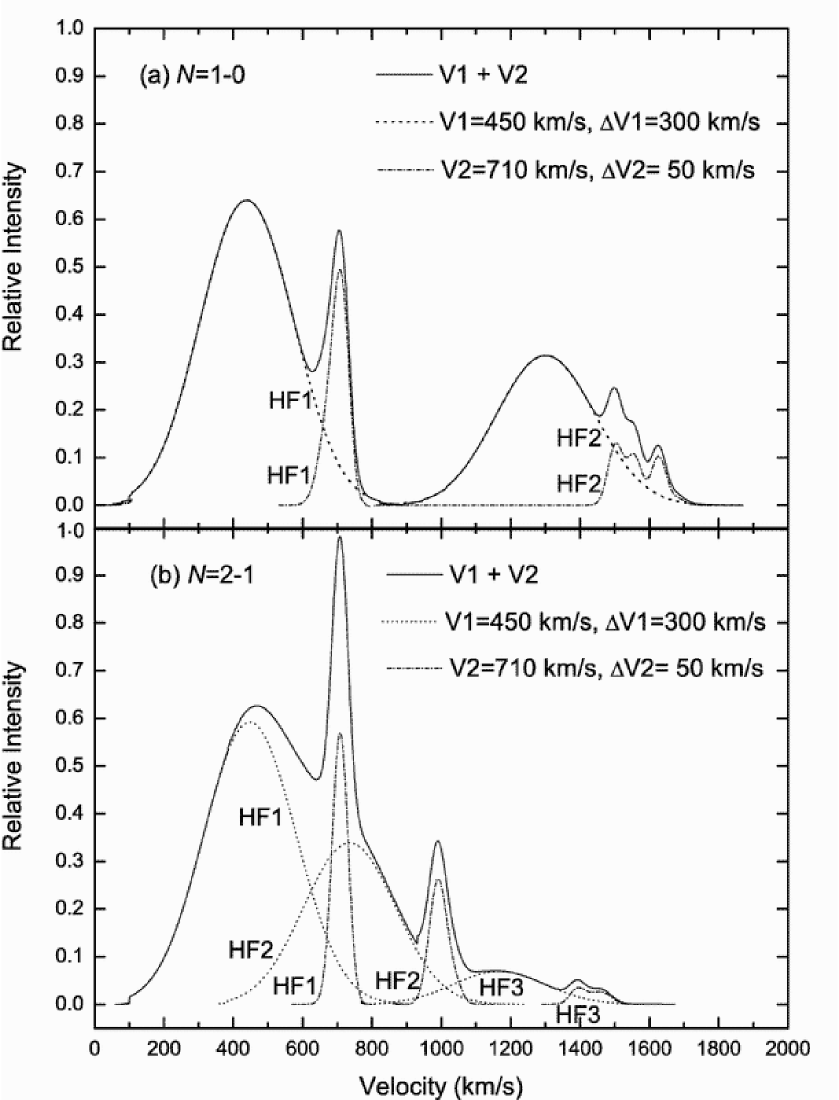
The =2–1 transition:
A comparison of the =1–0 =3/2–1/2 and =2–1 CN profiles was given by H94, who suggested that the relative strength of the =2–1 710 km s-1 feature (see Fig. 4) is higher than that implied by the =1–0 =3/2–1/2 lineshape. Such an excess in the =2–1 710 km s-1 feature is also indicated by our new data, making use of the V1 and V2 components defined by the =1–0 line and subdividing the HF components into three groups, HF1, HF2, and HF3 (see Fig.16b). The excess becomes apparent when comparing the observed line intensity ratio between the 710 and 450 km s-1 components, 1.9 (Fig. 4), with that of our computation, 1.5 (Fig. 16).
Concluding that the strongest CN =2–1 component, the 710 km s-1 feature, is enhanced, we find that line saturation cannot play a significant role in this transition. Otherwise, the feature would be weaker, not stronger than expected in our analysis assuming optically thin emission.
5.1.3 CN column density
A comparison of total line intensities gives 40 K km s-1 for the CN =1–0 and 30 K km s-1 for the =2–1 line (see Table 2). Accounting for the optical depth in the =1–0 transition, the integral would be 60 K km s-1 if we correct for saturation effects (Sect. 5.1.1), while line saturation may not be relevant for the =2–1 line (Sect. 5.1.2). Correcting these integrated line intensities for beam size effects, i.e., dividing the integrated line intensities by (see Sect. 4 and Table 4), we obtain 375 K km s-1 for the =1–0 line accounting for line saturation and 70 K km s-1 for the =2–1 line. The line temperature ratio is 2–1/1–0 0.185. With
=h/, =113.386 GHz and =h/2.73=1.99 we then obtain for the excitation temperature 3.1 K and for the column density, assuming LTE, (CN)2.5cm-2. We note that the excitation temperature is very small, indicating densities well below 105 cm-3 (see e.g. Fuente et al. 1995). Most of the =1–0 710 km s-1 feature is originating from the HF1 group of HF components (see Fig. 2 and Sect. 5.1.2), i.e. from gas that is characterized by a recessional velocity of 710 km s-1. If this component has an =2–1/1–0 ratio that is twice the average value (see H94), this implies 4.1 K (see also Sects. 4.5 and 5.3).
5.2 HNC
The =1–0 HNC and HN13C lines (Fig. 3) were detected with an intensity ratio of 11.41.4, i.e. well below the 12C/13C lower limit derived by CN (Sect. 5.1.1). This implies that the HNC =1–0 line must be optically thick. With a smaller 12C/13C line intensity ratio than measured for HCN (Sect. 4.5) and with only half the integrated intensity, HNC is likely arising from a more compact region than HCN and HCO+. Assuming LTE and an excitation temperature of 8 K that was derived for HCN, a molecule with similar dipole moment and rotational constant, we obtain (HN13C)3.5cm-2. With 12C/13C50 (Sect. 6.1), (HNC)1.8cm-2.
5.3 HCO+, HCO and thermal SiO
While the =1–0 profile of HCO+ shows, as other lines, a dominant component at 450 km s-1 and a satellite component at 710 km s-1, the relative strength of the features is inverted in the =3–2 spectrum (see Fig. 5). Apparently, the gas seen at 710 km s-1 is higher excited (see also Sects. 4.5 and 5.1.3).
H13CO+ is blended with the HCO 1 and SiO =2–1 =0 transitions (see García-Burillo et al. 2002). In order to provide meaningful constraints on line intensity ratios, the three profiles shown in Fig. 5 (lower right corner) were simulated. Assuming that the 450 and 710 km s-1 components of a given molecular transition have equal intensities, and linewidths of 200 and 150 km s-1, respectively, we find that SiO might be strongest while HCO might be weakest. With / 0.3, for the HCO 1 =3/2–1/2 lines we find qualitatively / 2.0 and / 2.5.
The resulting HCO+/H13CO+ line intensity ratio is 41 and excitation temperatures become 4.7 K (450 km s-1) and 5.4 K (710 km s-1 component) in the case of optically thin emission. We note that the decomposition of SiO, HCO and H13CO+ is too tentative to provide meaningful error estimates. A search for SiO =3–2 =0 emission that is less contaminated by other spectral features would be worthwhile. The HCO+/H13CO+ line intensity ratio, being much more uncertain than other such ratios, is not included in Table 5.
5.4 C3H2
Profiles of cyclopropenylidene (C3H2) are shown in the right panel of Fig. 2. The 85 GHz 2 line (Fig. 2) shows the double peak structure with one main component at 450 and the other at 710 km s-1 that also characterizes a few other species, most notably CN (see Fig. 4 and Sect. 5.1). Higher excited C3H2 transitions (Fig. 2), the 86 GHz 4 line and the superposition of the 150 GHz 4 and 4 lines (separation:60 km s-1) show, however, an approximately Gaussian lineshape. With the partition function (e.g. http://spec.jpl.nasa.gov), the electric dipole moment, asymmetric rotor line strengths and excitation above the ground state (e.g. Thaddeus et al. 1985; Vrtilek et al. 1987; Lovas & Suenram 1989) known, a column density assuming LTE and optically thin emission can be derived.
Using the 2 and 4 lines that both belong to the ortho-C3H2 species and that were observed with similar beam sizes, an excitation temperature of 235 K is obtained. The total column density for a source size of 20′′ and an ortho-para ratio of 3:1 is estimated to be 3.3 cm-2.
5.5 C2H
While Table 2 and Fig. 5 show the parameters of a one component Gaussian fit to the 87 GHz =1–0 transition of C2H, the line is actually split into two components with an intensity ratio of 3:1. This is caused by hyperfine splitting (e.g. Tucker et al. 1974; Ziurys et al. 1982). Two groups of HF components are present, a redshifted one at 87.32 GHz and a blueshifted one at 87.41 GHz. Their LTE intensity ratio in the optically thin limit is 2:1. Our observed ratio is higher, likely not because of maser amplification of the stronger feature, but because some part of the weaker blueshifted HF component, that near 710 km s-1, is superposed onto the dominant more redshifted HF component observed. A simulation of the entire profile as for CN (see Sect. 5.1.2) or for the blend of HCO+, HCO and SiO features (Sect. 5.3), assuming an intensity ratio of 2:1 for the group of HF components (Tucker et al. 1974; Ziurys et al. 1982), an intensity ratio of 1:1 between the 450 and 710 km s-1 features and linewidths of 200 and 150 km s-1, respectively, provides a good fit. Our assumption that the emission is optically thin then yields, with =20 K, cm-2.
5.6 CH3CCH and CH3CN
Extragalactic CH3CCH and CH3CN was first reported by Mauersberger et al. (1991). While CH3CCH was detected in NGC 253 and M 82, CH3CN was only seen in NGC 253.
In the case of NGC 4945 we also obtain a clear detection of CH3CCH, while CH3CN is not detected convincingly (Fig. 5). This may only be due to blending by the CS =3–2 line, i.e. a search for the =5–4, 6–5 or 7–6 transitions of CH3CN would be meaningful. Applying (CH3CCH) cm-2(K km s-1) (Mauersberger et al. 1991), we obtain a column density of 2.4 cm-2.
6 Isotope ratios
6.1 12C/13C and 16O/18O ratios
For a complete evaluation of the column densities discussed in Sects. 4 and 5, a knowledge of isotope ratios in the nuclear region of NGC 4945 is indispensable. Line intensity ratios of 12C and 13C bearing isotopomers provide direct information on line saturation in the more abundant species if the 12C/13C ratio is known. Table 5 summarizes the observed 12C/13C, 14N/15N, 16O/18O, 16O/17O and 32S/34S values based on integrated intensities. To interpret the ratios we assume in the following that they reflect the isotopic ratios in the case that the lines are optically thin or that they provide lower limits to the isotope ratios, if the line of the more abundant species is optically thick. Fractionation and isotope selective photodissociation may not be important in the nuclear region of NGC 4945 (H94) and are thus ignored. The data do not yet permit a separate analysis of the 450 and 710 km s-1 velocity components and are therefore based on peak temperatures and integrated intensities of the entire individual spectra.
There is a total of 8 measures of the 12C/13C ratio (Table 5). Four of them yield small values (10–15), two intermediate values (15–30) and two high values (45). The comparison of line intensity ratios suggests that CO and HNC rotational lines have highest optical depths, followed by those of HCN. While it may appear strange, at first sight, that (CO =2–1)(HNC =1–0), HNC is presumably arising from a smaller area, where average H2 column densities are larger than those in the region being responsible for the bulk of the CO emission. Note that CO/13CO line intensity ratios decrease with increasing rotational quantum number . This is expected in a warm molecular medium where CO column densities in individual states rise almost proportional to their statistical weights (21).
With ratios or lower limits of 40–50, the 12C/13C values derived from CN and CS are closer to the actual 12C/13C isotope ratio. While CN did allow us to estimate optical depths, CS may show a direct albeit low signal-to-noise detection of its 13C bearing species.
| Molecules | Transition | Ratio1a) | Ratio2b) | ||
|---|---|---|---|---|---|
| CO/13CO | 1–0 | 15.2 | 0.5 | 15.0 | 2.1 |
| 2–1 | 11.3 | 0.1 | 13.3 | 1.9 | |
| 3–2 | 9.9 | 1.1 | 11.7 | 1.6 | |
| CN/13CNd) | 45 | … | |||
| CS/13CSc) | 3–2 | 49.0 | 17.1 | 39.0 | 5.5 |
| HCN/H13CN | 1–0 | 23.4 | 1.9 | 17.8 | 2.5 |
| 3–2 | 30.0 | 5.2 | 25.1 | 3.6 | |
| HNC/HN13C | 1–0 | 11.4 | 1.4 | 14.8 | 2.1 |
| HCN/HC15N | 1–0 | 48.3 | 5.1 | 31.1 | 4.4 |
| CO/C18O | 1–0 | 56.3 | 2.5 | 60.2 | 8.5 |
| 2–1 | 37.5 | 0.8 | 45.7 | 6.5 | |
| CO/C17O | 1–0 | 433.0 | 83.2 | 438.8 | 62.1 |
| 2–1 | 278.3 | 26.5 | 262.2 | 37.1 | |
| 18CO/C17O | 1–0 | 7.7 | 1.5 | 7.3 | 1.0 |
| 2–1 | 7.4 | 0.7 | 5.7 | 0.8 | |
| CS/C34S | 3–2 | 10.4 | 0.8 | 12.0 | 1.7 |
-
a)
Ratios of integrated intensities (see Table 2). Corrections for beam size effects are less than 10%.
-
b)
Ratios of corrected peak intensities divided by (see Sect. 4 and Table 4)
-
c)
If 13CS or H13CO+ is not detected, the ratios are lower limits. For HCO+ only the 710 km s-1 component was taken to derive the ratios.
-
d)
See Sect. 5.1.1
Following H94, we obtain for the CO =1–0 lines
and
where the inequality on the left part of both equations accounts for the fact that CO, the main isotopomer, is optically thick.
For the =2–1 lines we obtain correspondingly
and
If both 13CO and C18O were optically thin, we could then derive, neglecting fractionation effects and isotope selective photoionization (see H94), for the =1–0 lines and for the =2–1 lines. If, however, also 13CO is optically thick, the values would be lower and would be closer to that is found in the nuclear region of the Milky Way.
As already mentioned, low CO column densities almost rise with their statistical weight, 21, in a warm approximately thermalized medium. As a consequence, (13CO =2–1)(13CO =1–0). The fact that the correlation between 12C/13C and 16O/18O ratios is almost independent of the choice of transition (=1–0 or =2–1) does not prove but strongly suggests that the 13CO opacities are small (see also Bergman et al. 1992 and H94). This implies that the ratio between 12C/13C and 16O/18O ratios does indeed drastically differ from that in the central region of the Galaxy. Giving a higher weight to the result from the =1–0 lines because of a lower degree of 13CO line saturation and smaller errors, we then find 12C/13C40 and 16O/18O150.
Inflowing gas through a bar (Ott et al. 2001) might provide fresh material with 12C/13C in excess of 50, if we use the analogy to the Galaxy with a 12C/13C isotope ratio of 70 near the solar circle (e.g. Wilson & Rood 1994). However, in the middle or at the end of a violent starburst (see the conflicting statements of Koornneef 1993 and Ott et al. 2001 on future star formation in NGC 4945), 18O production might be even more effective than 16O production (i.e. 16O/18O ratios may decrease) if metallicities are solar or higher (Henkel & Mauersberger 1993; Henkel et al 1994b; Langer & Henkel 1995). With a 16O/18O ratio of 250 in the central region of the Milky Way we then find 12C/13C40–60 and 16O/18O150–240 for NGC 4945. A detection of 13CN in NGC 4945 could strengthen the case for our upper limits to the 12C/13C and 16O/18O ratios.
6.2 18O/17O, 14N/15N and 32S/34S ratios
An 18O/17O ratio of 6.40.3 was already derived in Sect. 4.1. This is the best known isotope ratio in the nuclear region of NGC 4945. Its value is higher than that measured in the interstellar medium of the Milky Way or in the Sun (18O/17O=3.5 and 5.5, respectively; see Penzias 1981) and can be explained by the peculiar isotopic composition of the ejecta from massive stars that play an important role in a starburst environment.
For the central region of NGC 4945, Chin et al. (1999) determined the 14N/15N isotope ratio on the basis of three HCN =1–0 lines, those of HCN, H13CN and HC15N. Their measured H13CN/HC15N line ratio of 2 combined with a 12C/13C ratio of 50 resulted in 14N/15N100, a value that is much smaller than any value measured in the galactic interstellar medium. As a consequence, massive stars must be a source of 15N. With an H13CN/HC15N line temperature ratio of 2.10.3 (see Table 2) and a 12C/13C ratio of 5010 we obtain 14N/15N=10526, in good agreement with Chin et al. (1999).
For the disk of the Galaxy (galactocentric distances 3 kpc9 kpc) Chin et al. (1996) found 32S/34S ratios of (3.30.5)(/kpc) + 4.13.1. The 32S/34S ratio in NGC 4945 can be directly obtained from the CS/C34S =3–2 line intensity ratio, since CS/13CS may be close to the 12C/13C isotope ratio so that CS line saturation should not be very significant. In the ‘worst’ case, i.e. if the CS/13CS intensity ratio is 40 while 12C/13C60 (Table 5 and Sect. 6.1), the CS/C34S line intensity ratio has to be multiplied by 1.5 to obtain 32S/34S. As a consequence we estimate 32S/34S=13.52.5. This corresponds to the value determined by Chin et al. (1996) in the innermost galactic disk (3 kpc). As a result we may have found not only in the inner galactic disk (Chin et al. 1996) but also in a nuclear starburst environment a 32S/34S ratio that is substantially smaller than that in the solar system. So far this is the only nuclear starburst that was studied in 32S/34S and the upper limit to the 12C/13C ratio is not strongly constrained (Sect. 6.1). Therefore a clear statement on 34S overproduction, compared to 32S, by massive stars cannot yet be given and more observational data are needed to establish a clear picture. A summary of isotope ratios is given in Table 6.
| NGCb) | NGCb) | M82b) | Gal.c) | Solard) | Solar | ||||
|---|---|---|---|---|---|---|---|---|---|
| 4945 | 253 | Center | Circle | Syst. | |||||
| 12C/13C | 50 | 10 | 40 | 10 | 40 | 25 | 77 | 7 | 89 |
| 16O/18O | 195 | 45 | 200 | 50 | 90 | 250 | 560 | 25 | 490 |
| 18O/17O | 6.4 | 0.3 | 6.5 | 1.0 | 8 | 3.5 | 3.6 | 0.2 | 5.5 |
| 14N/15N | 105 | 25 | … | 100 | 600 | 450 | 22 | 270 | |
| 32S/34S | 13.5 | 2.5 | … | … | … | 32 | 7 | 22 | |
-
a)
Data taken from Penzias (1981), Henkel & Mauersberger (1993), Henkel et al. (1993, 1998), Wilson & Rood (1994), Chin et al. (1996), Harrison et al. (1999) and this paper. For the Large Magellanic Cloud (LMC), see Table 1 of Chin (1999).
-
b)
Nuclear starburst environment
-
c)
Isotope ratios in the central kpc of the Galaxy
-
d)
Isotope ratios in the local interstellar medium
| Molecule | ||||
| (cm-2) | (cm-3) | |||
| CO b) | 4.610 | 18 | 4.010 | 3 |
| 13CO | 9.210 | 16 | 4.910 | 3 |
| C18O | 2.410 | 16 | 2.610 | 3 |
| C17O | 3.710 | 15 | 4.010 | 3 |
| CN c) | 2.510 | 14 | 1.010 | 4 |
| CS d) | 3.710 | 14 | 5.010 | 4 |
| C34S | 2.710 | 13 | 5.510 | 4 |
| 13CS | 7.410 | 12 | 5.510 | 4 |
| SO e) | 1.010 | 14 | 1.010 | 5 |
| C2H f) | 6.810 | 15 | … | |
| HCN b) | 1.310 | 15 | 1.510 | 5 |
| H13CN | 2.610 | 13 | 1.510 | 5 |
| HC15N | 9.310 | 12 | 1.510 | 5 |
| HCO+ e,g) | 1.910 | 13 | … | |
| HNC b,h) | 1.810 | 15 | … | |
| HN13C h) | 3.510 | 13 | … | |
| N2H+ e,h) | 4.210 | 12 | … | |
| OCS e) | 5.210 | 14 | … | |
| ortho-H2CO e) | 1.010 | 14 | 4.010 | 5 |
| HNCO e) | 2.310 | 14 | 1.610 | 4 |
| C3H2 e) | 3.310 | 14 | … | |
| HC3N e) | 7.010 | 13 | 1.010 | 5 |
| CH3OH e) | 5.510 | 14 | 1.110 | 4 |
| CH3CCH i) | 2.410 | 14 | … | |
-
a)
For =100 K (see also Sect. 8); for assumed source sizes, see Sect. 4.
-
b)
Assumed: 12C/13C=50 (Sect. 6.1)
-
c)
Line saturation estimated by the relative strength of the fine structure components
-
d)
32S/34S=13.5 (Sect. 6.2)
-
e)
Assumed: Optically thin emission (questionable at least in the case of HCO+); for H2CO, C01 estimated an ortho-para ratio 2.3.
-
f)
Assumed: =20 K
-
g)
Assumed: =5 K (see Sect. 5.3)
-
h)
=8 K, as for HCN
-
i)
See Sect. 5.6
7 Column densities and densities
In Sect. 4 column densities for several molecular species were determined. Making use of the isotope ratios determined in Sect. 6 and adding several molecular species, where measurements did not yet justify an LVG treatment (Sect. 5) provides a total of 24 molecular column densities adopting =100 K and source sizes as outlined in Sect. 4. The column densities do not change significantly for =50 K. Changes in source size would, however, have a major impact with column densities increasing with decreasing extent of the molecular emission. The assumption of similar source sizes for all molecular species, close to those determined for CO and the 1.3 mm continuum (Sect. 2.2), is most reasonable in view of missing interferometric data. A summary of estimated column densities and densities is given in Table 7.
While the column densities of 13CS and OCS are based on tentative detections and are therefore upper limits, the column densities of several species are lower limits in the case that line saturation effects play a role. While this is unlikely in the case of HC3N (Sect. 4.3) and SO (Sect. 4.4), this is less clear for N2H+, HCO+, H2CO, HNCO, CH3OH, C3H2 and CH3CCH. Detections of rare isotopomers would be needed to clarify the situation.
Comparing our column densities with those of C01 we note that some of the values in Table 7 are significantly smaller than those quoted by C01. While in the case of CO and HCO+ differences are almost negligible, for CS, HCN and H13CN the values differ by about one order of magnitude. We do not know the cause of this effect but note that excitation temperatures determined by us for HCN are small and that our CS and HCN data are more complete than those of C01.
H2 densities are higher than expected. While densities of several 103 cm-2 deduced from CO and of 104 cm-3 from CN and CH3OH agree with estimates given by H94 and C01, most molecular species indicate 105 cm-3. Densities for =50 K instead of 100 K would be even larger. We thus conclude that the nuclear region of NGC 4945 contains a prominent high density component that is most convincingly supported by our multiline analysis of HC3N (Sect. 4.3). While the uncertainty in and the choice of spherical or plan-parallel cloud geometry may introduce deviations by factors of up to three from the values given in Table 7, we nevertheless find that most densities are significantly larger than those estimated by C01.
8 Relative abundances
8.1 , M and
Since the column density of CO is relatively well determined for the inner 20′′ of NGC 4945, an H2 density can also be calculated adopting a [CO]/[H2] abundance ratio of (see Bradford et al. 2003). The total column density is then 61022 cm-2
To check the reliability of the H2 column density, we use our measurements of the 1.3 mm continuum. This continuum, described in Sect. 2.2, appears to arise from a similar volume than the molecular gas and is thus interpreted as emission from dust grains associated with molecular clouds in the nuclear environment. For an estimate of (H2) we have to account for the contamination of the measured ‘continuum’ by the CO =2–1 emission line (all other lines contribute much less). With a sensitivity of 25 Jy/K, the 920 K km s-1 correspond to a flux of 17600 Jy MHz. Taking the width of the bolometer filter (30 GHz), the contamination of the measured continuum by CO in the central beam is 0.60 Jy or 43% of the measured flux. This is larger than the 14% determined for the center of M 82 (Thuma et al. 2000). Assuming that a contamination of 43% is representative for the central emission in NGC 4945, the pure continuum flux in the central beam is 1.3 Jy and 1.6 Jy in the mapped region.
Following Mezger (1990), the H2 column density can be obtained from
Here, is the beam size, denotes the flux density integrated over the beam, represents the metallicity, is the dust temperature, and . For the nuclei of external galaxies, =1.9 (this dimensionless parameter allows for changes in the dust absorption cross section in various environments; see e.g. Mezger et al. 1987) may be justified, and should be of order 50 K (IRAS 1989). If we assume that the metallicity is twice the solar value (for galactic disk abundance gradients, see e.g. Hou et al. 2000), our pure continuum flux density in the central beam (1.4 Jy0.570.8 Jy) translates into , in good agreement with the determination from CO. The main uncertainty, which we estimate to be a factor of two in both directions, are the metallicity, the factor , and only to a lesser degree the dust temperature.
If we assume a column density of (H2) 61022 cm-2 (this also compares well with X-ray data suggesting (H) 1023 cm-2 for the nuclear environment, while (H) 41024 cm-2 is found for the direct line-of-sight to the nucleus (Done et al. 2003)), (CO)=(H2)/ (see Table 4) becomes 3.51019 cm-2 [K km-1]-1 (cf. Mauersberger et al. 1996a). This is a factor of 6.5 smaller than the standard galactic (CO) factor of 2.31020 cm-2 [K km-1]-1. Such a low conversion factor is consistent with values found in the central region of other starburst galaxies (e.g. Mauersberger et al. 1996a, b; Solomon et al. 1997; Weiß et al. 2001b).
Table 8 gives fractional abundances of molecular species with respect to studied in the starburst galaxies NGC 4945, NGC 253 and M 82 and toward prototypical galactic molecular clouds, the Orion Hot Core, the Orion Ridge and TMC-1.
8.2 NGC 4945, Orion and TMC-1
Agreement between the fractional abundances derived from the central region of NGC 4945 and the galactic sources is obtained for CS, N2H+, H2CO, HC3N, and CH3CCH. A multilevel HC3N study of the Sgr A molecular clouds near the center of the Milky Way provides, on smaller linear scales than for NGC 4945, similar excitation conditions, i.e. 105 cm-3 for =80 K (Walmsley et al. 1986). For SO and HCN, the abundances agree with those for the Orion Ridge and TMC-1, but are lower than the enhanced abundances of the Orion Plateau and Hot Core, respectively. The C2H abundance seems to be much higher in NGC 4945 than in the galactic sources, but excitation and optical depths are poorly constrained. The HNCO abundance in NGC 4945 is consistent with those of galactic sources containing warm ( 10 K) gas, while the abundance of cyclic C3H2 seems to be similar to that obtained in the TMC-1. The CH3OH abundance is higher than in cold quiescent galactic clouds, but is lower than in the Orion compact ridge.
With respect to warm galactic sources, HNC is significantly enhanced. In the galactic disk, interstellar (HNC)/(HCN) abundance ratios cover a range of at least two orders of magnitude. In quiescent dark clouds the abundance ratio is close to or larger than unity (e.g. Churchwell et al. 1984; Harju 1989), while in warmer and denser clouds associated with massive star formation the ratio can decrease to values of 0.01 (e.g. Goldsmith et al. 1981, 1986; Schilke et al. 1992). It is thus highly surprising to find (HNC)/(HCN)1 in the warm environment of a nuclear starburst, like that in NGC 4945.
| Molecule | NGC | NGC | M 82 | Orion | Orion | TMC-1 |
|---|---|---|---|---|---|---|
| 4945 | 253 | Hot | Ridge | |||
| Core | ||||||
| COc) | -4.1 | -4.1 | -4.1 | -3.9 | -4.3 | -4.2 |
| 13CO | -5.8 | -5.7 | -5.7 | … | … | … |
| C18O | -6.4 | -6.4 | -6.1 | … | … | … |
| C17O | -7.2 | -7.2 | -7.0 | … | … | … |
| CN | -8.4 | -8.6 | -8.4 | -9.5 | -8.5 | -9.2 |
| CS | -8.2 | -8.7 | -7.9 | -8.2 | -8.6 | -8.6 |
| C34S | -9.4 | … | … | … | … | … |
| 13CS | -9.9 | -10.3 | … | … | … | … |
| SO | -9.0 | … | … | -7.7 | -9.0 | -9.0 |
| C2H | -6.9 | … | -6.8 | -9.5 | -8.3 | -8.6 |
| HCN | -7.7 | -8.0 | -8.0 | -6.5 | -8.3 | -8.4 |
| H13CN | -9.4 | -9.6 | … | … | … | … |
| HC15N | -9.8 | … | … | … | … | … |
| HCO+ | -9.5 | -7.7 | -8.3 | -8.6 | -8.6 | -8.1 |
| HNC | -7.5 | -8.3 | -8.7 | -9.0 | -9.3 | -7.9 |
| HN13C | -9.3 | -9.9 | … | … | … | … |
| N2H+ | -10.2 | -9.9 | -9.8 | … | -10.2 | -10.0 |
| OCS | -8.1 | -7.5 | -7.9 | … | -8.5d) | … |
| H2COe) | -8.7 | -7.9 | -7.5 | -7.6 | -7.8d) | -7.9 |
| HNCO | -8.6 | -8.4 | -8.1 | -8.2 | -8.7 | -10.1 |
| C3H2 | -8.3 | -9.2 | -8.7 | … | -10.1 | -8.0 |
| HC3N | -9.0 | -7.9 | -8.0 | -8.8 | -9.9 | -8.9 |
| CH3OH | -8.1 | -7.9 | -8.7 | -6.5 | -6.9d) | -9.1 |
| CH3CCH | -8.4 | -7.8 | -7.3 | … | -8.5 | -8.7 |
-
a)
Most fractional abundances of the TMC-1 were taken from Pratap et al. (1997, their weighted mean; see also Leung et al. 1984; Millar & Freeman 1984; Madden et al. 1989). Orion data were taken from Blake et al. (1987) and Comito (2003). Fractional abundances of NGC 253 and M 82 ((H2) = 4.01022 cm-2 and 1.0 1022 cm-1, respectively; Mauersberger et al. 2003) are, whenever possible, based on spectra from the 30-m telescope on Pico Veleta/Spain (see Henkel et al. 1988, 1993, 1998; Mauersberger & Henkel 1989; Mauersberger et al. 1990, 1991, 1995; Nguyen-Q-Rieu et al. 1991, 1992; Hüttemeister et al. 1995, 1997; Harrison et al. 1999; Oike et al. 2004), complemented by higher excited lines measured with similar beam size at the HHT (Heinrich Hertz Telescope) on Mt. Graham/USA (Mauersberger et al. 2003). For NGC 4945, see this paper ((H2) = 61022 cm-2); for N2H+, see Sage & Ziurys (1995).
-
b)
In most cases excitation conditions were assumed to be the same in NGC 4945, NGC 253 and M 82. This is a simplification in view of the discussion about HC3N in Sect. 8.3. The CN opacity correction derived in Sect. 5.1.1 for NGC 4945, +0.2 dex, was however not applied to NGC 253 and M 82 (for the CN data, see Henkel et al. 1988). While HCO+ emission was assumed to be optically thin in NGC 4945 (Sect. 5.3), a small HCO+/H13CO+ line ratio (10) and 12C/13C 40 (Henkel et al. 1993) yield 4 for NGC 253. Thus for NGC 253 0.6 dex were added to the column density calculated assuming optically thin emission. Fractional N2H+ abundances were obtained from 12-m Kitt Peak data (Sage & Ziurys 1995) with a large beam size, that reduces their beam averaged column density significantly. This is compensated by the high rotational temperature ( = 30 K versus 8 K in Table 7). (N2H+) in NGC 253 and M 82 and (HCN), (HNC) and (C2H) in M 82 may suffer from optical depth and excitation effects that cannot be quantified. For details concerning column densities in NGC 4945, see Table 7. From the OCS column densities, derived by Mauersberger et al. (1985) for 11′′ sized regions, 0.6 dex were subtracted to adjust (OCS) to a source size of 20′′. While there exists an HC3N multilevel study for NGC 253 (Mauersberger et al. 1990) similar to the one outlined in Sect. 4.3 for NGC 4945, only the HC3N -10–9 line was reported from M 82 (Henkel et al. 1988). Adopting the excitation conditions of NGC 4945 yields a logarithmic fractional abundance of –8.7, while excitation conditions similar to NGC 253 yield –7.3 for M 82. The mean of these two values is given.
-
c)
For the extragalactic sources, the fractional CO abundance was taken from Frerking et al. (1982). The corresponding abundances for the galactic sources are based on direct measurements (e.g. Blake et al. 1987).
-
d)
Orion Compact Ridge
-
e)
Galactic abundances include para- and ortho-H2CO. For the extragalactic sources ortho-H2CO column densities (Table 7; Hüttemeister et al. 1997) were upgraded by 0.1 dex.
8.3 NGC 4945, NGC 253 and M 82
NGC 253, M 82 (NGC 3034) and NGC 4945 are with =2.5–4.0 Mpc the three nearest starburst galaxies. All of them show a rich molecular spectrum and infrared luminosities of a few times 1010 L⊙. Line intensities in NGC 253 and NGC 4945 can be similar while those towards M 82 tend to be slightly lower (compare e.g. our Table 2 with Table 1 in Sage & Ziurys 1995). While the starburst in NGC 253 is compact, mostly originating from a 60 pc sized region slightly southwest of the nucleus (Telesco et al. 1993), the starburst in M 82 is more extended exhibiting two lobes at a distance of 150–250 pc from the dynamical center that may be part of a molecular ring (Mao et al. 2000).
Not only with respect to size and overall morphology but also with respect to molecular abundances, the nuclear regions of NGC 253 and M 82 are quite distinct. While abundances of CN, CS, HCN, HNC, C3H2 and CH3CCH are similar, SiO, HNCO, CH3OH and CH3CN are clearly underabundant in M 82 (see Mauersberger et al. 1991, 2003; Nguyen-Q-Rieu et al. 1991, 1992; Henkel et al. 1993; Mauersberger & Henkel 1993; Hüttemeister et al. 1997; García-Burillo et al. 2001). Recently, an underabundance in NH3 was also demonstrated (Weiß et al. 2001a; Mauersberger et al. 2003), while HCO was detected in M 82, not in NGC 253 (García-Burillo et al. 2002). According to Takano et al. (1995), molecules formed by ion-molecule and neutral-neutral reactions with a low activation energy barrier are seen in both galaxies, while species requiring neutral-neutral reactions with significant activation energy or dust grain related reactions are abundant only in NGC 253.
In order to explain the chemical discrepancies, Mao et al. (2000) proposed the presence of a warm diffuse interstellar medium that is responsible for the bulk of the CO emission in M 82. This medium is a consequence of cloud-cloud collisions, shocks, high gas pressure, high stellar densities and numerous young massive stars that may have led to the evaporation of vast amounts of dense cool gas creating a highly fragmented molecular cloud debris. While the use of their LVG code does not necessarily lead to an area filling factor that is similar to the volume filling factor and while not all of their PDR model input parameters are self-consistent, more recently published data convincingly confirm their proposed scenario. CO is highly excited and must arise predominantly from gas with kinetic temperatures well in excess of 50 K (Mao et al. 2000). The rotation temperature of NH3 is, however, only 30 K (Weiß et al. 2001a; Mauersberger et al. 2003), implying 50 K, and HCN data suggest temperatures of order 20–60 K (Seaquist et al. 1998). Weiß et al. (2001a) also find that the fractional NH3 abundance decreases from low values in the lobes to even smaller ones near the dynamical center.
Overall 60 m/100 m dust temperatures for NGC 253 and M 82 are (as the total infrared luminosities) quite similar. They are of order 50 K for a modified Planck function , where is the dust temperature, the Planck function and the emissivity of the dust grain population at frequncy . , =1. In M 82 it thus appears that NH3, HCN and other high density tracers arise from dense gas with kinetic temperatures close to the dust temperature, that is too low for the synthesis of significant amounts of SiO and CH3CN or for NH3 and CH3OH evaporation from dust grains. The lower density tracer CO, however, predominantly originates from the warm UV irradiated surfaces of molecular clouds. This view is further supported by the comparatively larger amount of molecular gas at 150 K, about ten times as much as in NGC 253 (Rigopoulou et al. 2002). At these temperatures, NH3 is evaporated from dust grains. Since we see NH3 at such temperatures in NGC 253 but not in M 82, the warm (150 K) molecular gas in M 82 must be tenuous, i.e. column densities of individual molecular filaments are not high enough to shield the molecules from rapid photodissociation. Since HCO is observed in the Milky Way at the interfaces between molecular and ionized gas, the non-detection of HCO in NGC 253 and detailed maps of HCO in M 82 (García-Burillo et al. 2002) further strengthen the idea that the molecular region of M 82 can be viewed as a giant PDR. Apparently, the starburst in M 82 represents a later stage of evolution than the starburst in NGC 253.
The crucial question then is whether the nuclear region of NGC 4945 resembles more closely that of NGC 253, that of M 82 or whether NGC 4945 represents the first known example of a starburst in yet another evolutionary stage. Based on the weakness of B emission Koornneef (1993) coined the term ‘Postburst Infrared Galaxy’ for objects like NGC 4945. Therefore similar physical and chemical conditions might be expected in the nuclear environment of M 82 and NGC 4945. Ott et al. (2001), however, identified a bar-like feature in NGC 4945 and claimed that large amounts of molecular material can still reach the nuclear region providing sufficient fuel for an ongoing starburst.
Table 8 provides some clues to the stage of the starburst in NGC 4945. Apparently, fractional abundances of CH3OH and HNCO are close to those of NGC 253, i.e. NGC 4945 does show the underabundances that characterize the molecular spectrum of M 82. For NGC 4945 and NGC 253, carbon and oxygen isotope ratios appear to be identical within the error limits, while the ratios are less well constrained for M 82 (Table 6). An important test, the measurement of thermal SiO, HCO and CH3CN, is, however, still required to obtain a complete picture. While we may have seen some traces of SiO in NGC 4945 (see Fig. 5 and Sect. 5.3), better data are needed for a comparison.
An evaluation of molecular line excitation can be made for HC3N, comparing our data with the HC3N multilevel study of Mauersberger et al. (1990) towards NGC 253. In the latter galaxy, excitation is significantly higher than in NGC 4945, i.e. there is a high excitation component leading to a detection of the =26–25 line. For NGC 4945, our model calculations (Sect. 4.3) clearly indicate that the line is undetectable even if a 30-m sized telescope had been used.
8.4 CN, HNC and HCN in NGC 4945 and other galaxies
Hüttemeister et al. (1995) and Aalto et al. (2002) compared CN =1–0 and 2–1, HNC =1–0 and HCN =1–0 line intensities in a representative sample of galaxies, including targets that resemble the Galaxy (e.g. IC 342), weak starburst galaxies (e.g. NGC 253 and M 82), luminous infrared galaxies (LIRGs; e.g. Arp 299) and ultraluminous infrared galaxies (ULIRGs; e.g. Arp 220). As already mentioned in Sect. 8.2, galactic HNC/HCN abundance ratios vary by at least two orders of magnitude (Schilke et al. 1992). This is, however, not fully seen in the extragalactic line intensity ratios, (1) because particularly high HCN abundances lead to optically thick =1–0 lines with intensities that do not fully reflect the column density and (2) because the surveyed regions of 1 kpc in size smear out any extreme values on small spatial scales. Thus [HNC]/[HCN] (HNC)/(HCN) 1 with [X] and (X) denoting the abundance (relative to H2) and intensity of the respective molecule. Equal excitation is assumed and is supported by similar molecular constants and electric dipole moments.
Towards NGC 4945, the HNC abundance is high. (HNC)/(HCN)0.5 is near the average of the values determined by Hüttemeister et al. (1995) and Aalto et al. (2002). The ratio of the optically thin lines of the rare isotopomers HN13C and H13CN indicates, however, that [HNC]10-7.5. This is exemplified by the relatively small HNC/H13NC line intensity ratio in NGC 4945 (see Table 2) and the relatively large one in NGC 253 (Henkel et al. 1993), indicating lower optical depths in the latter case, since the 12C/13C carbon isotope ratios appear to be similar in both galaxies.
| CN =1–0/ | HCN =1–0 | 1.79 |
| CN =2–1/ | HCN =1–0 | 1.31 |
| HCO+ =1–0/ | HCN =1–0 | 1.07 |
| HNC =1–0/ | HCN =1–0 | 0.54 |
| HN13C =1–0/ | H13CN =1–0 | 1.10 |
-
a)
Taken from Table 2. Uncertainties amount to 15%.
As already mentioned in Sect. 8.2, high HNC/HCN line intensity and abundance ratios (near unity) are a characteristic property of dark clouds with small temperature (10 K) and moderate density ((H2)104-5 cm-3). At higher values and densities HNC may more efficiently react e.g. via HNC+OCO+NH and HNC+HHCN+H that shifts the chemical balance between HNC and HCN in favor of the latter species. Recently, however, Herpin & Cernicharo (2000) showed that in the warm (250 K) and dense ((H2)107) circumstellar torus of the protoplanetary nebula CRL 618 HNC and HCN are similarly abundant. Aalto et al. (2002) proposed that [HNC]/[HCN]1 is not only typical for dark clouds but may also characterize warm regions as long as the ion abundance is high. Protonized HCN and HNC, i.e. HCNH+, will then recombine to produce HCN and HNC in equal quantities.
A cool molecular halo of moderate density with particularly high HNC abundance that surrounds the nuclear region was alternatively proposed by Hüttemeister et al. (1995). This is, however, not a viable explanation for all sources, since our study of NGC 4945 is confined to the inner 20′′ and a cool moderately dense foreground layer from the outer disk (NGC 4945 is viewed almost edge-on, see Sect. 1) would have been seen in other molecular lines, most notably those of CO. Another alternative, a cool moderately dense gas component within the nuclear environment does also not explain all observations. While such gas is common in the central kiloparsec of our Galaxy (e.g. Hüttemeister et al. 1997), ULIRGs like Mrk 231 do not exhibit a cool dust component that would be associated with such a hypothesized cool source of HNC emission.
Aalto et al. (2002) outlined an evolutionary scenario starting with bright HCN emission from dense quiescent warm gas with little CN and HNC, reaching a PDR-phase with (CN)(HCN) and ending with bright HNC but little CN, when the starburst has evolved beyond a strong radiative impact from young massive stars, while the cloud’s chemistry is still dominated by ion-neutral reactions at moderate gas density and relatively high electron abundance. NGC 4945 is in the intermediate phase, with (CN)(HCN) (see Table 9), like NGC 253 (see Henkel et al. 1993), but with considerably more HNC, suggesting a later stage of evolution. M 82 is also characterized by (CN)(HCN), while the optical depth of HNC remains poorly constrained (Henkel et al. 1998). The starburst in M 82 is in a later stage of evolution, because here it is not apparent that large amounts of fresh molecular fuel continue to reach the central region. The (CN =1–0 =3/2–1/2)/(HCN =1–0) ratio may serve as an indicator for the importance of PDRs (e.g. Greaves & Church 1996; Rodriguez-Franco et al. 1998). In the galactic nuclear region, the ratio is 0.3 (Paglione et al. 2002). For NGC 253, NGC 4945 and M 82, we find 0.8, 1.1 and 1.3, respectively.
9 Energetics
The heating of gas in the nuclear environment of spiral galaxies is one of the major puzzles in our understanding of the interstellar medium. A variety of potential heating mechanisms has been proposed but to discriminate between the various physical processes has turned out to be extremely difficult. Proposed were (1) cosmic ray heating (e.g. Güsten et al. 1981; Bradford et al. 2003), (2) stellar ultraviolet heating via PDRs (e.g. Hollenbach & Tielens 1997; Mao et al. 2000; Schulz et al. 2001; García-Burillo et al. 2002), (3) heating by X-rays, e.g. from the active galactic nucleus (AGN) resulting in an X-ray dominated region (XDR; e.g. Lepp & Dalgarno 1996; Usero et al. 2004), (4) dynamical heating by shocks (e.g. Martín-Pintado et al. 1997, 2001; Hüttemeister et al. 1998; García-Burillo et al. 2000, 2001) triggered by outflowing material from massive stars or active galactic nuclei, by cloud-cloud collisions, by tidal forces or by clouds gravitationally dominated by the mass distribution of the embedded stars (e.g. Downes et al. 1993; Mauersberger et al. 1996b) as well as (5) by ambipolar diffusion or ion slip that might be particularly significant in the potentially strong magnetic fields of the nuclear environment of spiral galaxies (e.g. Scalo 1977).
In local dark clouds, cosmic rays are a major source of energy, yielding kinetic temperatures of 5–10 K alone. With a detailed chemical model, also involving cooling by the fine structure lines of O and C and by CO, Farquhar et al. (1994) find for cosmic ray heating =6.7 K, with the factor denoting the enhancement (1) of the cosmic ray flux over the solar system value. Adopting 103 for sources like NGC 253, M 82 and NGC 4945 (e.g. Bradford et al. 2003; for supernova rates, see Ulvestad & Antonucci 1997), we thus obtain 50 K, in good agreement with the temperature of the dust in the starburst environment of all three galaxies. This is consistent with a scenario for M 82 that assumes a significant contribution to the overall heating by cosmic rays for the dense deeply embedded gas, while the warmer CO is heated by PDRs (see Sect. 8.2). In NGC 253, however, both CO (Bradford et al. 2003) and NH3 (Mauersberger et al. 2003) arise from regions characterized by 100 K, so that at least for these two molecules, cosmic ray heating appears not to be sufficient. So far, NGC 4945 is less thoroughly studied. Detections of NH3 and of highly excited CO lines have not yet been obtained. To confirm or reject our finding that NGC 4945 appears to resemble more NGC 253 than M 82, higher excited (3) CO lines and NH3 should also be measured.
Since high CO and NH3 line data are not yet available, indications for high molecular cloud temperatures are still rare for NGC 4945. Perhaps the strongest hint for the presence of warm molecular gas at mm-wavelengths is our HC3N multilevel study (Sect. 4.3), where the assumption of a ‘normal’ density also seen in most other molecular tracers, 105 cm-3, leads to a kinetic temperature of 100 K. While the presence of gas at such temperatures is a typical property of PDRs, HC3N is a tracer of deeply embedded molecular material that may be less affected by UV heating than CO. Furthermore, HCO, a tracer of PDRs, appears to be weak in NGC 4945 (Sect. 5.3). While PDRs will certainly exist in the nuclear environment of NGC 4945, they appear not to be widespread enough to cause heating on large spatial scales. Heating by shocks or ambipolar diffusion are thus more likely the physical processes that may heat the gas on large scales in the nuclear starburst environment of NGC 4945. In view of the presence of shocks that are expected to be associated with the bar identified by Ott et al. (2001), the measurement of a well calibrated SiO =3–2 (=0) profile would be highly desirable.
An alternative heating source could be X-ray radiation, leading to a high ionization rate (Lepp & Dalgarno 1996; Usero et al. 2004). Here we expect that the 20′′ region, corresponding to a linear scale of 390 pc, is too large to be dominated by the AGN, which is consistent with an (HCN)/(CO) line intensity ratio that is far from the extreme value measured toward the central region of NGC 1068 (Sternberg et al. 1994). The observed abundances of CO, HCO+ and HCN match those calculated by Lepp & Dalgarno (1996) for an ionization rate per hydrogen atom, /(H), of 10-19…-18 cm-3 s-1, but the measured CN abundance (see Table 8) is an order of magnitude too low.
10 Conclusions and prospects for future research
Toward the nucleus of the southern starburst galaxy NGC 4945, 80 lines from a total of 19 molecules have been observed, including 49 detected line features, 9 tentatively detected transitions and 22 undetected lines.
Two velocity components, one at 450 km s-1, the other at 710 km s-1, characterize many but not all spectra. The former component is wider; the latter component is higher excited as is indicated by HCN, HCO+ and CN spectra. While no maps are presented, CO/13CO line intensity ratios as a function of velocity are consistent with a ring-like morphology of the emitting gas.
Using the LVG or LTE approximation, H2 densities and fractional abundances of 24 molecular species (including isotopomers) were calculated. Many of these species indicate the presence of a prominent high density interstellar gas component characterized by 105 cm-3. Excitation temperatures are in some cases quite low and reach 3–4 K in the case of CN. HNCO data indicate a mm-wave background radiation field of 30 K.
Based on column densities derived from CO and from the 1.3 mm dust continuum (2.80.3 Jy), the H2 to integrated CO =1–0 line intensity conversion factor ‘’ becomes 3.51019 cm-2 [K km-1]-1. This is a factor 7 smaller than values found for the galactic disk.
Calculated fractional abundances are compared with abundances observed toward the starburst galaxies NGC 253 and M 82 and selected galactic sources. The chemical properties of the gas in NGC 4945 resemble more those in NGC 253 than in M 82. There are, however, differences between NGC 4945 and NGC 253. One is excitation. HC3N is more highly excited in NGC 253. Furthermore there is an ‘overabundance’ of HNC in the nuclear environment of NGC 4945. The HNC/HN13C =1–0 line intensity ratio is with 11 particularly small indicating a high optical depth (5) in HNC =1–0. Thus NGC 4945 is one of the few known starburst galaxies with an HNC/HCN abundance ratio 1 that may be caused by a high abundance of ions. A detailed analysis of CN, HCN and HNC line intensities and abundances suggests that the starburst in NGC 4945 is in a stage of evolution that is intermediate between those of NGC 253 and M 82.
Carbon, nitrogen, oxygen and sulfur isotope ratios are determined. Carbon and oxygen isotope ratios in the nuclear environment of NGC 4945 and NGC 253 appear to be almost identical, while ratios from M 82 are less well constrained. High 18O/17O, low 16O/18O and 14N/15N and perhaps also low 32S/34S ratios (6.40.3, 19545, 10525 and 13.52.5, respectively) are characteristic properties of a starburst environment, where massive stars have had sufficient time to affect the isotopic composition of their surrounding ISM. The 12C/13C ratio is about twice as large as in the central region of the Milky Way, suggesting the presence of inflowing gas.
Much work still remains to be done. Determining isotope ratios of sulfur in the nuclear environment of starburst galaxies offers a unique chance to study the isotopic composition of sulfur ejecta from massive stars undergoing oxygen burning. Obtaining a more complete view onto the 32S/34S ratio in NGC 4945 and estimates of 32S/34S in NGC 253, M 82 and perhaps Arp 220 would thus provide important insights into aspects of stellar nucleosynthesis. Detecting 13CN and obtaining a definite detection of 13CS would further constrain the 12C/13C and 16O/18O ratios in the nuclear region of NGC 4945 and would thus also be fundamental for a better understanding of the chemical and physical conditions in a starburst environment.
In spite of the large number of detections, our line survey is not complete. While it appears that the chemical composition of the gas in the central part of NGC 4945 is more resembling NGC 253 than M 82, three important tracers have not yet been convincingly measured: thermal SiO, CH3CN and HCO. Furthermore, NO could be an interesting tracer for X-ray related chemistry. If our finding of similar chemical composition is valid for NGC 4945 and NGC 253, SiO and CH3CN should be detectable in NGC 4945, while HCO should be weak.
Our 13CO =3-2 line profile is, with respect to intensity and lineshape, incompatible with the other CO transitions observed. This also holds for the lineshape of the C3H2 212–101 transition with respect to the other C3H2 line profiles. Another measurement with careful pointing is thus needed to obtain better agreement or to confirm the inconsistencies.
By far the most important lack of observational data refers, however, to the absence of interferometric maps in NGC 4945. Molecular measurements are so far constrained to linear scales of several 100 pc. It is still not known why some species show an almost Gaussian line profile (e.g. H2CO), while others show two pronounced peaks at 450 and 710 km s-1 (e.g. CN). High angular resolution maps could determine the location, kinematics and spatial distribution of the distinct velocity components. Where is the region with HNC/HCN1 line intensity ratios located? Will high resolution HNC and HCN line maps provide important constraints for chemical models of the starburst environment and the role of the AGN? And what is the distribution of the HNC/HN13C line intensity ratio that allows us to estimate optical depths? Can SiO, HCO and H13CO+ be disentangled from each other as it was possible in the case of M 82? In the near future, interferometric maps of ATCA (Australian Telescope Compact Array) and SMA (SubMillimeter Array) will be available and single-dish telescopes like APEX (Atacama Pathfinder Experiment) will provide data on highly excited spectral lines that are crucial to identify the major heating source(s). The goal of this paper is to provide a reliable observational basis for these measurements.
Acknowledgements.
We wish to thank C. C. Chiong and C. M. Walmsley for providing an LVG code for SO and S. Leurini for the use of her CH3OH LVG code. We also acknowledge the use of HNCO collision rates provided by S. Green (http://www.giss.nasa.gov/data/mcrates/#hnco) and of CH3OH collision rates provided by D. Flower. We acknowledge useful discussions with S. Aalto, E. Hails and K. Menten and thank S. García-Burillo for critically reading the manuscript. M. W. acknowledges support by the exchange program between the Chinese Academy of Sciences and the Max-Plank-Gesellschaft, and partly by grants 10133020 from NSFC & G19990754 from CMST. J. B. W. and M. H. C. acknowledge the financial support supplied by the Australian Government’s Access to Major Research Facilities Program (AMRFP) for travel to the SEST.References
- (1) Aalto, S., Polatidis, A. G., Hüttemeister, S., & Curran, S. J. 2002, A&A, 381, 783
- (2) Baan, W. A. 1985, Nature, 315, 26
- (3) Batchelor, R. A., Jauncey, D. L., & Whiteoak, J. B. 1982, MNRAS, 200, 19
- (4) Bergman, P., Aalto, S., Black, J. H., & Rydbeck, G. 1992, A&A, 265, 403
- (5) Blake, G. A., Sutton, E. C., Masson, C. R., & Phillips, T. G. 1987, ApJ, 315, 621
- (6) Bogey, M., Demuynck, C., & Destombes, J. L. 1984, Can. J. Phys., 62, 1248
- (7) Bradford, C. M., Nikola, T., Stacey, G. J., et al. 2003, ApJ, 586, 891
- (8) Chin, Y.-N. 1999, IAU Symp., 190, in New Views of the Magellanic Clouds, eds. Chu, Y.-H. et al., Kluwer, Dordrecht, p279
- (9) Chin, Y.-N., Henkel, C., Whiteoak, J. B., Langer, N., & Churchwell, E. B. 1996, A&A, 305, 960
- (10) Chin, Y.-N., Henkel, C., Langer, N., & Mauersberger, R. 1999, ApJ, 512, L143
- (11) Churchwell, E., Nash, A. G., & Walmsley, C. M. 1984, ApJ, 287, 681
- (12) Churchwell, E., Wood, D., Myers, P. C., & Myers, R. V. 1986, ApJ, 305, 405
- (13) Comito, C. 2003, Exploring the Submillimeter Sky: Molecular Line Studies at 350m, Ph.D. Thesis, Univ. of Bonn
- (14) Cragg, D. M., Mikhtiev, M. A., Bettens, R. P. A., Godfrey, P. D., & Brown, R. D. 1993, MNRAS, 264, 769
- (15) Curran, S. J., Johansson, L. E. B., Bergman, P., Heikkilä, A., & Aalto, S. 2001, A&A, 367, 457 (C01)
- (16) Dahlem, M., Golla, G., Whiteoak, J. B., et al. 1993, A&A, 270, 29
- (17) de Vaucouleurs, G. 1964, ApJ, 139, 899
- (18) Done, C., Madejski, G. M., Zycki, P. T, & Greenhill, L. J. 2003, ApJ, 588, 763
- (19) Dos Santos, P. M., & Lépine, J. R. D. 1979, Nature, 278, 34
- (20) Downes, D., Solomon, P. M., & Radford, S. J. E. 1993, ApJ, 414, L13
- (21) Farquhar, P. R. A., Millar, T. J., & Herbst, E. 1994, MNRAS, 269, 641
- (22) Frerking, M. A., Langer, W. D., & Wilson, R. W. 1982, ApJ, 262, 590
- (23) Fuente, A., Martín-Pintado, J., & Gaume, R. 1995, ApJ,442, L33
- (24) García-Burillo, S., Martín-Pintado, J., Fuente, A., & Neri, R. 2000, A&A, 355, 499
- (25) García-Burillo, S., Martín-Pintado, J., Fuente, A., & Neri, R. 2001, ApJ, 563, L27
- (26) García-Burillo, S., Martín-Pintado, J., Fuente, A., & Usero, A. 2002, ApJ, 575, L55
- (27) Gerin, M., Combes, F., Encrenaz, P., et al. 1984, A&A, 136, L17
- (28) Greaves, J. S., & Church, S. E. 1996, MNRAS, 283, 1179
- (29) Goldsmith, P. F., Langer, W. D., Ellder, J., Kollberg, E., & Irvine, W. 1981, ApJ, 249, 524
- (30) Goldsmith, P. F., Irvine, W. M., Hjalmarson, A., & Ellder, J. 1986, ApJ, 310, 383
- (31) Green, S. 1994, ApJ, 434, 188
- (32) Green, S., & Thaddeus, P. 1974, ApJ, 191, 653
- (33) Greenhill, L. J., Moran, J. M., & Herrnstein, J. R. 1997, ApJ, 481, L23
- (34) Güsten, R., Walmsley, C. M., & Pauls, T. 1981, A&A, 103, 197
- (35) Harju, J., 1989, A&A, 219, 293
- (36) Harrison, A., Henkel, C., & Russell, A. 1999, MNRAS, 303, 157
- (37) Henkel, C., & Mauersberger, R. 1993, A&A, 274, 730
- (38) Henkel, C., Walmsley, C. M., & Wilson, T. L. 1980, A&A, 82, 41
- (39) Henkel, C, Mauersberger, R., & Schilke, P. 1988, A&A 201, L23
- (40) Henkel, C., Whiteoak, J. B., Nyman, L.-Å., & Harju, J. 1990, A&A, 230, L5
- (41) Henkel, C., Mauersberger, R., Wiklind, T., et al. 1993, A&A, 268, L17
- (42) Henkel, C., Whiteoak, J. B., & Mauersberger, R. 1994a, A&A, 284, 17 (H94)
- (43) Henkel, C., Wilson, T. L., Langer, N., Chin, Y.-N., & Mauersberger, R. 1994b, in The Structure and Content of Molecular Clouds, Lecture Notes in Physics 439, eds. Wilson, T. L., Johnston, K. J., Springer Verlag, Heidelberg, p72
- (44) Henkel, C., Chin, Y.-N., Mauersberger, R., & Whiteoak, J. B. 1998, A&A, 329, 443
- (45) Herpin, F, & Cernicharo, J. 2000, ApJ, 530, L129
- (46) Hollenbach, D. J., & Tielens, A. G. G. M. 1997, ARA&A, 35, 179
- (47) Hou, J. L., Prantzos, N., & Boissier, S. 2000, A&A, 362, 921
- (48) Hüttemeister, S., Henkel, C., Mauersberger, R., et al. 1995, A&A, 295, 571
- (49) Hüttemeister, S., Mauersberger, R., & Henkel, C. 1997, A&A, 326, 59
- (50) Hüttemeister, S., Dahmen, G., Mauersberger, R., et al. 1998, A&A, 334, 646
- (51) IRAS 1989, Cataloged Galaxies and Quasars observed in the IRAS survey, Fullmer, L., & Lonsdale, C., JPL D-1932, Version 2
- (52) Koornneef, J. 1993, ApJ, 403, 581
- (53) Langer, N., & Henkel, C. 1995, Space Sci. Rev., 74, 343
- (54) Lapinov, A. V., Troitskii, N. R., Zinchenko, I. I., & Henkel, C. 2001, Abstracts of All-Russian Astronomical Conference, S. Petersburg University, S. Petersburg, p109
- (55) Lepp, S., & Dalgarno, A. 1996, A&A, 306, L21
- (56) Leung, C. M., Herbst, E., & Huebner, W. F. 1984, ApJS, 56, 231
- (57) Lovas, F. J., & Suenram, R. D. 1989, J. Phys. Chem. Ref. Data, 18, 1245
- (58) Madden, S., Irvine, W. M., Matthews, H. E., Friberg, P., Swade, D. A. 1997, AJ 97, 1403
- (59) Maiolino, R., Risaliti, G., & Salvati, M. 1999, A&A, 341, L35
- (60) Mao, R. Q., Henkel, C., & Schulz, A., et al. 2000, A&A, 358, 433
- (61) Marconi, A., Oliva, E., van der Werf, P. P., et al. 2000, A&A, 357, 24
- (62) Martín-Pintado, J., de Vicente, P., Fuente, A., & Planesas, P. 1997, ApJ, 482, L45
- (63) Martín-Pintado, J., Rizzo, J. R., de Vicente, P., et al. 2001, ApJ, 548, L65
- (64) Mauersberger, R. & Henkel, C. 1989, A&A, 223, 79
- (65) Mauersberger, R., & Henkel, C. 1993, Rev. Mod. Astron., 6, 69
- (66) Mauersberger, R., Henkel, C., & Sage, L. J. 1990, A&A, 236, 63
- (67) Mauersberger, R., Henkel, C., Walmsley, C. M., Sage, L. J., & Wiklind, T. 1991, A&A, 247, 307
- (68) Mauersberger, R., Henkel, C., & Chin, Y.-N. 1995, A&A, 294, 23
- (69) Mauersberger, R., Henkel, C., Whiteoak, J. B., Chin, Y.-N., & Tieftrunk, A. R. 1996a, A&A, 309, 705
- (70) Mauersberger, R., Henkel, C., Wielebinski, R., Wiklind, T., & Reuter, H. P. 1996b, A&A, 305, 421
- (71) Mauersberger, R., Henkel, C., Weiß, A., Peck, A. B., & Hagiwara, Y. 2003, A&A, 403, 561
- (72) Mezger, P. G., Chini, R., Kreysa, E., & Wink, J. 1987, A&A, 182, 127
- (73) Mezger, P. G., 1990, in Physics and Composition of Interstellar Matter, eds. J. Krelowski and J. Papaj, Torun, p97
- (74) Millar, T. J., & Freeman, A. 1984, MNRAS, 207, 405
- (75) Moorwood, A. F. M., van der Werf, P. P., Kotilainen, J. K., Marconi, A., & Oliva, E. 1996, A&A, 308, L1
- (76) Nakai, N. 1989, PASJ, 41, 1107
- (77) Nguyen-Q-Rieu, Henkel, C., Jackson, J. M., & Mauersberger, R. 1991, A&A, 241, L33
- (78) Nguyen-Q-Rieu, Jackson, J. M., Henkel, C., Truong-Bach, & Mauersberger, R. 1992, ApJ, 486, 862
- (79) Oike, T., Kawaguchi, K., Takano, S., & Nakai, N. 2004, PASJ, in press
- (80) Ott, M., Whiteoak, J. B., Henkel, C., & Wielebinski, R. 2001, A&A, 372, 463
- (81) Paglione, T. A. D., Jackson, J. M., & Bergin, E. A. 2002, BAAS, 34,1229
- (82) Penzias, A. A. 1981, ApJ, 249, 518
- Pottage et al. (2001) Pottage, J. T., Flower, D. R., & Davis, S. L. 2001, J. Phys. B Atomic Mol. Phys., 34, 331
- Pottage et al. (2002) Pottage, J. T., Flower, D. R., & Davis, S. L. 2002, J. Phys. B Atomic Mol. Phys., 35, 2541
- (85) Pratap, P., Dickens, J. E., Snell, R. L., et al. 1997, ApJ, 486, 862
- (86) Rigopoulou, D., Kunze, D., Lutz, D., Genzel, R., & Moorwood, A. F. M. 2002, A&A, 389, 374
- (87) Rodriguez-Franco, A, Martín-Pintado, J., & Fuente, A. 1998, A&A, 329, 1097
- (88) Sage, L. J., & Ziurys, L. M. 1995, ApJ, 447, 625
- (89) Scalo, J. M. 1977, ApJ, 213, 705
- (90) Schilke, P., Walmsley, C. M., Pineau des Forts, G., et al. 1992, A&A, 256, 595
- (91) Schulz, A., Güsten, R., Köster, B., & Krause, D. 2001, A&A, 371, 25
- (92) Schurch, N. J., Roberts, T. P., & Warwick, R. S. 2002, MNRAS, 335, 241
- (93) Seaquist, E. R., Frayer, D. T., & Bell, M. B. 1998, ApJ, 507, 745
- (94) Skatrud, D. D., De Lucia, F. C., Blake, G. A., & Sastry, K. V. L. N. 1983, J. Mol. Spec., 99, 35
- (95) Solomon, P. M., Downes, D., Radford, S. J. E., & Barrett, J. W. 1997, ApJ, 478, 144
- (96) Spoon, H. W. W., Moorwood, A. F. M., Pontoppidan, K. M., et al. 2003, A&A, 402, 499
- (97) Sternberg, A., Genzel, R., & Tacconi, L. 1994, ApJ, 436, 136
- (98) Takano, S., Nakai, N., & Kawaguchi, K. 1995, PASJ,47, 801
- (99) Telesco, C. M., Dressel, L. L., & Wolstencroft, R. D. 1993, ApJ, 414, 120
- (100) Thaddeus, P., Vrtilek, J. M., & Gottlieb, C. A. 1985, ApJ, 299, L63
- (101) Thuma, G., Neininger, N., Klein, U., Wielebinski, R. 2000, A&A, 358, 65
- (102) Tiemann, E. 1974, J. Phys. Chem. Ref. Data, 3, 259
- (103) Tucker, K. D., Kutner, M. L., & Thaddeus, P. 1974, ApJ, 193, L115
- (104) Ulvestad, J. S., & Antonucci, R. R. J. 1997, ApJ, 488, 621
- (105) Usero, A., García-Burillo, S., Fuente, A., & Martín-Pintado, J. 2004, in The Neutral ISM in Starburst Galaxies, ASP Conf. Ser., eds. S. Aalto et al., in press (astro-ph/0310783)
- (106) Vrtilek, J. M., Gottlieb, C. A., & Thaddeus, P. 1987, ApJ, 314, 716
- (107) Walmsley, C. M., Güsten, R., Angerhofer, P., Churchwell, E., & Mundy, L. 1986, A&A, 155, 129
- (108) Weiß, A., Neininger, N., Henkel, C., Stutzki, J., & Klein, U. 2001a, ApJ, 554, L143
- (109) Weiß, A., Neininger, N., Hüttemeister, S., & Klein, U. 2001b, A&A, 365, 571
- (110) Whiteoak, J. B. & Bunton, J. D. 1985, PASA, 6, 171
- (111) Whiteoak, J. B. & Gardner, F. F. 1975, ApJ, 195, L81
- (112) Whiteoak, J. B., & Wilson, W. E. 1990, MNRAS, 245, 665
- (113) Whiteoak, J. B., Dahlem, M., Wielebinski, R., & Harnett, J. I. 1990, A&A, 231, 25
- (114) Wilson, T. L., & Rood, R. T. 1994, ARAA, 32, 191
- Xu & Lovas (1997) Xu, L.-H. & Lovas, F. L. 1997, J. Phys. Chem. Ref. Data, 26, 17
- (116) Ziurys, L. M., Saykally, R. J., Plambeck, R. L., & Erickson, N. R. 1982, ApJ, 254, 94