Molecular Cloud Formation Behind Shock Waves
Abstract
Motivated by our previous paper, in which we argued for the formation of molecular clouds from large-scale flows in the diffuse galactic interstellar medium, we examine the formation of molecular gas behind shocks in atomic gas using a one-dimensional chemical/dynamical model. In our analysis we place particular emphasis on constraints placed on the dynamical evolution by the chemistry. The most important result of this study is to stress the importance of shielding the molecular gas from the destructive effects of UV radiation. For shock ram pressures comparable to or exceeding typical local interstellar medium pressures, self-shielding controls the formation time of molecular hydrogen but CO formation requires shielding of the interstellar radiation field by dust grains. We find that for typical parameters the molecular hydrogen fractional abundance can become significant well before CO forms. The timescale for (CO) molecular cloud formation is not set by the H2 formation rate on grains, but rather by the timescale for accumulating a sufficient column density or extinction, .
The local ratio of atomic to molecular gas (4:1), coupled with short estimates for the lifetimes of molecular clouds (3-5 Myr), suggests that the timescales for accumulating molecular clouds from atomic material typically must be no longer than about 12-20 Myr. Based on the shielding requirement, this implies that the typical product of pre-shock density and velocity must be . In turn, depending upon the shock velocity, this implies shock ram pressures which are a few times the typical estimated local turbulent gas pressure, and comparable to the total pressures (gas plus magnetic plus cosmic rays). Coupled with the rapid formation of CO once shielding is sufficient, flow-driven formation of molecular clouds in the local interstellar medium can occur sufficiently rapidly to account for observations.
We also provide detailed predictions of atomic and molecular emission and absorption that track the formation of a molecular cloud from a purely atomic medium, with a view toward helping to verify cloud formation by shock waves. However, our predictions suggest that the detection of the pre-CO stages will be challenging. Finally, we provide an analytic solution for time-dependent formation which may be of use in numerical hydrodynamic calculations.
1 Introduction
The formation of stars and planetary systems is one of the fundamental problems in astrophysics. Much of the work over the past decades has examined the formation of low mass stellar systems because these objects sometimes form in isolation and are therefore easier to study individually. One of the earliest stages of stellar birth that has been the focus of numerous investigations is the creation of a centrally concentrated molecular core from a portion of a low-density parent giant molecular cloud (GMC). Theoretical models account for the condensation as occurring possibly via the slow diffusion of magnetic flux occurring over long timescales ( Myr) (Mouschovias 1999; Lizano & Shu 1989) or the dissipation of turbulence on shorter timescales (Stone, Ostriker, & Gammie 1998; Mac Low et al. 1998; Myers & Lazarian 1998; Nakano 1998). Observations of isolated pre-stellar molecular cores, such as L1544 in the Taurus Molecular Cloud, have provided fertile ground for comparison to these theories (Caselli et al 2002; Ciolek & Basu 2000; Williams et al 1999; Tafalla et al 1998). However, it is now recognized that most stars form in groups – from small aggregates to large clusters – and it is not clear that all theories developed for isolated star formation are easily applicable to the larger scales and simultaneity required for star cluster formation (Ballesteros-Paredes, Hartmann, & Vázquez-Semadeni 1999).
Expanding to larger scales opens the question as to whether the formation of stars, both isolated and clustered, might perhaps be intimately related to the formation of the GMC itself. In a previous paper (Hartmann, Ballesteros-Paredes, & Bergin 2001 HBB01) we pointed out that the great majority of molecular cloud complexes in the solar neighborhood appear to be forming young stars, and that the ages of the stellar populations in these clouds are typically 2 Myr; stellar associations of ages 10 Myr are devoid of molecular gas. The calculations indicating that MHD turbulence damps rapidly (Stone et al. 1998, Mac Low et al. 1998, Padoan & Nordlund 1999) also favor the suggestion of short cloud lifetimes, since there is no need for a continuous regeneration of MHD turbulence; additional support is found through arguments related to to cloud crossing times (Elmegreen 2000; HBB01). These results place significant empirical constraints on the mechanism(s) of nearby molecular cloud formation (see Mac Low & Klessen, 2004; Ballesteros-Paredes, 2004; Elmegreen & Scalo, 2004, for a review). For example, it is difficult to reconcile for the transient nature of local clouds with models in which complexes are built up by the coalescence of smaller molecular clouds, or theories in which molecular gas is mostly moved around from one place to another (see Elmegreen 1993 and references therein), because these processes are likely to take much more than Myr to occur. Moreover, short cloud lifetimes also place severe constraints on the processes leading toward fragmentation of the GMC and the condensation towards star formation.
In HBB01 we suggested that chemical transformations of local gas are essential to understanding the observational constraints. We suggested that most clouds are formed by large scale flows in the diffuse atomic medium, and that they appear as molecular clouds only when the column density becomes high enough to shield the molecular gas from the dissociating effects of the interstellar radiation field (ISRF). We further noted that self-gravity is likely to become important for column densities comparable to that needed for shielding (also Franco & Cox 1986), which would explain the rapid onset of star formation after molecular cloud formation. Finally, we suggested that dispersal of star-forming gas is accompanied by a reduction in shielding, so that the gas may revert to an atomic state some time before it is completely physically removed from the neighborhood.
These suggested chemical transformations lessen, but do not necessarily eliminate, the difficulty of making clouds “fast enough”. The formation of H2 from atomic gas, which generally must precede the formation of CO, is not instantaneous. In addition, while H2 formation places important constraints on the problem, it must also be examined in the context of a model that incorporates the effects of H2 (and CO) self-shielding from the ultraviolet (UV) radiation field with extinction by dust grains, each with its own associated timescale. Following the molecular evolution is critical to an understanding of cloud formation because of observational bias; molecular clouds are essentially defined not by H2 emission but through CO emission. In addition, possible atomic precursors are difficult to identify against the galactic H I background (Ballesteros-Paredes et al. 1999).
In this paper we explore the formation of molecular gas in plane-parallel shocks, starting with atomic (neutral) (warm) gas. Our model incorporates all the relevant heating and cooling mechanisms appropriate for the interstellar medium (ISM), including chemical processes relevant to the transformation of atomic gas to molecular form. Koyama & Inutsuka (2000) considered a similar problem, and did include the important effects of shielding from UV radiation, but only examined maximum column densities of standard H I clouds ( cm-3). Thus, they only achieve molecular hydrogen fractions of a few percent, insufficient to follow cloud formation.
We explore a range of shock velocities comparable to the flows expected in the diffuse atomic medium (Ballesteros-Paredes, Hartmann, & Vázquez-Semadeni 1999, and references therein); the parameter ranges are also appropriate for models in which GMC formation is induced by galactic spiral density waves or energetic supernova. Moreover, by following the primary cooling lines in the atomic shock and the post-shock evolution we can predict fluxes for key transitions of C II, C I, O I, CO and other species spanning a range of initial ram pressures. This should aid in the search for the progenitors of molecular clouds. Finally as a by-product of this work we provide an analytic solution for the formation of molecules behind a shock and discuss the relation between gas temperature and extinction, both of which may be of some use to MHD modeling.
In §2 we describe the model with results and a parameter study provided in §3. In §4 we outline the observational possibilities for the detection of forming molecular clouds via both emission and absorption lines. Section 5 summarizes the implications of these results for star formation in the local neighborhood and in §6 we present our conclusions.
2 Model
We combine the results of two separate one-dimensional plane-parallel models to examine the full thermal and dynamical evolution of parcel of atomic gas that is heated by a shock, condenses, and cools via radiation while slowly evolving to molecular form. The first model (labeled as the Atomic code) examines the initial shock wave propagating through a purely atomic medium. This code, described in Raymond (1979) and Cox & Raymond (1985), has been extensively used to examine the coupled dynamical and ionization evolution of shocked gas in the ISM. The second model (labeled as the Molecular code) is a time dependent chemical model that has been used to examine molecular chemical evolution in the dense regions of the galaxy that are currently forming stars (Bergin & Langer, 1997; Bergin, Neufeld, & Melnick, 1998). This model computes the time evolution through the atomic/molecular transition and has been modified to include the same flow equations, dominant heating and cooling processes as Raymond (1979) (but see also Cox, 1972). Additional processes more relevant to the atomic/molecular transition have also been included. These will be discussed below.
2.1 Dynamical Solution
In each code the fluid equations for a steady state plane-parallel flow are used (Cox, 1972):
| (1) |
| (2) |
| (3) |
where is the density in cm-3, is the gas velocity, is the mass density, is the pressure, and is the magnetic field. is the enthalpy per particle, while and are the cooling and heating rates respectively. These equations are solved simultaneously with the chemistry to provide atomic and molecular abundances, gas temperature, and gas density as a function of distance/time. In the following we assume that , but in our dynamical calculations we have accounted for the presence of heavy atoms.
In the one-dimensional framework as the shock propagates through the medium there is a build-up of colder and denser material behind the shock. Gas and dust in this column will absorb interstellar UV radiation. The majority of absorption is by dust grains, but as molecules begin to form self-shielding of H2 or CO molecules can become important. The visual extinction can be estimated via the time integration of equation (1):
| (4) |
in this equation is assumed to be the moment of the initial shock in the medium. This calculation has been included in both models to examine the attenuation of X-rays and the UV photons responsible for gas heating and photodissociation.
2.2 Initial Conditions and Chemistry
In our models we have assumed that a shock, with speeds up to 50 , propagates into the galactic warm neutral medium with an initial temperature of 1000 K. The pre-shock density is set to the average density of the ISM = 1 cm-3, but higher pre-shock densities have been explored. In all the models examine a range of shock ram pressures from 1 – 30 cm-3 K. Since dust is required for the UV shielding we have adopted depleted metal abundances based on observations of Oph. Abundances and references are provided in Table 1. Species are assumed singly ionized or neutral depending upon whether their ionization potential is above (He, N, O, Ne, Ar) or below (C, Mg, Si, S, Ca, Fe, Ni) 13.6 eV. At the start of the calculation H is predominantly neutral with a fractional ionization of 10-2 in the form of H+.
The choice of magnetic field strength necessitates special comment. As noted by many authors, even a very small component of the interstellar magnetic field tangential to the flow can prevent compression sufficient to make molecular gas. If the ram pressure of the shock is equal to the typical value in the local ISM, the equipartition magnetic pressure occurs G; any field parallel to the shock of this magnitude will prevent further compression. In a plane-parallel steady shock, the parallel field will be linearly proportional to the density, . If we wish to compress the gas from an initial density of, say, 3 to 300 , the parallel magnetic field must increase by a factor of at least 100 from its initial value. But G is the typical rms field strength in the diffuse ISM. Thus, unless the initial field parallel to the shock is only 1% of the initial total field strength, compression to form a cloud cannot occur. This qualitative argument is not changed unless the ram pressure is enormously greater than the typical ISM value.
HBB01 suggested that the solution to this problem is indicated by the MHD calculations of Passot, Vázquez-Semadeni, & Poquet (1995); specifically, that clouds tend to form at bends or “kinks” in the magnetic field, allowing material to flow along the field and finally compress in a direction perpendicular to the magnetic field. (See Figures 4 and 5 of HBB01 and related explanation in the text.) Putting it another way; flows which are not preferentially along field lines (bent or not) cannot form even diffuse clouds, let alone molecular clouds. Thus clouds must preferentially occur when conditions are such that the magnetic field does not prevent compression; flows in other directions, for other conditions, simply don’t make clouds. Based on this argument, and the results from the simulations of Passot et al. (1995), we assume that the initial magnetic field component parallel to the shock front is not dynamically important, adopting a nominal value below 0.01 G. Note that the component of the magnetic field perpendicular to the shock front is unconstrained in this one-dimensional model. Further, we note that even with such a small initial parallel magnetic field, the post-shock parallel magnetic field strength is not negligible in some cases, and can approach G.
The Atomic and Molecular models include relevant chemical processes specific for the treated phase. The Atomic model self-consistently solves for the time-dependent ionization state of all species included in Table 1. However, this model does not include molecular processes. In particular, the H- mechanism to form H2 is not incorporated, as this process is more important in fast shocks with significantly higher pre-shock densities and greater ion fraction (Hollenbach & McKee, 1979; Neufeld & Dalgarno, 1989). This model evolves until the post-shock gas temperature reaches 1000 K at which point the Molecular model adopts the final physical and chemical state from the Atomic code as initial conditions. All important parameters (density, temperature, abundances, Ly flux, heating rates, cooling rates, ionization fraction) are uniform to within a few percent at this hand-off.
The Molecular model self-consistently solves for the time dependent chemistry of molecular formation from a purely atomic medium using a minimized chemical network that focuses on the formation of H2, CO, and other simple carbon and oxygen-bearing molecules. The system of ordinary differential equations governing the chemical evolution is solved using the DVODE algorithm (Brown, Byrne, & Hindmarsh, 1989). In this calculation a conservation equation is included for each atomic pool. The minimized rate network has been used previously to examine the formation of water and molecular oxygen in dense molecular clouds (Bergin, Neufeld, & Melnick, 1998), and under those conditions has been tested extensively through successful comparisons to a larger network (Millar, Farquhar, & Willacy, 1997).
The model has been adapted to include the formation of H2 via surface recombination on grains with a rate provided in Table 2. We have assumed that the dust temperature is low enough to allow for H2 formation at the rate estimated in the ISM by Jura (1974). The calculations of Cazaux & Tielens (2004; see also Cazaux & Tielens 2002) indicate a near-unity efficiency of formation of H2, provided the dust temperature does not exceed K. In the ISM the average dust temperature derived from COBE data lies between 16 – 23 K (Reach et al. 1995); one expects that in regions with the needed dust extinction for shielding (see below), prior to star formation, the dust temperature will lie closer to the lower value.
The Molecular model does not treat the ionization state of atomic species beyond the singly ionized phase. This assumption is valid as most highly ionized atoms recombine early in the post-shock phase that is treated by the Atomic model prior the hand-off. One additional simplification in the Molecular model is that it does not include all the atomic species listed in Table 1. Instead the most abundant atomic species are included (H, He, C, O) with atomic and neutral iron as the sole representative heavy ion. This difference does not affect our results.
For the photodissociation rates of molecular species we use the rates compiled by Millar, Farquhar, & Willacy (1997), except for CO and H2 where we adopt the self-shielding formalisms of Lee et al. (1996) and Draine & Bertoldi (1996). These approximations include the effects of dust absorption and molecular line shielding. The H2 self-shielding approximation (Eq. 36) of Draine & Bertoldi (1996) is well matched to more exact models with a turbulent velocity parameter of 3 km s-1. The purely thermal line width in our calculations is generally well below this value. We do not correct for this difference, and under the assumption of small turbulent widths, our models would under-predict the effects of H2 shielding. This is not a question for CO, because the dissociation lines are broadened due to pre-dissociation (Aikawa & Herbst, 1999). We have also assumed the radiation field from the shock is not greater than the ISRF. Any significant ultraviolet radiation from the shock would lengthen timescales for molecular formation. However, our favored solutions involve weaker shocks ( km s-1) impinging upon gas with above average density. Such shocks would produce smaller amounts of UV radiation that will not significantly alter our primary results. Even the faster shocks we consider produce little UV radiation aside from Ly , and the large H I column in the atomic part of the flow effectively shields the molecular region from Ly photons.
We note that the Atomic model does not work well for shock speeds below . However, for many purposes the Molecular model behavior is independent of the results from the Atomic model, as long as the same pressure is maintained. Thus, one may extrapolate many of the results of the Molecular model to slower shocks with the same ram pressure.
2.3 Heating, Cooling, and Thermal Balance
Both the Atomic and Molecular models include the relevant heating and cooling processes for each regime. Thus both codes contain photoelectric, X-ray, and cosmic ray heating. The Molecular model also includes heating due to the formation of H2. Each model contains cooling via C II, C, and O line emission and H+ recombination. The molecular model also includes cooling via CO rotational emission in the ground vibrational state. Following the example of Wolfire et al. (1995) in Table 2 we summarize the major thermal processes and references included in these models.
In the initial stages of the post-shock evolution, while the excess dynamical energy is lost through radiation, the temperature and compression factor () are determined using the fluid equations (§2.1) and methods outlined by Cox (1972). At later stages when the dynamical energy of the shock has dissipated the temperature is derived through thermal balance of the heating and cooling terms via standard Newton-Rhapson techniques (Press et al 1988). Pressure balance then provides the compression factor. These solutions are determined in tandem with the chemical evolution.
3 Results
Our standard model assumes an initial shock velocity of km s-1 impacting gas with a temperature of K and a density of cm-3( 28000 cm-3 K). This shock speed is consistent with that induced by either spiral density waves (Shu et al., 1972; Roberts & Stewart, 1987) or turbulence driven collisions between flows (Ballesteros-Paredes et al 1999). A supernova will likely induce a series of shocks with a range of ram pressures covered by this standard solution and the additional runs that explore parameter space.
In all calculations presented below the Atomic model is used to examine the gas evolution while the temperature exceeds 1000 K. When gas temperature in the post-shock evolution decays to below this value the Molecular model is used to examine the subsequent evolution.
3.1 Standard Model
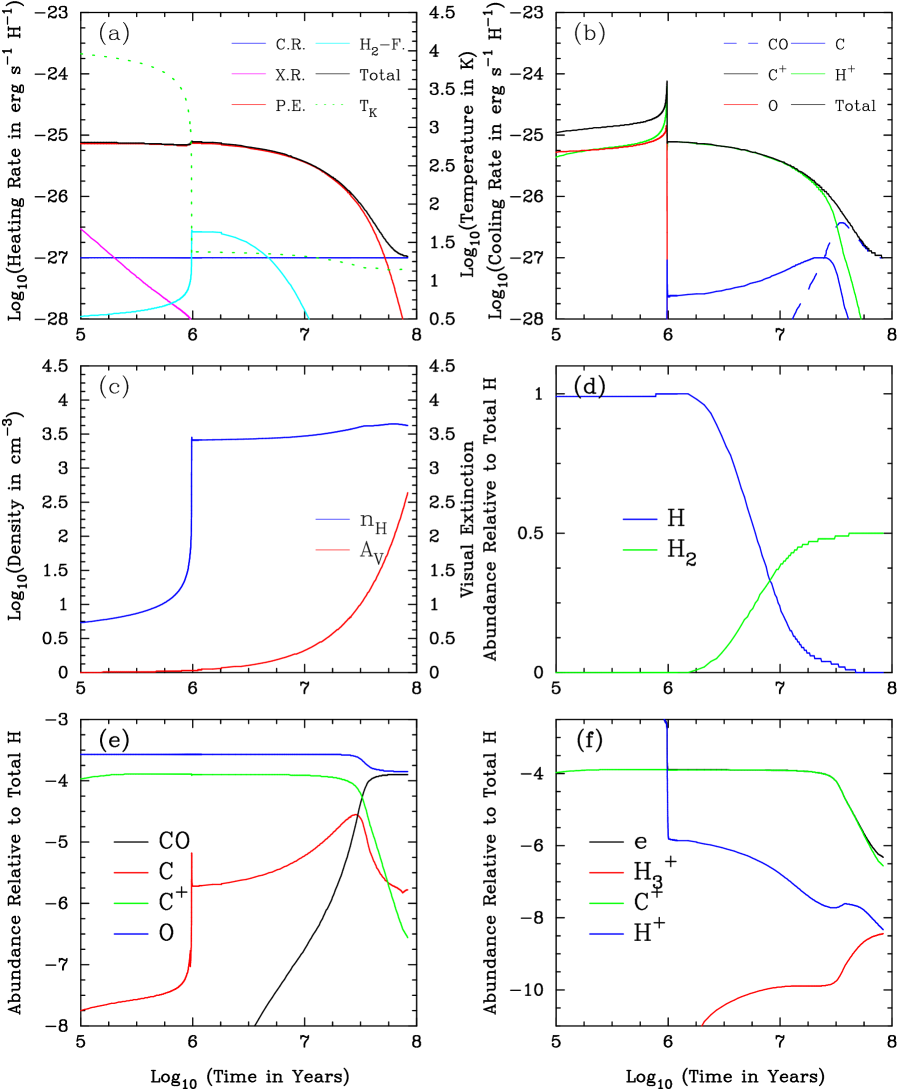
Figure 1(a-f) presents the physical and chemical evolution of the post-shock gas. Here panels (a-c) show the major heating and cooling terms along with the primary physical parameters (density, temperature, optical extinction) as a function of time. Panels (e-f) show the chemical abundances (relative to total H) of important molecular and atomic species as a function of time. In this figure t = 0 represents the onset of the shock.
After the shock the gas temperature is quite high ( K) with the primary cooling is via [C II], [O I], [Si II], and [Fe II] line emission (hydrogen line emission is also an important coolant in the initial stages). At early times ( yr) the heating processes which dominate the cold neutral medium (CNM), photoelectric and X-ray heating, are unimportant. At t = 106 yrs the temperature drops sharply at the cooling timescale set by the overall cooling rate. For this case ( and an initial density of 1 cm-3) the cooling timescale is yr (Spitzer 1978).
When the gas cools the density rises due to pressure equilibrium. At this point the solution reaches a stable high density atomic phase where photoelectric heating is balanced by [C II] cooling. This stable “plateau” is essentially the Wolfire et al. (1995) CNM solution and is roughly at the temperature of the CNM as measured by Heiles & Troland (2003). The plateau exists for yr until the onset of H2 formation which is followed by the formation of CO. At this point CO begins to dominate the cooling reducing the temperature to K. Photoelectric heating dominates throughout most of the post shock evolution until A mag, whereupon cosmic-ray heating is more important.111At these low densities the gas is thermally decoupled from dust grains. Prior to the formation of CO there is a period where the abundance of neutral carbon rises and it contributes to the cooling, but it is not the dominant carbon reservoir.
The timescale of this process is controlled by the formation time of H2 on grains and the slow buildup of shielding due to grains and H2 molecules downstream in the post-shock gas. At the density of the stable plateau (n cm-3; T = 23 K) the H2 formation time is yr. The onset of molecular formation occurs at much later times and therefore the evolution is controlled by the shielding of UV radiation. In our standard case the shielding of H2 is dominated by self-shielding with only small contributions from dust absorption. For CO the shielding is dominated through the UV photon absorption by dust grains.
3.2 Parameter Search
In the following we will examine different initial ram pressures through changes in the shock speed given the same initial density and temperature as the standard model. We also examine a few cases with a constant shock velocity but varying initial densities, to verify the similarity of results for similar ram pressures for the molecular gas.
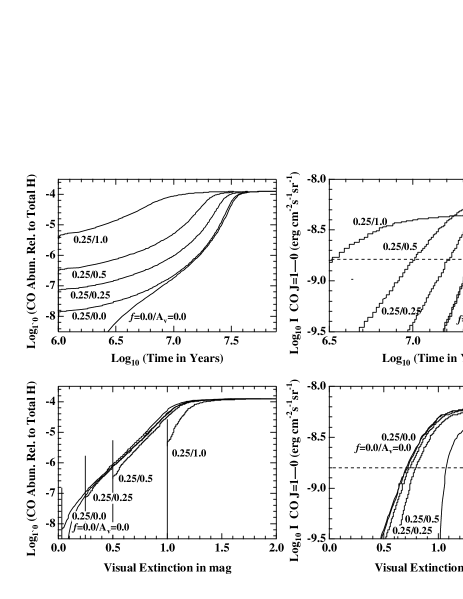
In Figure 2 we present the results from models with ( K; cm-3), which have ram pressures ranging from 1.4 – 36 cm-3 K. The H2 and CO abundance as a function of time and visual extinction are given in Figure 3. Rather than show the detailed evolution (as in Figure 1) we present the temporal evolution of salient parameters: density, temperature, and extinction. We note that the cooling time to T K is extremely short due to collisional excitation of H I. Thus the much higher immediate post-shock temperatures in the faster shock models do not appear in Figure 2.
In Figure 2 the cooling timescale to reach the stable temperature plateau decreases with increasing ram pressure. Similarly the timescales of molecular formation decrease (Figure 3). Both effects are due to the density of the solution plateau increasing with ram pressure. For H2, in each case, except for the 10 shock, self-shielding dominates over dust absorption. The reverse is true for CO, dust absorption dominates over self-shielding, except for a 50 shock, where self-shielding becomes more important at A mag.
In Figures 4 and 5 we examine models with the same shock speed () but different initial densities. We also show the , cm-3 case as it has similar ram pressure as the , cm-3 solution. Here we see similar effects as illustrated by models with increasing shock velocity, all timescales (cooling, molecular formation) shorten with increasing density. Models with similar ram pressure (compare P/k = 32000 cm-3 K with P/k = 29000 cm-3 K) have slightly different evolution in the physical and chemical properties seen in Fig. 4 and 5. Indeed the model with the slightly smaller ram pressure has faster physical and chemical evolution. In this model the temperature decay occurs more quickly because of the higher initial density, which increases the cooling through collisionally excited lines. Subsequently, H2 forms earlier, and the higher allows for faster CO formation. Overall the differences between these two cases are not large and are magnified by the log scale. However, this points out that the effects of mass conservation and pressure conservation are not equivalent. Solutions with higher densities will have faster dynamical evolution through increased cooling and quicker molecular evolution due to the decrease in the time to reach full shielding.
4 Observational Evidence for Molecular Cloud Formation
In principle the primary observational evidence for the cloud formation process would be H I emission from dense ( cm-3) purely atomic gas. However, in practice this is difficult because the excitation characteristics of 21 cm emission, and the pervasive presence of warm H I emission in the galactic plane, makes it difficult to disentangle cold and warm gas along a given line of sight (Spitzer, 1978; Kulkarni & Heiles, 1987). Some cold H I clouds have been isolated from emission studies (Knee & Brunt, 2001), but their relation to forming molecular clouds is unclear. A better way to detect cold atomic hydrogen is via absorption against warm H I background emission; and this has received more attention in recent years (Gibson, Taylor, Higgs, & Dewdney, 2000; Li & Goldsmith, 2003)
In general, the search for molecular cloud formation has typically concentrated on the cold stages of the evolution (i.e. not the shock itself but on the build up of molecular material). Thus catching a cloud undergoing incipient formation can be pursued by searching for gas that is dense by galactic ISM standards ( cm-3), with emission from atomic carbon but not associated with CO emission. However, any mechanism (e.g. spiral density wave, supernova shock, turbulent flow collision in ISM) that produces a shock wave which compresses the gas will produce emission and absorption associated with both warm (T 1000 K) and cold (T K) gas. Thus the important cold phase can be searched for via traditional tracers (e.g. [C I], CO), but traces of the shock may also be evident in atomic emission and absorption.
In the following sections we will present our model results which provide detailed predictions of atomic and molecular emission and absorption tracing the formation of a dense condensation of molecular gas.
4.1 Line Emission
4.1.1 Optical lines
Table 3 shows the relative line intensities of the stronger atomic emission lines. They are generally similar to the spectra of slow shocks used to interpret Herbig-Haro object spectra (Hartigan, Morse & Raymond 1994), except for the effects of the much higher densities in the HH object shocks. Depending on shock speed, the spectral signature may be strongly enhanced H or strongly enhanced [S II] emission.
The surface brightness of a slow shock in tenuous gas is quite low, typically a fraction of a Rayleigh, and a shock seen face-on would be difficult to detect. However, such a shock seen edge-on would be geometrically brightened in the same manner as emission filaments in supernova remnants. Edge-on shocks might be found near star forming regions, but depending on the thickness of the colliding clouds, the shock emission may cease before stars are formed. Therefore, the emission might be best seen as an extension of a filamentary molecular cloud.
The shocks studied here might also be detected through their cumulative contribution to the diffuse Galactic emission. For instance, Haffner et al (1999) report that some heating beyond that supplied by photoionization is required to account for the strengths of [N II] and [S II] lines detected at low spatial resolution by the Wisconsin H Mapper (WHAM). Minter & Spangler (1997) suggest that dissipation of turbulence might provide that extra heating. If that dissipation occurs in shocks, the shocks in the Warm Ionized Medium (WIM) would provide the [N II], while those in the Warm Neutral Medium (WNM) would contribute [O I] and [S II].
4.1.2 Far-Infrared and (sub)-Millimeter lines
While much of the shock energy is released via cooling lines in the UV, optical, and infrared, the majority of emission in cool post-shock phase lies in far-infrared and millimeter wavelengths. In Figure 6 we provide a plot of line intensity (erg cm-2 s-1 sr-1) as a function of time and visual extinction for our standard model ( cm-3 and ). Figure 6 shows only the evolution during the cold post-shock phase, but includes contributions to emission from the atomic shock model. In this Figure some transitions (e.g. [O I]) do not emit during the cold post-shock evolution, while others ([C II], [C I], CO) show a slow steady increase in emission with time due to the build up of column behind the shock.222For space considerations we provide only one sample of our results for a specific set of conditions. As seen in §3 we have examined a wide range of parameter space and additional plots can be provided upon request to the first author.
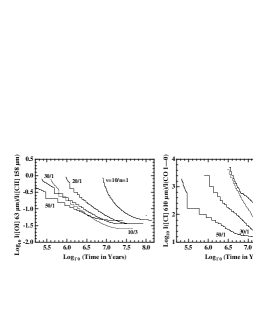
In Figure 7 we provide diagnostic plots of line intensity ratios for specific transitions that can be used as suitable tracers of cloud formation. In this plot examples are given for a range of parameter space. Because there is little [O I] emission in the cold phase the line ratio of [O I](63 m)/[C II](158 m) exhibits a factor of 30 drop until it saturates when CO has formed and removes carbon ions from the gas. The intensity ratio of [C I](610 m)/CO (1-0) also strongly varies (by nearly 2 orders of magnitude) over much of the evolution until the ratio again flattens due to the formation of CO. A key question for these diagnostics is whether this signature is unique or is indistinguishable with galactic photodissociation region (PDR) emission arising from gas with similar conditions. To examine this question we use the PDR models of Kaufman et al. (1999).
In the PDR model the [O I](63 m)/[C II](158 m) ratio ranges from 0.03 0.3 for conditions that mimic those in our models (n cm-3; G). This range is quite similar to that seen in our results; only for a short time at the start of the post-shock evolution is the ratio significantly greater. Thus this ratio is not a strong signpost of molecular cloud formation. However, the [C I](610 m)/CO (1-0) ratio does differ from PDR models (which predict ratios between 25 – 50 for similar conditions). This is essentially due to the increased column of atomic carbon during stages prior to CO formation, in PDR models the atomic carbon is created via photodissociation of CO. However, it should be noted that the [C I](610 m) emission is quite weak at times where the [C I](610 m)/CO (1-0) ratio is highly elevated above typical PDR values. Best results appear to require deep searches for [C I](610 m) emission to a level below 0.1 K km s-1 (I = 1.22 erg cm-2 s-1 sr-1).
4.2 Absorption Lines
4.2.1 Total Column Densities
In some instances favorable placement may provide a background source to detect cold post-shock gas absorption. For H I, galactic hydrogen emission provides a nearly ubiquitous background. In our models the total column for a given species is determined by the initial shock conditions, the chemistry, and also by the time evolution. Thus, there is no single value of the column density. In Table 4 we provide a sample of the predicted column densities of atomic and molecular tracers as a function of shock model and for a sampling of total extinction (Av = 0.2, 0.5, and 1.0 mag). For atomic hydrogen we have divided the column by noting the amount that resides in warm (T K) and cold (T K) gas.333The column of gas between 60 – 1000 K is quite small and is included in the warm column.
For the weakest shock ( , cm-3) the warm H I column is significant in comparison to the column of cold gas. However, the cold gas column dominates in all other cases. Although the warm gas column is not provided for O I and C II, similar results are seen for these atoms as well. Typically the warm column is few % or less of the column at any given extinction. In the case of CO and C I, these species only form when the gas has cooled.
Some general trends are seen in Table 4. First, the warm and cold H I column is lower for stronger shocks, while C I and CO columns increase with shock velocity/ram pressure. This is due to the faster chemical and physical timescales at the higher post-shock densities. In contrast because neutral oxygen and ionized carbon are the respective atomic reservoirs during much of the evolution, their column densities are relatively insensitive to shock strength, showing only a factor of variation at the highest extinction.
4.2.2 Atomic Carbon Fine-Structure Excitation
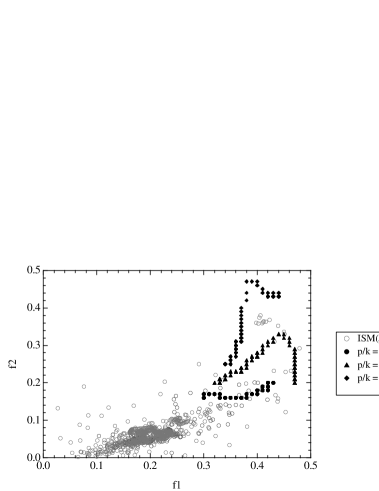
Jenkins & Tripp (2001, hereafter JT01) used UV absorption observations of atomic carbon multiplets to determine the relative populations in fine structure levels along numerous galactic lines of sight. Based on excitation ratios they find that the median pressure in the CNM is cm-3 K and that many lines of sight exceed this median value. In Figure 8 the grey points show the distribution of the 1st atomic carbon fine structure level fractional population (f1 = ) as a function of the 2nd (f2 = ). These numbers have been derived along numerous lines of sight in the ISM by JT01. The cluster of points between f1 = 0.12 – 0.25 and f2 = 0.0 – 0.1 show typical CNM ratios near the median pressure. Based on excitation analyses, clouds with f1 0.3 and f2 0.1 receive some contribution from over-pressurized gas (JT01).444 Absorption lines arising gas with these ratios typically have velocities outside those permitted by galactic rotation.
Jenkins & Tripp (2001) theorized that the pressure enhancements are the result of compression due to converging turbulent flows or warm boundary layers in the surfaces of dense clouds moving within a lower density medium. The predicted fine-structure excitation ratios from our models, which are of the shock creation of such over-pressurized gas, are also shown in Figure 8. We have selected three models, each with an initial density of cm-3 and shock velocities of 10, 20, and 50 , with corresponding to ram pressures of 1.4, 5.8, and 36 cm-3 K. The predicted ratios overlap with the “high” pressure gas seen by JT01, which demonstrates that high C I excitation ratios are an additional signature of the shock. Weaker shocks, which evolve on longer timescales, are likely to be more prevalent in the ISM and thus these shocks ( cm-3 K) appear more representative of observations. We did not model such weak shocks as they will not evolve on the timescales required for fast star formation (see §5.1). However, the excellent agreement of our models with the high excitation end of this distribution suggests that the JT01 results could indeed be the result of a distribution of weak and strong shocks active in the atomic medium throughout the galaxy.
5 Discussion
5.1 Molecular cloud formation by atomic flows
Our model calculations raise an obvious question: when should we consider that a “molecular cloud” has been formed? As shown in Figures 1 and 3, can form at considerably earlier times and lower column densities than CO, especially for low ram pressures/shock velocities. Thus low-pressure clouds could become molecular, in terms of the dominant constituent, before they become CO clouds. However, is difficult to detect, and is not usually a criterion for defining a molecular cloud. We consider the problem of detection in the next subsection; here we concentrate on the detection of CO.
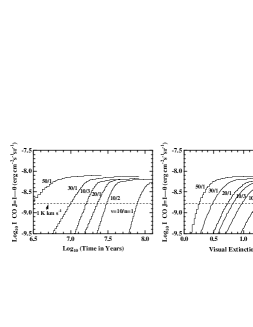
It is useful to distinguish between what we call the “accumulation” timescale, the length of time it takes to accumulate from the atomic gas and the cloud becomes “detectable” in CO, from other timescales, for instance the evolution of the CO abundance. For purposes of discussion we have made the somewhat arbitrary decision that the cloud appears when CO J=1–0 emission can be detected at a level of 1 K km/s – which defines the accumulation timescale.
In Figure 9 we provide the intensity of the J=1–0 transition of CO as a function of time with the dashed line denoting an integrated intensity of 1 K km/s. Based on this definition, the cloud accumulation timescale ranges from yr for a 50 shock to yr for a 10 shock (both with an initial density of 1 cm-3). As noted before, we find that the column density or extinction is the most important parameter in determining the formation of CO. Based on the right-hand panel of Figure 9, the above definition is roughly equivalent to molecular cloud “formation” at mag for ram pressures between cm-3 K.555We have assumed that the post-shock gas is not exposed to enhanced radiation fields during any time of this evolution. If the shock front passes close to a massive star than the evolution will be slowed and the AV threshold will increase by an amount of . Here we list the UV enhancement factor G0 as a function of time to denote the fact that effects of radiation will diminish as the shock front moves away from the star.
The above threshold of mag is based on a 1-dimensional calculation and it is useful to discuss how this might change in a more realistic 3-dimensional geometry. Chemically the transition from CII/CI/CO will be seen at a level where the CO photodissociation becomes ineffective. In 1-D this threshold is found at 0.7 mag with little contribution from self-shielding. In a three-dimensional calculation for a clumpy cloud, there will be two, competing, effects: first, UV radiation will propagate more freely into the cloud; and second, clumping may increase the local column densities and thus promote the transition to molecular gas. Our 1-D requirement of would thus translate into an average over solid angle of the extinction of the diffuse ultraviolet radiation field. The time to reach this threshold is no longer a simple calculation of the product, though we expect that the transition to molecular gas will occur roughly when the average density/column density reaches values comparable to those in our calculations.
We also note that in addition to clumping, overall contraction of the cloud in the direction perpendicular to the shock front will promote rapid molecular gas formation by increasing the density and the shielding. Recent numerical simulations of finite self-gravitating sheets (Burkert, A., & Hartmann, L. 2004, in preparation) suggest that global gravitational collapse of flattened clouds is likely and rapid.
In HBB01 we showed that the stellar population ages of nearby molecular clouds imply cloud lifetimes of no more than about 3-5 Myr. Generally, slightly older associations are not immediately next to current sites of star formation, indicating that molecular material is not simply being pushed around but that there is some cycling between the atomic and molecular states. The ratio of atomic to molecular gas in the solar neighborhood is estimated to be (Savage et al., 1977; Dame, 1993). This implies that the timescale for turning atomic gas into molecular material, on average, is about Myr. (If only a fraction of the atomic gas cycles through molecular stages, the timescale for the conversion of atomic to molecular gas in specified regions must be shorter.) In our terminology the cloud accumulation timescale must therefore be 20 Myr; the cloud lifetime would then be defined by the time from when a cloud is detectable in CO emission until the gas is dissipated by star formation.
Thus, the one-dimensional constraint on the accumulation timescale timescale implied by the ratio of atomic to molecular gas, coupled with the requirement that for CO formation, constrains the possible average pre-shock parameters,
| (5) |
Can this constraint reasonably be satisfied? The one-dimensional rms turbulent velocity of cold H I in the local interstellar medium is (Boulares & Cox 1990); thus it seems reasonable to take a typical shock velocity . Accumulation timescales of 10-20 Myr then require typical pre-shock densities . This is a few times larger than the average density of the ISM, but it would not be particularly surprising if molecular clouds were preferentially formed from initially slightly higher densities. Moreover, it has been increasingly accepted that the density fluctuations in the ISM (clouds) are produced primarily by compressions due to a supersonic turbulent velocity field (Von Weiszacker 1951; Sasao 1973; Elmegreen 1993; Padoan 1995; Ballesteros-Paredes, Vázquez-Semadeni & Scalo 1999). In such an environment, the production of the density fluctuations are likely the result of a succession of compression events, so that denser structures are formed by compressions within previously compressed, larger ones, rather than a single, very strong one (Vázquez-Semadeni 1994). This scenario naturally explains the density probability density function observed in numerical simulations of isothermal and polytropic flows (Passot & Vázquez-Semadeni, 1998), and here it naturally provides the necessary conditions (2–4 cm-3) for the pre-shock gas in our calculations. As already pointed out, ram pressure is the most important parameter for CO formation; the ram pressures for the above parameters are a few times the average turbulent gas pressure (gas plus magnetic plus cosmic rays) in the ISM (Boulares & Cox 1990); again, this does not seem to be an unreasonable constraint for making the highest density regions in the solar neighborhood.
Once the shielding column density is achieved, CO formation is rapid. Additional increases in density due to subsidiary shocks and/or gravitational contraction will yield to even more rapid CO formation. At a column density corresponding to , comparable to the shielding length estimated here, the characteristic growth time for gravitational contraction in (subsonic) gas at K is of the order of 1 Myr. Thus, once molecular gas is formed, star formation can ensue rapidly, at least in regions where supersonic turbulence has been dissipated (HBB01).
We conclude that our results are consistent with the picture presented in HBB01 of rapid formation of molecular clouds from atomic material, as long as the starting densities are typically a few times the average interstellar density.
5.2 Molecular Hydrogen in the Atomic Medium
Here we consider whether the presence of some molecular hydrogen in the pre-shock gas would shorten either the accumulation timescale or the timescale for CO abundances to rise. Indeed, because H2 does not emit for typical conditions in the atomic CNM it might be possible to hide a significant molecular component.
To examine this question we have examined solutions with a substantial H2 fraction in the pre-shock gas. This is only performed using the Molecular model because the Atomic model does not include chemical processes linked to H2. One limitation is that the cooling via H2 emission and shock dissociation of H2 are not included. However, the addition of H2 cooling will only shorten the cooling time to reach the stable plateau solution. As we will show below, the chemical evolution (i.e. CO formation) is dominated by the shielding timescale which depends primarily on the initial shock parameters.
In Figure 10 we present the H2 and CO abundances as a function of time and extinction in our standard model with an initial H2 fraction of 0.0, 0.125, and 0.25. The sharp rise of the H2 abundance at t = 106 yr is due to the non-inclusion of H2 in the Atomic model. At this time the abundance of CO shows a sharp spike which is due to rapid CO formation from the pre-existing H2. However, CO molecules are quickly dissociated, due to the lack of UV shielding. What is striking in these plots is that even an a priori presence of H2 molecules – a necessary requirement for CO formation – has little effect on the CO chemical evolution. This effect is discussed in §3, because the CO formation requires dust shielding the evolution cannot proceed until sufficient dust column exists.
This result is robust provided the pre-shock gas is exposed to the ISRF with A mag. In Figure 11 we present solutions with higher initial extinction and an initial H2 fraction of . The left-hand panels show the evolution of the CO concentration, while the right-hand panels present the CO J=1–0 emission, which we have used to define the cloud accumulation timescale ( = time where emission reaches a level of 1 K ). With this definition even pre-shock gas with A mag will only accumulate on timescales a factor of two shorter than the model starting with unshielded gas. Moreover the differences in the emitted J=1–0 intensity between these solutions are negligible unless mag. In sum, the presence of H2 in the pre-shock gas would not hasten the timescales for cloud formation, unless the gas is already significantly shielded from UV radiation and CO is already effectively in existence.
Let us now place these results in an observational context. Allen and co-workers have argued for a pervasive molecular component on the basic of the relative placement of dust lanes, radio continuum, and H I emission in external spiral galaxies (Allen, Knapen, Bohlin, & Stecher, 1997; Tilanus & Allen, 1989; Allen, Atherton, & Tilanus, 1986). In the standard picture of cloud formation H I emission would appear in front of the spiral shock wave as traced by the radio continuum emission. Instead these authors found that the H I emission is observed downstream of the shock, which is interpreted as the result of photodissociation of H2 by young stars. This led Pringle, Allen, & Lubow (2001) to theorize that there may be a significant reservoir of molecular gas in the low density CNM which would allow for fast cloud and star formation. They argue that this inter-arm gas could be hidden by having the temperature colder than 10 K, producing only weak CO emission.
However, these results must be placed in the context of studies of H2 in absorption and CO in emission in our own galaxy. The most extensive initial study of H2 in absorption was performed by the Copernicus satellite and Savage et al. (1977) found that the average H2 fraction within 500 pc of the Sun is . More recent FUSE observations have demonstrated that H2 absorption is pervasive, even in sight lines well out of the galactic plane towards background extragalactic sources (Shull et al., 2000). In addition, an analysis of X-ray absorption spectra along similar lines of sight by Arabadjis & Bregman (1999) finds that the required X-ray absorption column exceeds the H I column estimated by 21 cm emission. This excess is difficult to account for via other atomic components, but could be due to molecular gas. The UV and X-ray observations point to the potential ubiquitous presence of H2 in the galaxy with fractions of H2 towards these high galactic latitude lines of sight ranging from 10% (Shull et al., 2000) to % (Arabadjis & Bregman, 1999) of the H2 fraction estimated in the local solar neighborhood.
While there is important evidence for the presence of some H2 in the low density CNM, the evidence for CO is less substantial. For instance, the surface density of molecular gas estimated by CO emission towards high galactic latitudes is only 1% of the value derived in the local neighborhood. This is well below that seen for the H2 fraction and hints that CO may not be fully tracing H2 in the low density ISM. This is not terribly surprising, because the column density needed for equivalent CO self-shielding is three orders of magnitude larger than that needed for H2 formation (Lee et al. 1996; Draine & Bertoldi 1996).
Given the possibility of a significant present of H2 in the ISM one might question whether significant reservoir of H2 molecular clouds exist that are “inert” in the sense that they will never create CO. There are two possibilities that can be examined in this regard. First the Jenkins & Tripp (2001) results suggest an abundance of weak shocks are active in the galactic ISM. These shocks will evolve on slow times for the creation of both H2 and CO. Thus in the Myr required to make H2 there is an additional Myr before CO creation (see Fig. 3). For such a weak shock there will be a significant amount of time spent in the molecular but pre-CO phase. The overall lifetime of such systems may be limited by the large distance that would be transversed. For example, a 5 km s-1 shock will travel a distance 500 pc and therefore has an increased likelihood of passing by a massive star that will certainly destroy the CO and perhaps H2. An alternate picture would emerge if the shock evolution were limited in some fashion (perhaps by a strong tangential B-field). This will halt the density evolution but column will continue to build up behind the shock. Thus, the combination of ensuing extinction evolution, H2 molecules, and cosmic ray ionization eventually leads to CO formation. However, if the density evolution were stunted at a values below cm-3 then the H2 phase would last longer in a similar fashion as the weak shock case. However, the importance of such inert clouds might be limited by passing hot stellar wind or supernova bubbles which could disrupt or evaporate them. In sum we cannot discount the possibility that there might be a hidden reservior of H2 molecular gas in the ISM.
In this picture with ubiquitous H2, and little CO, cloud formation timescales will depend primarily on the timescale to accumulate a sufficient shielding column density, not the H2 formation time. Hence the solution is similar to that found in the traditional case where cloud formation is modeled from the atomic-molecular hydrogen transition.
5.3 Numerical Models of ISM Dynamical Evolution
Complex MHD numerical simulations of structure formation in the ISM, such as those performed by Ostriker, Stone, & Gammie (2001); Ballesteros-Paredes, Hartmann, & Vázquez-Semadeni (1999); Mac Low et al. (1998), typically neglect the chemical considerations when computing the evolution. This is easily understood given the extreme computational complexities. In our simulations we have included the chemistry but with a simpler dynamical prescription. In this process we have identified two areas where this work can have useful impact on numerical simulations of cloud formation and evolution.
Our results point to the key importance of the shielding of UV photons in the overall physical evolution. In Figure 12 we show the temperature evolution as a function of the mass surface density (visual extinction). The initial spikes below 1 g cm-2 are the shock and initial cool down. The following evolution shows the gradual temperature cool down as the shielding column increases. For all shocks the gas temperature, at a given surface density, is nearly identical, to within a factor of , and declines in a linear fashion in all cases except for the strongest shock. This difference is due to the lack of atomic carbon cooling which typically contributes to the cooling at A 1 (in the fast shock quick CO formation via self-shielding reduces the influence of C I). The similarities of these solutions and the linear decay suggests that tracking the shielding in each cube of a MHD simulation can be used to provide a simple estimate of the gas temperature and hence pressure.
Another potential aid to MHD simulations is provided in the appendix where we show that there exists an analytical solution for the time-dependence of H2 formation (CO formation can be treated via equilibrium calculations). This analytical solution requires only knowledge of the local gas density and extinction. Under those conditions computationally intensive chemical calculations need not be performed, while still keeping the capability to create a realistic simulation that includes the chemical formation of the two most important molecular species: H2 and CO. If this can adapted into MHD models then it provides a method to use simulations to predict maps of molecular emission, which can be readily compared to observations.
6 Conclusions
We have presented a detailed coupled physical and chemical model that examines the shock compression of atomic gas and the slow transition to molecular form. This model includes all of the physical and chemical processes relevant to investigate the formation of molecular clouds via shocks induced by cloud-cloud collisions, spiral density waves, or supernovae within the dynamic interstellar medium. Our principle results are as follows:
1) We find that the molecular cloud formation timescale is not controlled by the formation rate of H2 on grains. Rather the shielding of molecules from the UV radiation is the limiting parameter. For all but the weakest shocks we find that H2 self-shields quite efficiently. However, CO formation requires shielding of the interstellar radiation by dust grains. Thus the cloud formation timescale is effectively set by the time needed to accumulate a column equivalent to A mag in extinction.
2) Molecular cloud formation times can be as short as Myr, as required by our picture of rapid cloud formation from large scale flows, adopting typical velocities in the ISM () for starting densities and ram pressures a few times higher than average interstellar values.
3) Since shielding is required for CO formation the a priori presence of H2 in the low density medium will not appreciably shorten the time required to create molecular clouds.
4) We provide detailed predictions of the atomic and molecular emission and absorption that trace the formation of molecular clouds. A subset of these predictions match current conditions observed in over-pressurized gas within the cold neutral medium of the galaxy by Jenkins & Tripp (2001).
5) A by-product of this work is an examination of ways to incorporate the effects of chemistry into detailed MHD simulations of structure formation in the galaxy. This includes an analytic solution for the time-dependent formation of molecular hydrogen and a discussion of the overall temperature structure of dense cooling proto-clouds.
Appendix A Time Dependent Analytical Solution for H2 Formation
For more complex applications it is useful to have an analytical approximation to time dependence of the formation of , following a shock in the low density gas. A reasonable approximation can be derived through the differential equation that describes the evolution:
| () |
Here is the total density, is the temperature, is the temperature dependent grain formation rate of H2 in cm3 s-1, the H2 cosmic ray ionization rate, and the H2 photodissociation rate, which is a function of the visual extinction and the total H2 column density. In equilibrium (H2)/ and (H)/(H2) = ( + )/.
Using the relation between the total density with hydrogen atoms and molecules ((H) + 2(H2) = ) Eqn. (A1) can be rewritten:
| () |
If we set and then
| () |
Strictly speaking the total density, H2 formation rate (temperature dependent), H2 photorate (through the column density build up) have time-dependencies. However, after the shock the evolution quickly converges to a roughly constant plateau in density and temperature, which is essentially the Wolfire et al. (1995) solution for non-shielded ISM gas. This plateau in the physical evolution persists until shielding decreases the photo-electric heating rate and allows CO formation. This ultimately lowers the temperature and raises the density by factors of 2–3. Thus, for a given shock pressure, the density and temperature can be approximated using values from the non-shielded “Wolfire” solution (here: , ). The H2 photo-rate can be treated in a different fashion, by discretizing Eqn. (A3) and lagging the build-up of the H2 column (and the determination of the photo-rate) behind the H2 density solution. In this fashion the H2 photodissociation rate from the previous step is used in the current one. These approximations both result in some loss in accuracy, but as will be shown below the difference between the analytical and exact treatments is not large. With these assumptions, Eqn. (A3) can therefore be solved,
| () |
where is a constant. Using the = 0 boundary condition ((H 0), the constant can be determined and, . Substituting back, 2/ + 1/ + 1/ and :
| () |
In this expression is the depletion timescale, is the cosmic ray ionization timescale, and is the timescale for photodissociation including self-shielding and dust shielding.
This expression can be used to derive a reasonable estimate of the H2 evolution, with knowledge of the H2 photodissociation rate. Using the approximation of Draine & Bertoldi (1996), two factors are required to estimate the H2 photo-dissociation timescale: (1) the dust extinction at 1000Å and (2) the H2 column density. (1) The extinction can be estimated though the mass conservation equation as described in §2.1, using , where cm2 ( and are the initial pre-shock density and velocity, and is the dust opacity at 1000 Å). In simulations the identification of a shock may not be straightforward. The most important quantity is the tracking of the average 2-D/3-D total column, which can be converted to the opacity using . (2) As discussed above, the H2 column density can be approximated through the buildup of the column behind the shock.
Figure 13 (left) shows the fraction of H2 as a function of time for the exact solution for the 15 km s-1 shock model along with the analytical solution. We also show for comparison, the exact treatment of a limiting case where the H2 is fully shielded from the start. Here the analytical solution assumes cm-3 and K, which is the evolutionary plateau for the 15 km s-1 shock with a pre-shock density of 1 cm-3. In this figure the analytical solution lies between the exact solution and the fully shielded calculation. However, the agreement between the analytical and exact treatments is within a factor of two for relevant timescales. The analytical model over-predicts the amount of H2, because the calculation cannot mirror the full treatment of the density and temperature evolution, which leads to increased H2 self-shielding. In the above example, the density at the early stages of the full treatment is 1400 cm-3, thus the analytical example will over-predict the early creation of H2. In Figure 13 (right) this effect is demonstrated by presenting the derived H2 column density in the analytical model compared to the exact calculation for the 15 km s-1 shock.
The nature of analytical solution will change depending on the initial conditions (shock velocity, pre-shock density). Appropriate values of and for different solutions can be easily obtained from the “plateau” in Figure 2. However, in practice only knowledge of the local density and extinction/shielding need be identified (gas temperature will track with extinction). With these few parameters one can reliably solve for the formation of molecular hydrogen. In the case of CO its formation requires the tracking of only dust shielding and could be computed via simple equilibrium calculations.
References
- Aikawa & Herbst (1999) Aikawa, Y. & Herbst, E. 1999, A&A, 351, 233
- Allen, Knapen, Bohlin, & Stecher (1997) Allen, R. J., Knapen, J. H., Bohlin, R., & Stecher, T. P. 1997, ApJ, 487, 171
- Allen, Atherton, & Tilanus (1986) Allen, R. J., Atherton, P. D., & Tilanus, R. P. J. 1986, Nature, 319, 296 171
- Arabadjis & Bregman (1999) Arabadjis, J. S. & Bregman, J. N. 1999, ApJ, 510, 806
- Ballesteros-Paredes (2004) Ballesteros-Paredes, J. 2004a. ”Molecular Clouds. Formation and Disruption”, in ”From Observations to Self-Consistent Modeling of the Interstellar Medium”, eds. M. Avillez & D. Breitschwerdt. Kluwer Academic Publishers (in press)
- Ballesteros-Paredes, Hartmann, & Vázquez-Semadeni (1999) Ballesteros-Paredes, J., Hartmann, L., & Vázquez-Semadeni, E. 1999, ApJ, 527, 285 (BHV)
- Ballesteros-Paredes, Vázquez-Semadeni, & Scalo (1999) Ballesteros-Paredes, J., Vázquez-Semadeni, E., & Scalo, J. 1999, ApJ, 515, 286
- Baluja & Zeippen (1988) Baluja, K. L. & Zeippen, C. J. 1988, Journal of Physics B Atomic Molecular Physics, 21, 1455
- Bergin, Neufeld, & Melnick (1998) Bergin, E. A., Neufeld, D. A., & Melnick, G. J. 1998, ApJ, 499, 777
- Bergin & Langer (1997) Bergin, E. A. & Langer, W. D. 1997, ApJ, 486, 316
- Boulares & Cox (1990) Boulares, A., & Cox, D.P. 1990, ApJ, 365, 544
- Brown, de Geus, & de Zeeuw (1994) Brown, A.G.A., de Geus, E.J., & de Zeeuw, P.T. 1994, A&A, 289, 101
- Brown, Byrne, & Hindmarsh (1989) Brown, P.N., Byrne, G.D, & Hindmarsh, A.C. 1989, SIAM J. Sci. Stat. Comput., 10
- Cazaux & Tielens (2002) Cazaux, S. & Tielens, A. G. G. M. 2002, ApJ, 575, L29
- Cazaux & Tielens (2004) Cazaux, S. & Tielens, A. G. G. M. 2004, ApJ, 606, 222
- Cox (1972) Cox, D. P. 1972, ApJ, 178, 143
- Cox & Raymond (1985) Cox, D. P. & Raymond, J. C. 1985, ApJ, 298, 651
- Dame (1993) Dame, T. M. 1993, AIP Conf. Proc. 278: Back to the Galaxy, eds. S.S. Holt & F. Verter, 267
- Draine (1978) Draine, B. T. 1978, ApJS, 36, 595
- Draine & Bertoldi (1996) Draine, B. T. & Bertoldi, F. 1996, ApJ, 468, 269
- Elmegreen (1991) Elmegreen, B. G. 1991, NATO ASIC 342, The Physics of Star Formation and Early Stellar Evolution, eds. C.J. Lada & N.J. Kylafis (Dordrecht: Kluwer), 35
- Elmegreen (1993) Elmegreen, B.G. 1993, in Protostars and Planets III, ed. E.H. Levy & J.I. Lunine, University of Arizona Press, Tucson, 97
- Elmegreen & Scalo (2004) Elmegreen, B.G. & Scalo, J. 2004, ARAA, 42, in press
- Gibson, Taylor, Higgs, & Dewdney (2000) Gibson, S. J., Taylor, A. R., Higgs, L. A., & Dewdney, P. E. 2000, ApJ, 540, 851
- Goldsmith (2001) Goldsmith, P. F. 2001, ApJ, 557, 736
- Haffner, Reynolds, & Tufte (1999) Haffner, L. M., Reynolds, R. J., & Tufte, S. L. 1999, ApJ, 523, 223
- Hartigan, Morse, & Raymond (1994) Hartigan, P., Morse, J. A., & Raymond, J. 1994, ApJ, 436, 125
- Hartmann, Ballesteros-Paredes, & Bergin (2001) Hartmann, L., Ballesteros-Paredes, J., & Bergin, E. A. 2001, ApJ, 562, 852
- Hayes & Nussbaumer (1984) Hayes, M. A. & Nussbaumer, H. 1984, A&A, 134, 193
- Heiles & Troland (2003) Heiles, C. & Troland, T. H. 2003, ApJ, 586, 1067
- Hollenbach & McKee (1979) Hollenbach, D. & McKee, C. F. 1979, ApJS, 41, 555
- Hollenbach, Werner, & Salpeter (1971) Hollenbach, D. J., Werner, M. W., & Salpeter, E. E. 1971, ApJ, 163, 165
- Jenkins & Tripp (2001) Jenkins, E. B. & Tripp, T. M. 2001, ApJS, 137, 297
- Jura (1975) Jura, M. 1975, ApJ, 197, 575
- Kaufman et al. (1999) Kaufman, M. J., Wolfire, M. G., Hollenbach, D. J., & Luhman, M. L. 1999, ApJ, 527, 795
- Knee & Brunt (2001) Knee, L. B. G. & Brunt, C. M. 2001, Nature, 412, 308
- Koyama & Inutsuka (2000) Koyama, H. & Inutsuka, S. 2000, ApJ, 532, 980
- Kulkarni & Heiles (1987) Kulkarni, S. R. & Heiles, C. 1987, ASSL Vol. 134: Interstellar Processes, 87
- Launay & Roueff (1977) Launay, J. M. & Roueff, E. 1977, A&A, 56, 289
- Lee et al. (1996) Lee, H.-H., Herbst, E., Pineau des Forets, G., Roueff, E., & Le Bourlot, J. 1996, A&A, 311, 690
- Leitch-Devlin & Williams (1985) Leitch-Devlin, M. A. & Williams, D. A. 1985, MNRAS, 213, 295
- Li & Goldsmith (2003) Li, D. & Goldsmith, P. F. 2003, ApJ, 585, 823
- Mac Low & Klessen (2004) Mac Low, M. & Klessen, R. S. 2004, Reviews of Modern Physics, 76, 125
- Mac Low et al. (1998) Mac Low, M.-M., Klessen, R. S., Burkert, A., & Smith, M. D. 1998, Phys. Rev. Lett., 80, 275
- McCray & Kafatos (1987) McCray, R. & Kafatos, M. 1987, ApJ, 317, 190
- Millar, Farquhar, & Willacy (1997) Millar, T. J., Farquhar, P. R. A. & Willacy, K. 1997, A&AS, 121, 139
- Minter & Spangler (1997) Minter, A. H. & Spangler, S. R. 1997, ApJ, 485, 182
- Nagai, Inutsuka, & Miyama (1998) Nagai, T., Inutsuka, S., & Miyama, S.M. 1998, ApJ, 506, 306
- Neufeld, Lepp, & Melnick (1995) Neufeld, D. A., Lepp, S., & Melnick, G. J. 1995, ApJS, 100, 132
- Neufeld & Kaufman (1993) Neufeld, D. A. & Kaufman, M. J. 1993, ApJ, 418, 263
- Neufeld & Dalgarno (1989) Neufeld, D. A. & Dalgarno, A. 1989, ApJ, 340, 869
- Nussbaumer & Storey (1981) Nussbaumer, H. & Storey, P. J. 1981, A&A, 96, 91
- Ostriker, Stone, & Gammie (2001) Ostriker, E. C., Stone, J. M., & Gammie, C. F. 2001, ApJ, 546, 980
- Padoan & Nordlund (1999) Padoan, P. & Nordlund, Å. 1999, ApJ, 526, 279
- Padoan (1995) Padoan, P. 1995, MNRAS, 277, 377
- Passot & Vázquez-Semadeni (1998) Passot, T. & Vázquez-Semadeni, E. 1998, Phys. Rev. E, 58, 4501
- Pavlovski, Smith, Mac Low, & Rosen (2002) Pavlovski, G., Smith, M. D., Mac Low, M., & Rosen, A. 2002, MNRAS, 337, 477
- Pequignot (1996) Pequignot, D. 1996, A&A, 313, 1026
- Pequignot (1990) Pequignot, D. 1990, A&A, 231, 499
- Pringle, Allen, & Lubow (2001) Pringle, J. E., Allen, R. J., & Lubow, S. H. 2001, MNRAS, 327, 663
- Reach et al. (1995) Reach, W. T. et al. 1995, ApJ, 451, 188
- Raymond (1979) Raymond, J. C. 1979, ApJS, 39, 1
- Roberge, Jones, Lepp, & Dalgarno (1991) Roberge, W. G., Jones, D., Lepp, S., & Dalgarno, A. 1991, ApJS, 77, 287
- Roberts & Stewart (1987) Roberts, W. W. & Stewart, G. R. 1987, ApJ, 314, 10
- Sasao (1973) Sasao, T. 1973, PASJ, 25, 1
- Savage, Cardelli, & Sofia (1992) Savage, B. D., Cardelli, J. A., & Sofia, U. J. 1992, ApJ, 401, 706
- Savage et al. (1977) Savage, B. D., Drake, J. F., Budich, W., & Bohlin, R. C. 1977, ApJ, 216, 291
- Schneider & Elmegreen (1979) Schneider, S. & Elmegreen, B. G. 1979, ApJS, 41, 87
- Schroder et al. (1991) Schroder, K., Staemmler, V., Smith, M. D., Flower, D. R., & Jaquet, R. 1991, Journal of Physics B Atomic Molecular Physics, 24, 2487
- Shull (1993) Shull, J.M. 1993, in Massive Stars: Their Lives in the Interstellar Medium, eds. J.P. Cassinelli & E.B. Churchwell, ASP Conf. Ser. 35, 327
- Shu et al. (1972) Shu, F. H., Milione, V., Gebel, W., Yuan, C., Goldsmith, D. W., & Roberts, W. W. 1972, ApJ, 173, 557
- Shull et al. (2000) Shull, J. M. et al. 2000, ApJ, 538, L73
- Sofia, Cardelli, & Savage (1994) Sofia, U. J., Cardelli, J. A., & Savage, B. D. 1994, ApJ, 430, 650
- Spitzer (1978) Spitzer, L. 1978, New York Wiley-Interscience, 1978
- Stone et al. (1998) Stone, J. M., Ostriker, E. C., & Gammie, C. F. 1998, ApJ, 508, L99
- Tielens & Hollenbach (1985) Tielens, A. G. G. M. & Hollenbach, D. 1985, ApJ, 291, 722
- Tilanus & Allen (1989) Tilanus, R. P. J. & Allen, R. J. 1989, ApJ, 339, L57
- Vázquez-Semadeni (1994) Vázquez-Semadeni, E. 1994, ApJ, 423, 681
- Vishniac (1994) Vishniac, E. 1994, ApJ, 428, 186
- VonWeiczacker (1951) VonWeiczacker, C. F. 1951. ApJ, 114, 165
- Weaver et al. (1977) Weaver, R., McCray, R., Castor, J., Shapiro, P., & Moore, R. 1977, ApJ, 218, 377
- Wolfire et al. (1995) Wolfire, M. G., Hollenbach, D., McKee, C. F., Tielens, A. G. G. M., & Bakes, E. L. O. 1995, ApJ, 443, 152
| Species | log() +12.00 |
|---|---|
| He | 10.93 |
| C | 8.11 |
| N | 7.96 |
| O | 8.43 |
| Ne | 7.92 |
| Mg | 5.97 |
| Si | 6.29 |
| S | 7.20 |
| Ar | 6.42 |
| Ca | 2.60 |
| Fe | 5.33 |
| Ni | 3.56 |
| Process | Notes | Reference |
|---|---|---|
| Photoelectric heating | ||
| FUV field | Drain field; G0 = 1.7 in units of Habing field | (1) |
| Heating rate | Formalism of Bakes and Tielens (1994) | |
| Attenuation by dust | Heating rate attenuated by e; average attenuation | (2) |
| of UV field by dust between 1000 Å – 2000 Å | ||
| Cosmic Ray | ||
| H ionization rate | s-1 | (3) |
| H2 ionization rate | ||
| Heating | erg cm-3 s-1 | (4) |
| X-Ray | ||
| Ionization and heating | Expressions provided by Wolfire et al (1995); N; | |
| ne from chemical equilibrium calculation | ||
| Molecular Hydrogen | ||
| Formation rate | T s-1; | (5) |
| Formation heating | Formalism of Hollenbach & McKee (1979); except only | |
| 4% of formation energy is deposited on grain surface | ||
| (Takahashi et al 2001) | ||
| Self-shielding rate | Formalism of Draine & Bertoldi (1996) | |
| Carbon Monoxide | ||
| Self-shielding rate | Formalism of Lee et al. (1996) | |
| Cooling | ||
| C II | Impacts with e-, H, H2; | (6) |
| 157.7 m | A( s-1 | (7) |
| O I | Impacts with e-, H, H2, H+; | (8) |
| 145.6 m | A( s-1 | (9) |
| 63.2 m | A( s-1 | |
| 44.0 m | A( s-1 | |
| C I | Impacts with H,H2 | (10) |
| 610 m | A( s-1 | (11) |
| 370 m | A( s-1 | |
| 980 m | A( s-1 | |
| H+ | (2/3)k(T/300)-0.75Tn erg s-1 H-1 | |
| CO | rotational transitions, collisions with H2 | (12) |
| H2 | not included due to low temperatures at time of formation |
Note. — References: (1) Draine 1978; (2) Roberge et al 1991; (3) Millar, Farquhar, & Willacy 1997; (4) Goldsmith 2001; (5) Hollenbach, Werner, & Salpeter 1971, Leitch-Devlin & Williams 1985; (6) Hayes & Nussbaumer 1984, Launay & Roueff 1977, Hollenbach & McKee 1979; (7) Nussbaumer & Storey 1981; (8) Pequignot 1990,1996, Hollenbach & McKee 1979; (9) Baluja & Zeippen 1988; (10) Launay & Roueff 1977, Schröder et al 1991; (11) Tielens & Hollenbach 1985; (12) Neufeld, Lepp, & Melnick (1995), Neufeld & Kaufman (1993)
| Line | 10 | 15 | 20 | 30 | 50 |
|---|---|---|---|---|---|
| H | |||||
| H | |||||
| 6300 | |||||
| 6723 |
| Model | Hot H IbbColumn density of H I with T 60 K. | Cold H IccColumn density of H I with T 60 K. | O I | C II | |||||||||
|---|---|---|---|---|---|---|---|---|---|---|---|---|---|
| vs/nHddUnits of is km s-1 and is cm. | A | A | A | A | A | A | A | A | A | ||||
| 10/1 | 20.4 | 20.2 | 20.8 | 20.9 | 17.0 | 17.4 | 17.8 | 16.7 | 17.1 | 17.4 | |||
| 10/2 | 19.7 | 20.5 | 20.8 | 20.9 | 17.0 | 17.4 | 17.8 | 16.7 | 17.1 | 17.4 | |||
| 10/3 | 19.6 | 20.5 | 20.8 | 20.8 | 17.0 | 17.3 | 17.7 | 16.7 | 17.0 | 17.3 | |||
| 20/1 | 19.8 | 20.2 | 20.6 | 20.6 | 17.0 | 17.5 | 17.7 | 16.7 | 17.0 | 17.3 | |||
| 30/1 | 19.4 | 20.3 | 20.4 | 20.5 | 17.0 | 17.5 | 17.7 | 16.7 | 17.0 | 17.3 | |||
| 50/1 | 18.9 | 20.0 | 20.2 | 20.2 | 17.0 | 17.3 | 17.6 | 16.7 | 17.0 | 17.0 | |||
| C I | CO | ||||||||||||
| A | A | A | A | A | A | ||||||||
| 10/1 | 13.9 | 15.0 | 15.9 | 8.5 | 12.5 | 14.3 | |||||||
| 10/2 | 14.6 | 15.3 | 16.3 | 11.7 | 13.5 | 15.3 | |||||||
| 10/3 | 14.8 | 15.6 | 16.5 | 12.0 | 13.9 | 15.7 | |||||||
| 20/1 | 14.9 | 15.7 | 16.5 | 12.7 | 14.3 | 16.0 | |||||||
| 30/1 | 15.3 | 16.0 | 16.5 | 13.9 | 15.0 | 16.7 | |||||||
| 50/1 | 15.8 | 16.3 | 16.3 | 14.0 | 16.3 | 17.0 | |||||||