On-axis spectroscopy of the radio-loud quasar HE 14341600: an elliptical host with a highly ionized ISM ††thanks: Based on observations made with the ESO Very Large Telescope ANTU/UT1 at ESO-Paranal observatory, Chile (program 65.P-0361(A)).
VLT on-axis optical spectroscopy of the radio-loud quasar HE 14341600 is presented. The spatially resolved spectra of the host galaxy are deconvolved and separated from those of the central quasar in order to study the dynamics of the stars and gas as well as the physical conditions of the ISM. We find that the host of HE 14341600 is an elliptical galaxy that resides in a group of at least 5 member galaxies, and that most likely experienced a recent collision with its nearest companion. Compared with other quasar host galaxies, HE 14341600 has a highly ionized ISM. The ionization state corresponds to that of typical Seyferts, but the ionized regions are not distributed in a homogeneous way around the QSO, and are located preferentially several kiloparsecs away from it. While the stellar absorption lines do not show any significant velocity field, the gas emission lines do. The observed gas velocity field is hard to reconcile with dynamical models involving rotating disk, modified Hubble laws or power laws, that all require extreme central masses ( M⊙) to provide only poor fit to the data. Power law models, which best fit the data, provide a total mass of 10 kpc M⊙. We conclude that the recent interaction between HE 14341600 and its closest companion has strongly affected the gas velocity and ionization state, from the center of the galaxy to its most external parts.
Key Words.:
Galaxies: dynamics, interaction, black holes – quasars: individual: HE 1434-1600, quasar host galaxies – techniques: image processing, deconvolution1 Introduction
Spectroscopy of quasar host galaxies, either with a long slit or through the use of integral field spectrographs now available on large telescopes, is able to provide unique clues on the stellar content, on the physics of the interstellar medium (ISM) and on the dynamics of these complex objects. Since their otherwise luminous active galactic nucleus (AGN) is extinguished by the central molecular torus, the radio galaxies can be rather easily studied, even in spectroscopy (e.g., Vernet et al. vernet01 (2001)). This is also true for Seyfert galaxies where the brightness of the central AGN is much lower than in genuine quasars. On the contrary, obtaining high quality spectra of the host of bright quasars remains a much more challenging task because of the high luminosity contrast between the central AGN and the host.
We have carried out a systematic spectroscopic campaign of the host galaxies of a sample of bright quasars, using the European Very Large Telescope (VLT), at Paranal observatory, Chile. The quasar sample is selected from the Hamburg-ESO Survey (HES; Wisotzki et al. wisotzki00 (2000)). It includes 20 intrinsically bright quasars with and . No prior morphological selection criteria have been applied to the sample. The full sample, for which optical and near-IR imaging is also available (Jahnke jahnke (2002); Jahnke et al. jahnke03 (2003, 2004)) will be fully described and analyzed in Letawe et al., in prep., while the deconvolution techniques used to decompose the data into two independent spectra of the unresolved central quasar and of the extended host galaxy are presented in Magain et al. (Magain (1998)) and Courbin et al. (Courbin_a (2000)). A first application of these techniques to the quasar HE 1503+0228 is presented in Courbin et al. (Courbin_b (2002)). It shows that the host of this quasar is a normal spiral galaxy with kpcM⊙ and with stellar populations typical of a normal spiral galaxy.
Some of the objects in our sample display peculiar features. HE 14341600, with and absolute magnitude of , stands indeed as a rather special case, which appeared to deserve further investigations. The peculiar velocity field, prominent emission lines and rich environment, led us to obtain more data for this radio-loud quasar than for the rest of the sample. The present paper describes the observations of what appears to be an elliptical galaxy that is probably experiencing a collision, and that shows a particularly strongly ionized Inter Stellar Medium (ISM).
All along this paper, the conversion of angular scales into linear distances is done using , and leading to a scale of 2.73 kpc per arcsecond at .
2 Imaging
2.1 Optical near-IR
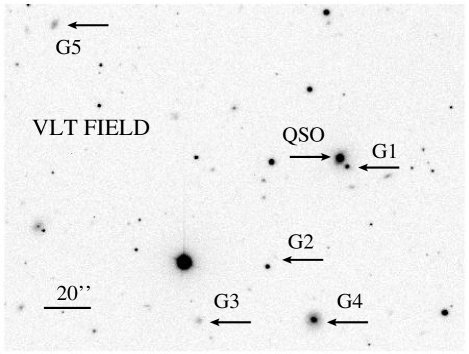
Optical, near-IR and radio images of HE 14341600 were available, in addition to the spectroscopic data. Two VLT -band images were taken prior to each spectroscopic observation in order to construct the slitlet mask. These images were obtained on the nights of April 11, 2000 (30 sec exposure, seeing 07) with FORS1 and on the night of May 13, 2002 (15 sec, seeing 11) with FORS2. Fig. 1 shows part of the FORS1 field of view. Additional images were obtained in the -band at the 1.54m Danish telescope at La Silla observatory and in the infrared -band with the ESO 3.5m New Technology Telescope (NTT) equipped with the instrument SOFI. The - and -band data are the same as used by Jahnke jahnke04 (2004). The technical details of the observations are given in Table 1.
| Instr. | Band | Date | scale | |
|---|---|---|---|---|
| VLT-FORS2 | 13-05-2002 | 0.252 | 15s | |
| VLT-FORS1 | 11-04-2000 | 0.200 | 30s | |
| NTT-SOFI | 24-02-1999 | 0.290 | 300s | |
| 1.54m-DFOSC | 14-04-1997 | 0.390 | 600s |

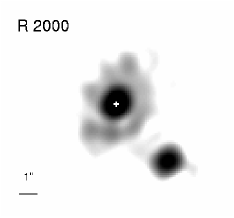
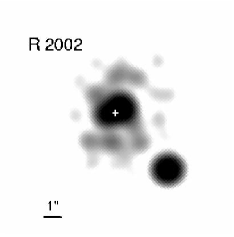
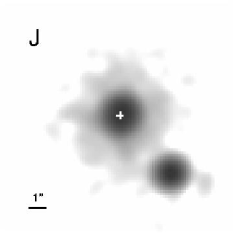
All images, except the low S/N -band image were deconvolved using the MCS algorithm (Magain, Courbin & Sohy Magain (1998)), in order to separate the quasar from its host galaxy and to reveal possible substructures that may help to explain the spectroscopic observations. The deconvolved host images all show extended and rather uniform emission (Fig. 2), with a significant bulge contribution. There are, however, some deviations to the smooth profile, 2–5″ away from the nucleus. These small scale substructures match well the ones seen in [O iii] in the spectroscopic observations (see Section 3).
A close companion, labeled G1 on Fig. 1, can be seen next to HE 14341600, located 4″ from the center, or 11 kpc. Its redshift (see Section 5) is the same as that of HE 14341600. A law fits well its 1D intensity profile, while an exponential disk does not. Moreover, its shape is that of an elliptical galaxy.
Photometry of the quasar host has been performed by Jahnke et al. (jahnke04 (2004)) in a multicolour study of QSO hosts. After masking of the close companion they were able to model the host of HE 14341600 with a pure spheroid light distribution. The measured magnitudes of the host are , , , and . They corrected for galactic extinction using the maps by Schlegel et al. (schlegel98 (1998)) and applied a K-correction term that was computed from a measured broad-band SED (spectral energy distribution). For that purpose, template SEDs were fitted to six photometric points in the optical and NIR and the template was used to derive a K-correction term (see Jahnke et al., jahnke04 (2004) for details). Including these corrections the colours of the host are , and , i.e. significantly bluer colours than expected for an inactive galaxy of this luminosity (Fukugita et al. 1995, Fioc & Rocca-Volmerange 1999). Modeling of the stellar populations points to either an overall young dominant stellar population of 1–2 Gyr, or may also be indicative of continuous star formation, plus a small fraction (1 % in mass) of a recent (e.g., 100 Myr) star burst population.
2.2 Radio map
A radio map of HE 14341600 has also been retrieved from the NRAO VLA Sky Survey (Condon et al. nvss (1998)), through the online NASA Extragalactic Database (NED). It shows large lobes extending up to 6′ or 980 kpc, North and South of the quasar (Fig. 3). With an integrated radio flux of 7.14 mJy at 1.4 GHz and a magnitude (quasar plus host), we estimate a radio loudness /, a value which places HE 14341600 at the limit between radio-loud and radio-quiet quasars (Kellermann kellermann (1989)). Such a radio structure has generally been found to be associated with extended optical emission lines for example in radio galaxies (e.g., Fosbury et al. fosb (1984)), Seyferts (Morganti et al. morganti (1998)) or in Radio Loud Quasars (RLQ) (Boroson et al. boroson84 (1984), boroson85 (1985); Stockton & MacKenty stock87 (1987)). We investigate in Section 4, the possibility that HE 14341600 is a radio loud quasar (although almost radio quiet) with jet induced ionization of the ISM.
3 Spectroscopy: observations and data reduction
Our first spectroscopic observations were obtained during the night of April 11, 2000, with the FOcal Reducer/low dispersion Spectrograph 1 (FORS1) mounted on the 8.2m VLT/UT1 ANTU, at ESO-Paranal. Since the aim of the project is to spatially deconvolve the spectra, the Multi-Object-Spectroscopy (MOS) mode was chosen in order to allow the simultaneous observation of the quasar and of neighbouring stars used to determine the Point Spread Function (PSF). The same approach was used in Courbin et al. (Courbin_b (2002)) in order to study the host of HE 1503+0228, at . Since 19 slitlets are available, we were also able to observe several galaxies in the vicinity of the quasar.
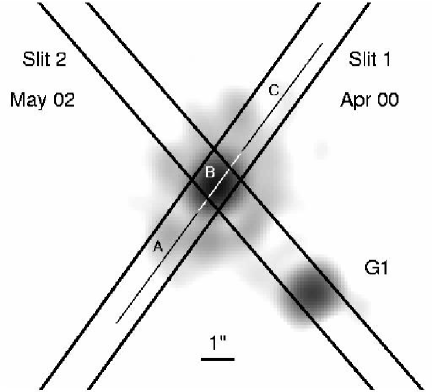


Three grisms were used (G600B, G600R, G600I), with a resolving power . The exposure time for each grism was 1200 seconds and the full spectrum covers the wavelength range between 3250 Å and 8000 Å in the rest frame. All basic reduction steps were made with the IRAF package, leading to flatfielded, flux calibrated and rebinned spectra with 02 per pixel in the spatial direction and 1 Å per pixel in the spectral direction. Since there is a significant slit curvature in some of the slitlets, a 2D wavelength calibration was performed, as well as a 2D sky subtraction. The seeing varied between 05 and 06. The slit orientation (PA) was 35∘ clockwise from north. We refer to these data as slit 1 all along the text and in Fig. 4.


Additional data were obtained with FORS2 at VLT/UT4 YEPUN, on the night of May 13, 2002, with the slit oriented to include both the quasar host and the companion galaxy G1. The PA of this slit is (slit 2 in Fig. 4). As for the FORS1 observations, the MOS configuration was chosen in order to observe several PSF stars. Only one grism was used, G600RI, covering the spectral range 4560–7310Å in the rest frame. A single exposure of 1500 seconds was taken. The reduction was carried out in the same way as for the FORS1 observations. However, in this case, the pixel scale is 1.5Å in the spectral direction and 0.252 in the spatial direction. The resolving power is the same as for FORS1, .
Figure 5 displays the intensity profiles of the (deconvolved) host galaxy of HE 14341600 in broad band, along the two slit positions, showing structures with a typical size of a few kpc. These structures are real and play in important role in the interpretation of the spectra, as they are prominent in the emission lines of the host.
The spectroscopic version of the MCS deconvolution algorithm was used to process the 2D spectra, in the same way as for HE 1503+0228 (Courbin et al. Courbin_b (2002)), leading to the decompositions displayed in Figs. 7 and 7. While the quasar spectra are very similar in both slits, the host shows much stronger and more spatially extended emission lines in slit 1 than in slit 2.
4 The ISM of the host
The ISM of the host of HE 14341600 is particularly highly ionized. The spectra extracted in Fig. 7, e.g., along slit 1 not only show prominent [O iii] emission lines, but also He ii, [Ne iii] and [Ne v] emissions. The ionization potentials of these species are respectively 54.6, 40.96 and 97.26 eV, i.e. 1.5 to 3 times higher than the already high ionization potential of [O iii] (35 eV). Line ratios measured at different locations along the slit can be used to understand the physical processes at work in the host of HE 14341600. We have measured them for all significant emission lines, relative to H, as is summarized in Table 2.
| Line | A | B | C | Slit 2 | |
|---|---|---|---|---|---|
| Ne v | (3346) | 0.26 | – | 0.15 | – |
| Ne v | (3426) | 0.64 | – | 0.57 | – |
| O ii | (3727) | 1.46 | 3.42 | 2.06 | – |
| Ne iii | (3869) | 0.94 | 1.47 | 0.86 | – |
| H | (3889) | 0.12 | – | 0.21 | – |
| Ne iii | (3967) | 0.44 | – | 0.34 | – |
| H | (4101) | 0.27 | – | 0.17 | – |
| H | (4341) | 0.46 | – | 0.34 | – |
| O iii | (4363) | 0.32 | – | 0.29 | – |
| He ii | (4686) | 0.21 | – | 0.22 | – |
| H | (4861) | 1.00 | 1.00 | 1.00 | 1.00 |
| O iii | (4959) | 4.08 | 2.18 | 3.43 | 2.44 |
| O iii | (5007) | 12.14 | 6.72 | 10.12 | 4.40 |
| H | (6563) | 4.10 | 8.95 | 3.88 | 3.38 |
| N ii | (6583) | 1.52 | 6.32 | 1.53 | 1.29 |
| S ii | (6717) | 0.44 | 0.53 | 0.41 | 0.34 |
| S ii | (6731) | 0.37 | 0.34 | 0.37 | 0.36 |
| Ratio | A | B | C | s2 |
|---|---|---|---|---|
| log ([O iii])/(H) | 1.1 | 0.8 | 1.0 | 0.4 |
| log ([O ii])/([O iii]) | -0.9 | -0.3 | -0.7 | – |
| log ([N ii]/(H) | -0.4 | -0.2 | -0.4 | -0.4 |
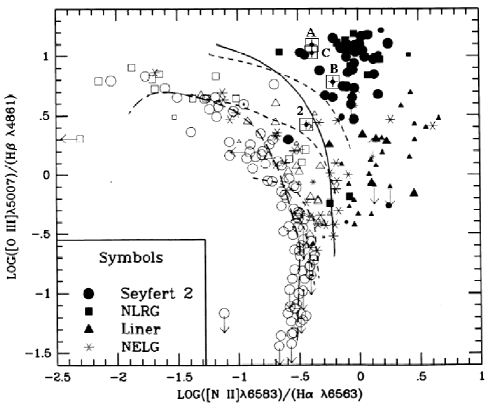
Baldwin et al. (baldwin (1981)), and Veilleux and Osterbrock (veilleux (1987)), have introduced the so-called diagnostic diagrams in order to distinguish between several plausible ionization processes. Comparing the logarithms of several line ratios, in particular those involving highly ionized species versus less ionized ones, they have been able to separate H ii regions from other objects powered by non-thermal processes.
The relevant intensity ratios for the host of HE 14341600 are summarized in Table 3 and compared to the published sample of AGNs and H ii regions of Veilleux & Osterbrock (veilleux (1987)) in Fig. 8. No extinction correction has been applied, as the intensity ratios are for lines at similar wavelengths. Reasonable reddening corrections would only lead to negligible changes.
The most striking result is that, while the measurements for slit 2 show intermediate ionization levels, all three ratios for the extractions along slit 1 fall well into the AGN zone, even for regions situated as far as 6 kpc from the central quasar. This empirical comparison of the ionization level of the ISM in the host of HE 14341600 with the sample of Veilleux & Osterbrock (veilleux (1987)) suggests that at least a significant part of the ionization comes from non-thermal processes. In addition, the significant differences between slit 1 and slit 2, as well as between the external apertures (A and C) and internal apertures (B) extractions of the spectra, along slit 1, show that the ionization degree is not constant throughout the galaxy. The ionization, if produced by the central QSO, might not be isotropic because of shadowing effects on UV radiation from the nucleus. However, it is more likely that density variations in the gas clouds give rise to different ionization degrees, as suggested by Stockton et al. (stock02 (2002)).
The strongest narrow line emissions we detect in the host of HE 14341600 are located far away from the nucleus, at about 5–6 kpc along the direction of slit 1. The spectrum obtained through slit 2 does not show such strong emission lines far away from the nucleus. Making the analogy with Seyfert galaxies that display radio jets may be relevant. In some of these galaxies, ionized gas is detected as far as several kiloparsecs away from the center. Evans et al. (evans (1999)), Wilson et al. (wilson (1994)), Fosbury et al. (fosb (1984)), Tadhunter & Tsvetanov (tad (1989)) argue that the high level of ionization is due both to the UV radiation from the nucleus and to shock induced ionization by the radio jet. A more recent example of shock induced ionization is presented in Morganti et al. (morganti03 (2003)), who observed the Seyfert galaxy IC 5063. Thanks to the high spatial resolution of their radio observation, the authors identify a radio jet, exactly overimposed on ionization “hot spot” seen in the optical spectrum of the galaxy, e.g., in [O iii].
In our case, the low resolution radio map of Fig. 3 shows radio jets oriented N-S, i.e. nearly exactly in between slit 1 and slit 2. If the emission is induced by a shock, and if the shock is along the direction of the radio jet, one would thus expect similar contributions in both slits, in sharp contrast with the observations. VLA or VLBI observations of HE 14341600 would help to clarify which influence, if any, the radio jet has on this high ionization.
Extended Emission Line Regions (EELR) are also found in RLQ (Boroson et al. boroson85 (1985)), that have strong [O iii](5007Å) and other highly ionized emissions, no Fe ii in their central part (i.e., the quasar spectrum), extended radio lobes, and steep radio spectra. HE 14341600 displays these characteristics, except for the last feature for which we lack information. EELR are often spatially unrelated with interstellar emissions, but scales involved for the EELR are systematically larger (around 70–80 kpc) than ours ( 10 kpc). In the studies of Stockton et al. (stock02 (2002)) and Wilman et al. (wilman (2000)), assumption is made that direct radiation from the central AGN is the source of ionization, while the source of gas is thought to be recent interaction or merger. This scenario explains why EELR are not found in all RLQ. The link between radio jets and EELR however remains unclear. EELR where at least two different ionization levels coexist can be explained by density variations (Stockton et al. stock02 (2002)). This seems to be the case for HE 14341600 . Whether or not a shock induced ionization exists, direct ionization by the high energy radiation from the AGN, typical in EELR, even in regions as far as 6 kpc from the nucleus, is sufficient to explain the spectral features of the present object.
5 Redshift and environment
5.1 HE 14341600
Measuring the redshift of HE 14341600 on all available emission lines leads to slightly different estimates when using the central quasar or its host galaxy. We measure for the host only, and for the quasar only (), or a mean redshift of . The measurement done on the host’s spectrum is for the center of the galaxy, hence not affected by rotation, if any. However, if the velocity field observed for the gas (see next section) is due to gas inflow/outflow due to merger activity, this value might be biased.


| Galaxy | x(″) | y (″) | Redshift | Velocity |
|---|---|---|---|---|
| () | ||||
| HE 14341600 | 0.0 | 0.0 | 0.1443 | 0 |
| G1(companion) | 2.6 | 3.0 | 0.1428 | 450 |
| G2 | 25.0 | 38.4 | 0.1426 | 526 |
| G3 | 54.0 | 63.4 | 0.1436 | 210 |
| G4 | 9.2 | 63.0 | 0.1437 | 180 |
| G5 | 110.0 | 52.0 | 0.1429 | 420 |
5.2 Environment
Redshifts were also determined for 5 other objects in the vicinity of HE 14341600, indicated in Fig. 1. One of them is galaxy G1, located 4″ away from HE 14341600 and present only in slit 2. The redshift measurement is based on the identification of the sodium absorption line Na i(5896Å). The apparent emission lines visible on this spectrum are only due to contamination by the extended host galaxy of HE 14341600. The spectrum of G1 is presented in Fig. 9. Measuring the redshift directly from Na i and other weaker Fe lines or by cross-correlating the spectrum with that of a template spectrum of an elliptical galaxy yields 0.0003.
The redshifts of four other galaxies, picked-up randomly because they were in the unvignetted area of the CCD chip (Fig. 10), were also measured, mainly based on the H emission line (Table 4). Galaxy G4 even shows rotation, with a prospected rotation velocity of v, measured 14 from the center of the galaxy, in the flat part of the rotation curve. G1, the closest companion to HE 14341600, is the only galaxy out of the 5 known companions that does not show emission lines.
With at least 6 objects at almost the same redshift, HE 14341600 is part of a small group of galaxies whose velocity dispersion is , with a 95 percent confidence interval of 123 . Considering the group as an isothermal sphere with a mean radius of (Binney and Tremaine binney (1987)), its mass is, M⊙. This places it among the loosest groups of galaxies, e.g., when compared with the groups found in the Las Campanas Redshift Survey (Heinämäki et al. heina03 (2003)), who find group masses in the range – M⊙.
6 Dynamics of the host galaxy
Because our observational strategy is to take the spectra “on-axis” rather than a few arcseconds away from the AGN center, the dynamical information about the host galaxy is not lost. The signal-to-noise ratio of the data is sufficient to perform quantitative measurement of the stellar and gas velocity fields.
6.1 Stellar dynamics
The Calcium Ca ii absorption doublet is detected in the spectrum obtained in April 2000. It is outside the accessible wavelength range in the observations taken in May 2002. Because of the low signal-to-noise in these lines, we can not perform a full extraction of the stellar velocity field. We can however get significant hints about the stellar rotation/motion, by dividing the galaxy into two parts along the spatial direction, and by cross-correlating them. Two spatial extractions were done along slit 1. The light of the quasar host was integrated in two “boxes” lying between 08 and 28 away from the center of the galaxy. Their cross-correlation, displayed in Fig. 11 shows a sharp peak centered at . Similar results are found on the slit 2 spectrum. We can therefore conclude that stars do not display a global rotation in the host of HE 14341600.

6.2 Gas dynamics
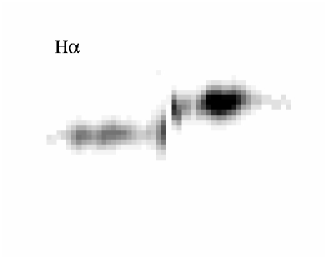
Contrary to the absorption lines, an obvious velocity field is seen in the emission lines of the host galaxy. An example of emission lines is shown in Fig. 14, where the continuum of the host galaxy has been removed. The gas seen through the two slit orientations behaves differently. While slit 1 reveals the gas motion, the emission lines seen along slit 2 remain perfectly straight.
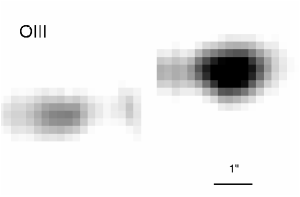
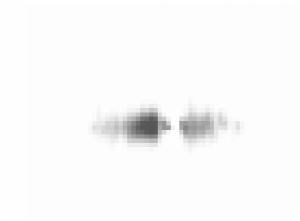
The spatial profiles in the lines in Fig. 14 show, as said previously, that the gas is not distributed uniformly in the galaxy. In particular, the [O iii] emission line is composed of two bright spots located 22 and 24 away from the nucleus, and that correspond perfectly to the two bright spots already seen in the spatial profiles of Fig. 5. They are not deconvolution artifacts. In fact, they are detectable in the original data without subtracting the quasar (Fig. 12).
The velocity curves have been determined from several emission lines, extracted from reduced spectra to avoid artifacts deconvolution could bring, specially near the nucleus. The extraction method is described in Courbin et al. (Courbin_b (2002)). These curves are displayed in Fig. 14. While there is no velocity field along slit 2, the curve for slit 1 is very sharp in the central kiloparsec, and almost flat in the outer parts of the galaxy. This is hard to reconcile with models involving pure rotation, but we nevertheless attempted to follow the same approach as in Courbin et al. (Courbin_b (2002)), for the spiral host of HE 1503+0228.
A mass model is assumed for the galaxy, including a rotating disk, a central point mass and a dark matter halo. This mass model is then used to predict the velocity of the galaxy at a given point of the slit, taking into account the inclination of the disk and convolution by the seeing profile, using the known spectrum of the PSF. Many different initial conditions were used when fitting the model, with no successful solution. In fact, we found no way to model simultaneously the sharp central velocity trough, that requires a very large central mass, and the flat external parts, that require large amounts of dark matter, while keeping the various parameters at reasonable values.


We have thus considered other mass distributions, such as a modified Hubble profile, power-law density profile or isochrone potential (Binney & Tremaine binney (1987)), all encountering the same difficulty. In the best fits, central masses of the order of M⊙ are always found. For comparison, the central mass found for HE 1503+0228 was M⊙, three orders of magnitude smaller. Other groups have estimated the central masses in galaxies, most of the time for isolated ellipticals like in the SAURON survey (e.g., NGC 3377, Copin et al. copin03 (2003)), more massive ellipticals (M87, Macchetto et al. macchetto97 (1997), Cen A, Marconi et al. marco01 (2001)), or Seyfert galaxies (NGC 4041, Marconi et al. marco03 (2003); Mrk 110, Kollatschny kola03 (2003)). The masses they find, either using the black hole central velocity dispersion relation, or direct dynamical modeling, is always in the range – M⊙, with some supermassive black holes reaching up to 109 M⊙, e.g., in the Seyfert NGC 5252 (Macchetto macchetto03 (2003)). The central mass in HE 14341600, assuming gas rotation, is still an order of magnitude above the most massive black holes found in other galaxies.


The central mass can be estimated independently using the known correlation between RBLR, the radius of the Broad Line Region (BLR), and the monochromatic AGN continuum luminosity at 5100 Å (Kaspi et al. kaspi (2000)). This luminosity-based RBLR is combined with a measurement of the BLR velocity extracted from the Full Width at Half Maximum of the H emission line. Assuming that the motion in the BLR in AGN is virialized, one can use the simple Keplerian relation
| (1) |
to estimate the mass of the central black hole. In the case of HE 14341600 we find 3.6 108 M⊙. Again, this is two orders of magnitude lower than obtained with our galaxy mass models.
We have tried to fit the velocity curves with models including a central mass fixed at the above value, i.e. M⊙. We can obtain rather reasonable fits (see Fig. 14), but at the expense of completely unrealistic parameters (e.g., a disk with a huge mass density confined to a few parsecs). Indeed, the lower is always compensated by other mass components which become concentrated near the nucleus. Nevertheless, all models lead to a total mass of M⊙, within a radius of 10 kpc.
7 Discussion – Conclusions
In the framework of a comprehensive spectroscopic study of quasar host galaxies, we have obtained VLT optical observations of the quasar HE 14341600, that retained our attention and triggered follow-up observations. Two slit orientations were used (see Fig. 4) and the data were spatially deconvolved, resulting in spectra of the host galaxy decontaminated from the light of the central quasar.
We found the host galaxy of HE 14341600 is a rather peculiar object. Simple observational facts are:
-
1.
Optical and near-IR imaging of HE 14341600 reveals an elliptical morphology, with colors bluer than inactive elliptical galaxies, indicating a contribution of a young stellar population.
-
2.
The galaxy harbours a bright quasar, whose radio loudness index places it at the limit between radio quiet and radio loud. Extended lobes are seen in the radio up to 5′ away from the quasar.
-
3.
The ISM of the host is heterogeneous and highly ionized by the central AGN. Ionization triggered by the radio jet can not be excluded.
-
4.
While the gas emission lines observed through slit 1 all show a clear velocity field, the stellar absorption lines do not display any sign of rotation, in accordance with the observed elliptical morphology.
-
5.
Neither the stars nor the gas are affected by a velocity field in the slit 2 observations, almost perpendicular to slit 1.
-
6.
No mass model involving rotation of a gas disk fit properly the gas velocity of slit 1 unless invoking extremely high central masses for the galaxy an order of magnitude above that of the most massive black holes known ( M⊙).
-
7.
HE 14341600 is part of a small group with or M M⊙.
-
8.
The closest companion G1, of HE 14341600 is located 4″ away from it, with a velocity difference of 450 . No trace of gas emission is detected.
In order to explain the main characteristics of the host galaxy of HE 14341600 and environment, we propose the following interpretation.
The motion of the gas, as deduced from the emission lines, cannot be interpreted as Keplerian motion in any reasonable mass model. It must be affected by some interaction with an intervening object. At least two possibilities arise: (1) the dynamics of the gas is modified by interaction with matter and/or radiation from the AGN or (2) it has been affected by a recent collision with the neighbouring galaxy G1. As the central AGN of HE 14341600 does not appear very different from other quasars in the sample, which display relatively mundane host galaxies in which the ISM does not show obvious signs of disturbance by the central AGN (e.g., HE 1503+0228, Courbin et al Courbin_b (2002)), we consider the second explanation as most likely.
We propose that the ISM of both galaxies (host and G1) has been swept out during a recent close interaction and has had insufficient time to relax. Using the velocity dispersion in the group as an estimate of the relative velocity of the two interacting galaxies, we estimate that it would have taken years for the two galaxies to reach their present projected separation. This is much smaller than the typical relaxation time of a merger ( years, Wright 1990, Barnes 1989).
Now, we need to explain why, although quasars of similar luminosities (e.g., HE 1503+0228) seem unable to ionize the interstellar gas outside the central AGN region, the central engine of HE 14341600 is able to strongly excite and ionize the ISM as far as 5 to 6 kiloparsec. If the collision with galaxy G1 has been strong enough to remove the gas out of the host galaxy, even in the most central regions, nothing is left to absorb the ionizing radiation of the quasar which is then able to propagate freely to large distances, until it hits the gas clouds moving far away from the center and strongly ionizes them.
In our opinion, a recent collision with galaxy G1 is thus the key factor allowing to explain both the peculiar motion of the gas and its high degree of ionization by the central quasar, even very far away from the source of radiation.
Acknowledgements.
The authors would like to thank Françoise Combes and Raffaela Morganti for useful discussions and suggestions. The NASA Extragalactic Database (NED) has been used for this research. Géraldine Letawe is a teaching assistant supported by the University of Liège, (Belgium). Frédéric Courbin acknowledges financial support from the European Commission through Marie Curie grant MCFI-2001-0242. The Pôle d’Attraction Interuniversitaire, P5/36 (PPS Science Policy, Belgium) is also thanked.References
- (1) Baldwin, J., Phillips, M., Terlevich, R. 1981, PASP, 93, 5
- (2) Barnes, J. 1989, Nature, 338 123
- (3) Barnes, J., Hernquist, L. 1992, ARA&A 30, 705
- (4) Binney, J., Tremaine, S. 1987, Galactic Dynamics (Princeton: Princeton Series in Astrophysics)
- (5) Blair, W., Kirshner, R. 1985, ApJ, 289, 582
- (6) Blundell, K., Beasley, A., Bicknell, G. 2003, ApJ, 591, L103
- (7) Blundell, K., Rawlings, S. 2001, ApJ, 562, L5
- (8) Boroson, T., Oke, J. 1984, ApJ, 281, 535
- (9) Boroson, T., Persson, S., Oke, J. 1985, ApJ, 293, 120
- (10) Brocklehurst, M. 1971, MNRAS, 153, 471
- (11) Condon, J., Cotton, W., Greisen, E., Yin, Q., Perley, R., Taylor, G., Broderick, J. 1998, AJ, 115, 1693
- (12) Copin, Y., Cretton, N., Emsellem, E. 2003, astro-ph/0311387
- (13) Courbin, F., Magain, P., Kirkove, M., Sohy, S. 2000a, ApJ, 529, 1136
- (14) Courbin, F., Letawe, G., Magain, P., Wisotzki, L., Jablonka, P. et al. 2002, A&A, 394, 863
- (15) Dunlop, J. 2003, to appear in ”Carnegie Observatories Astrophysics Series, Vol. 1-Coevolution of Black Holes and Galaxies” ed. L.C. Ho (Cambridge: Cambridge Univ. Press)(astro-ph/0304168)
- (16) Evans, I., Koratkar, A., Allen, M., Dopita, M., Tsvetanov, Z. 1999, ApJ, 521, 531
- (17) Fioc, M., Rocca-Volmerange, B. 1999, A&A, 351, 869
- (18) Fosbury, R., Tadhunter, C., Danziger, I., Bland, J. 1984, MNRAS, 208, 955
- (19) Fukugita, M., Shimasaku, K., Ichikawa, T. 1995, PASP, 107, 945
- (20) Heinämäki, P., Einasto, J., Einasto, M., et al. 2003, A&A 397, 63
- (21) Jahnke, K. 2002, Doctoral Dissertation, Universität Hamburg
- (22) Jahnke, K., Wisotzki, K. 2003, MNRAS, 346, 304
- (23) Jahnke, K., Kuhlbrodt, B., Wisotzki, K. 2004, MNRAS, in press (astro-ph/0311123)
- (24) Kaspi, S., Smith, P.S., Netzer, H., Maoz, D., Jannuzi, B.T., Giveon, U. 2000, ApJ, 533, 631
- (25) Kellermann, K., Sramek, R., Schmidt, D., Shaffer, D., Green, R. 1989, AJ, 98, 1195
- (26) Kennicutt, R. 1992, ApJ, 388, 310
- (27) Knapp, G., Turner, E., Cunniffe, P. 1979, AJ, 90, 3
- (28) Kollatschny, W. 2003, A&A, 412, L61
- (29) Krolik, J. H. 1999, Active Galactic Nuclei (Princeton: Princeton Series in Astrophysics)
- (30) Macchetto, F.D., Marconi, A., Axon, D.J., et al. 1997, ApJ 489, 579
- (31) Macchetto, F.D. 2003, in Active Galactic Nuclei: from Central Engine to Host Galaxy, ASP Conference Series, Vol. 290, p567 (S. Collin, F. Combes, I. Shlosman Eds.)
- (32) Magain, P., Courbin, F., Sohy, S. 1998, ApJ, 494, 452
- (33) Marconi, A., Capetti, A., Axon, D.J., et al. 2001, ApJ 549, 915
- (34) Marconi, A., Axon, D. J., Capetti, A., et al. 2003, ApJ 586, 868
- (35) Martin, B. 1971, Statistics for Physicists, Academic Press Inc. (London)
- (36) Morganti, R., Oosterloo, T., Tsvetanov, Z. 1998, AJ, 115, 915
- (37) Morganti, R., Oosterloo, T., Holt, J., et al. 2003, ESO-Messenger 113, 67
- (38) Phillips, M., Jenkins, C., Dopita, M., Sadler, E., Binette, L. 1986, AJ, 91, 5
- (39) Schlegel, D.J., Finkbeiner, D.P., Davis, M. 1998, ApJ 500, 525
- (40) Shields, G. 1990, Annu. Rev. A&A, 28, 525
- (41) Stockton, A., MacKenty, J. 1987, ApJ, 316, 584
- (42) Stockton, A., MacKenty, J., Hu, E., Klim, T. 2002, ApJ, 572, 735
- (43) Tadhunter, C., Tsvetanov, Z. 1989, Nature, 341, 422
- (44) Veilleux, S., Osterbrock, D. 1987, ApJS, 63, 295
- (45) Vernet, J., Fosbury, R., Villar-Martín, M. et al. 2001, A&A, 366, 7
- (46) Wilman, R., Johnstone, R., Crawford, C. 2000, MNRAS, 317, 9
- (47) Wilson, A., Tsvetanov, Z. 1994, AJ, 107, 1127
- (48) Wisotzki, L., Christlieb, N., Bade, N., et al. 2000, A&A, 358, 77
- (49) Wright, G., James, P., Joseph, R., McLean, I. 1990, Nature, 344, 417
- (50) Young, L. 2002, AJ, 124, 788