The Emergence of the Thick Disk in a CDM Universe
Abstract
The disk galaxy simulated using our chemo-dynamical galaxy formation code, GCD+, is shown to have a thick disk component. This is evidenced by the velocity dispersion versus age relation for solar neighbourhood stars, which clearly shows an abrupt increase in velocity dispersion at lookback time of approximately 8 Gyrs, and is in excellent agreement with observation. These thick disk stars are formed from gas which is accreted to the galaxy during a chaotic period of hierarchical clustering at high redshift. This formation scenario is shown to be consistent with observations of both the Milky Way and extragalactic thick disks.
1 Introduction
Since its existence was detected through star counts by Gilmore & Reid (1983), the thick disk has become established as a component of the Milky Way that is distinct from the thin disk. It is hoped that the old age of the stars associated with the thick disk of the Milky Way means that it will serve as a fossil record of the formation processes of the early parts of Galactic evolution.
Several large surveys have been undertaken to constrain the properties of the Milky Ways thick disk. The local number density of thick disk stars is about 6-13% of that of the thin disk (e.g. Chen et al. 2001); the thick disk has a scale height of 0.6-1 kpc (e.g. Phelps et al. 1999, Ojha 2001, Chen et al. 2001), about three times larger than the thin disk; a scale length of 3 kpc (e.g. Robin et al. 1996; Ojha 2001) compared with a thin disk scale length of 4.5 kpc (e.g. Habing 1988); its stars are old, almost exclusively older than 12 Gyrs (e.g. Gilmore & Wyse 1985; Edvardsson et al. 1993; Fuhrmann 1998). Thick disk stars have a wide range of metallicity, 2.2[Fe/H]0.5, (Chiba & Beers 2000, CB hereafter), although the metal weak ([Fe/H]1.0) tail of the distribution contributes only 1% of the thick disk (Martin & Morrison 1998), and may be a different population to the canonical thick disk (Beers et al. 2002). We also note that Feltzing Bensby & Lundström (2003, hereafter FBL) find that the thick disk metallicity distribution extends to metallicities higher than [Fe/H]=0.5. The metallicity distribution peaks at [Fe/H]0.6 (Gilmore & Wyse 1985; Wyse & Gilmore 1995; CB). Thick disk stars are also characterised by their warm kinematics, and a rotation that lags the thin disk e.g. Strömgren (1987) find (,,)=(65,54,38) km/s, V40 km/s.
There is mounting evidence that chemical trends in the thick and thin disk stars are different (Fuhrmann 1998; Prochaska et al. 2000; Tautvaisiene et al. 2001; Schröder & Pagel 2003; Mashokina et al. 2003, MGTB hereafter; Reddy et al. 2003; FBL; but see also Chen et al. 2000 for a conflicting view). A major diagnostic coming from such different chemical trends between thin disk and thick disks is the different -element to iron abundance ratios, indicating different formation timescales. The enhanced element abundances compared to iron which are observed in thick disk stars indicate a short formation timescale in which enrichment is dominated by Type II Supernovae (SNe II). Although FBL found evidence of SNe Ia enrichment in the most metal rich of the thick disk stars, their values for [/Fe] are systematically higher than thin disk stars with the same [Fe/H]. Fuhrmann (1998), Gratton et al. (2000), and Mashonkina & Gehren (2001) conclude that star formation in the thick disk lasted less than 1 Gyr, while correlations of various chemical elements in thick disk stars lead MGTB to estimate this time scale to be 0.5 Gyrs. MGTB also conclude that the homogeneity of abundances of thick disk stars indicates that it formed from gas which was well mixed, a conclusion which is consistent with the results of Nissen & Schuster (1997), Fuhrmann (1998), and Gratton et al. (2000).
Over the past decade or more, N-body cosmological simulations have been successful in reproducing many properties of disk galaxies. Recently, using a new implementation of SNe feedback, Brook et al. (2003, BKGF hereafter) successfully simulated a realistic disk galaxy which has its stellar mass dominated by a young stellar disk component, surrounded by a less massive, old, metal poor, stellar halo. In this letter we examine this simulated disk galaxy for evidence of a thick disk component, looking for clues as to the origins of this component within the hierarchical galaxy formation of a CDM context.
In Section 2, we give details of our N-body chemo-dynamical evolution code, GCD+, and the semi-cosmological galaxy formation model that we employ. Initial conditions are chosen that lead to the formation of a late type galaxy, whose properties are presented in Section 3. Further study of our simulated galaxy provides evidence for the existence of a distinct thick disk population, similar to that of the Milky Way. This allows us, in Section 4, to trace the major thick disk formation epoch and propose a thick disk formation scenario. In Section 5 we compare our scenario to other theories of thick disk formation, and discuss how current observational data may be used to distinguish these theories.
2 The Code and Model
This paper analyses data from the simulated late type galaxy of the Adiabatic Feedback Model from BKGF. We briefly review some features of the code and model. Our galactic chemo-dynamical evolution code, GCD+, self-consistently models the effects of gravity, gas dynamics, radiative cooling, and star formation. We include SNe Ia and SNe II feedback, and trace the lifetimes of individual stars which enables us to monitor the chemical enrichment history of our simulated galaxies. Details of GCD+ can be found in Kawata & Gibson (2003).
We assume that 1051 ergs is fed back as thermal energy from each SNe. The energy is smoothed over the nearest neighbour gas particles using the SPH kernel. This feedback scheme is known to be inefficient (Katz 1992). To address this problem, gas within the SPH smoothing kernel of SNe II explosions is prevented from cooling, creating an adiabatic phase for gas heated by such SNe. This is similar to a model presented in Thacker & Couchman (2000)
The semi-cosmological version of GCD+ used here is based upon the galaxy formation model of Katz & Gunn (1991). The initial condition is an isolated sphere of dark matter and gas. This top-hat overdensity has an amplitude, , at initial redshift, , which is approximately related to the collapse redshift, , by =0.36(1+)1 (e.g. Padmanabhan 1993). We set =1.8, which determines at =40. Small scale density fluctuations are superimposed on the sphere, parameterized by . These perturbations are the seeds for local collapse and subsequent star formation. Solid-body rotation corresponding to a spin parameter, , is imparted to the initial sphere to incorporate the effects of longer wavelength fluctuations. A large value of is chosen along with initial conditions in which no major merger occurs in late epochs (1), in order to ensure a disk galaxy is formed. For the flat CDM model described here, the relevant parameters include =1, baryon fraction, , km s-1Mpc-1, total mass, M⊙, star formation efficiency, c∗=0.05, spin parameter, =0.0675 and =0.5. We employed 38911 dark matter and 38911 gas/star particles, making the resolution of this study comparable to other recent studies of disk galaxy formation (e.g. Abadi et al. 2003).
3 Properties of Final Galaxies
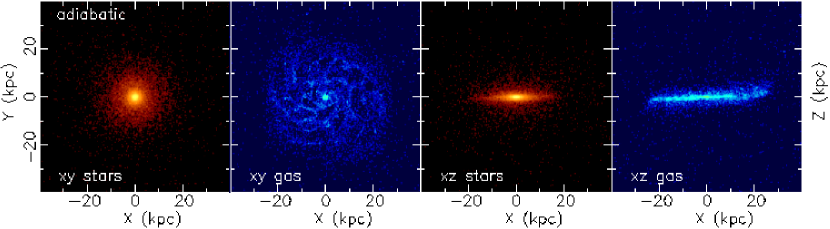
Fig. 1 shows a density plot of the final stellar and gas populations of the simulated galaxy, both face on and edge on. The stellar mass is dominated by a young disk component. A large gaseous thin disk, still undergoing star formation, has also formed. The stellar population of the low mass stellar halo component is old and metal poor. The star formation history is shown in Fig. 2, which plots look back time against the star formation rate (SFR). The SFR peaks 9 Gyrs ago. The SFR then declines over the next 4-5 Gyrs, but is reasonably steady over the last 5 Gyrs.
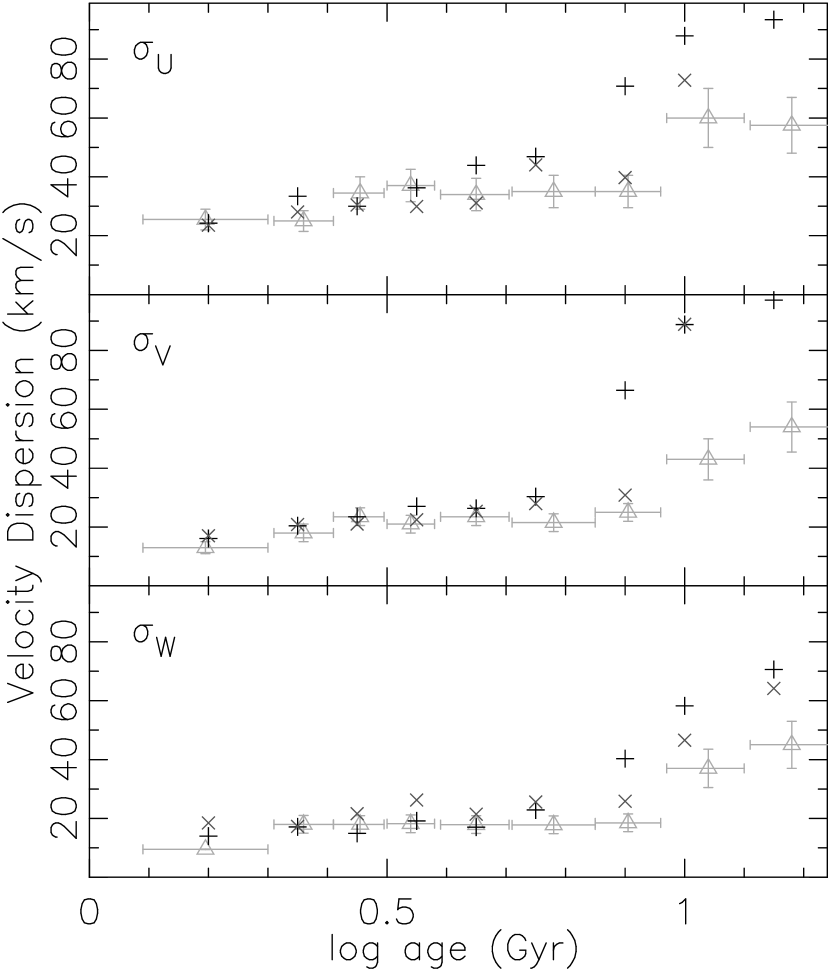
We are interested here in the thick disk component. In observations of the Milky Way, the peculiar velocity of stars is a useful diagnostic to distinguish thick disk stars from thin disk stars. For observed Solar neighbourhood stars, it is well established that there is a relationship between velocity dispersion and age. Fig. 3 shows the observed relation as grey symbols, with error bars, as read from Fig. 3 of Quillen & Garnett (2001), who use the data of Edvardsson et al. (1993). The velocity dispersions plateau between the ages of 10 and Gyrs; these stars belong to the old thin disk. A slight decrease in dispersion is apparent for young star particles, less than 2 Gyrs old. Notably, the velocity dispersions increase abruptly, approximately doubling, 10 Gyrs ago. These older stars belong to the thick disk111We note that a more recent study by Nordstrom et al. (2004) revisits this relation, and finds that the thin disk stars do show a slight increase of velocity dispersion with age, but stars older than 10 Gyrs were excluded from their study.. In Fig. 3 we use “” symbols to plot the relation between the three components of the velocity dispersion, and the stellar age, for solar neighbourhood star particles in our simulation. The solar neighbourhood is defined as the annulus 412 kpc and 1 kpc. The abrupt increase in velocity dispersion, associated with the thick disk, is unmistakably reproduced in our simulation.
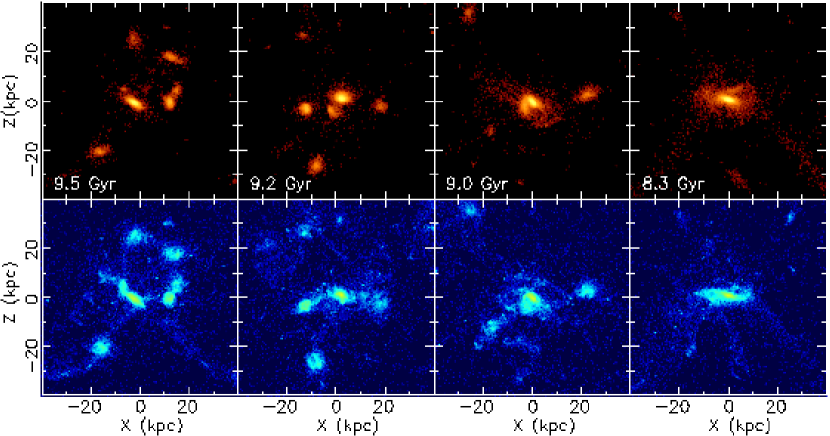
Interestingly, the timing of the abrupt increase in velocity dispersion in our simulations corresponds to the end of the peak of the SFR (Fig. 2). This motivated us to explore the main processes which were taking place during this epoch of the peak star formation rate, when stars of age 8 Gyrs were forming rapidly. This epoch appears to be associated with thick disk formation. Fig. 4 displays the evolution of the stellar (upper panels) and gaseous (lower panels) density distribution of the simulated galaxy during this epoch, between 9.5 and 8.3 Gyrs ago. This epoch is characterised by a series of merger events, and is by far the most chaotic period during the galaxy’s evolution. At the beginning of this epoch, 10 Gyrs ago, at least four proto-galaxies of significant mass exist. These building blocks are gas rich, with combined gas mass of 2.4M⊙, compared with stellar mass of 7.0M⊙. By 8 Gyrs ago, a single central galaxy has emerged. The flattened nature of this central galaxy is apparent by the last panel of Fig. 4, yet this disk is significantly thick. The thin disk forms in the quiescent period of the remaining 8 Gyrs.
There is an offset in the timescales of the thick disk formation between the simulation and observation, with the observational (simulated galaxy’s) abrupt increase in velocity dispersion occurring around 10 (8) Gyrs ago. To further investigate this offset, we examine a simulation which evovles to a disk galaxy in which the collapse redshift, =2.2, was earlier than for the model examined so far in this paper. This galaxy less resembles the Milky Way in that it has a large bulge component, yet it also has a prominant disk. The major merging epoch of this galaxy is earlier than for our previous model, and this is reflected in the relation between velocity dispersion and age represeted by “” in Fig. 3, where the abrupt increase in velocity dispersion has been pushed back in time to 10 Gyrs. The implications is that the offset is a result of the merging histories of the different galaxies.
We consider some further properties of the stars which are formed in the chaotic period of galaxy formation which we have identified with thick disk formation, and make comparisons with stars which form in the later quiescent epoch. We remind the reader that our simulated galaxy is not a model of the Milky Way, but rather a Milky-Way like late type galaxy: precise quantitive agreement in any of the properties examined would not be expected. Star particles with age 7 (8.5 age 10.5) Gyrs are referred to as thin (thick) disk stars. A (somewhat arbitrary) cut in rotational velocity, (50 km/s) is then made, and all stars with (50 km/s) are defined as halo stars. This cut does not affect the thin disk, but identifies around of stars which formed during the epoch of thick disk star formation as halo stars. The simplicity of our assignment of stars to thin and thick disks on the basis of age, allows us to link properties of the different components stars to processes occuring at the different epochs at which they form.
Fig. 5 shows the surface density distributions of the thin and thick disk components of our simulated galaxy. Both components are well approximated by exponential profiles within the region 4R12 kpc, with scale lengths of 4.1 kpc and 2.6 kpc for the thin and thick disks respectively. Fig. 6 shows the vertical density distributions of the thin and thick disk components, averaged over the region 4R12 kpc. The exponential profile of these plots indicate scale heights of 0.5 kpc and 1.3 kpc for the thin and thick disk respectively. The rotation curves of the thin (thick) component is shown as a dashed (dot-dashed) line in Fig. 7. The thick disk lags the thin disk by approximately 20 km/s in the solar neighbourhood. The implication of these plots is to confirm that our simulated galaxy has both a thin and thick disk component and that these components are qualitatively similar to those of the Milky Way (see Section 1).
The metallicity distribution functions of solar neighbourhood stars, defined as above, are shown in Fig. 8. Thin disk stars (dashed line) peak at [Fe/H]0.1. Thick disk stars (dot-dashed line) have greater spread in metallicity than thick disk stars, despite their tighter age spread, and peak at [Fe/H]0.3. This makes our thick disk component more metal rich than that of the Milky Way. In Brook et al. (2004) a link was made between the mass ratios of the components of simulated galaxies, to the metallicties of those components. The stellar halo of our simulated galaxy is both more massive and more metal rich than that observed for the Milky Way (Brook et al. 2004). This would naturally be associated with the gas rich building blocks associated with thick disk formation in our simulation being more metal enriched than those of the Milky Way. Halo stars (dotted line) are defined as stars with km/s and peak at [Fe/H]0.8222The metallicity distribution functions derived using the same simulated galaxy in Brook et al. (2004) use different methods to define halo and disk stars, resulting in slightly different MDFs, with a large tail toward lower metallicities. As noted, the higher metallicity of the halo stars compared to the Milky Way, which has a peak at [Fe/H]1.5, is due to the stellar halo of the simulated galaxy being more massive than the Milky Ways halo. This massive stellar halo, resulting in larger than observed contamination of the solar neighbourood by halo stars, may also explain why the abrupt increase in velocity dispersion seen in Fig. 3 is larger for our simulated galaxy than for the Milky Way.
4 Discussion
We have shown that properties of solar neighbourhood star particles from our simulated disk galaxy are intimately related to processes which can be associated with different epochs. The majority of solar neighbourhood stars which form during a chaotic merging period, between 10.5 and 8.5 Gyrs ago in our simulation, are characteristically thick disk stars. A small portion of stars born in this time are halo stars. Solar neighbourhood stars which form in the more quiescent period over the past 8 Grys are characteristically thin disk stars.
Our results indicate that the thick disk is created in an epoch of multiple mergers of gas rich building blocks, during which a central galaxy is formed. The stars which form during this merging period, when a high SFR is triggered (Fig. 2), are the dominant source of thick disk stars. A significant fraction of the gas accreted to the central galaxy during this epoch carries the angular momentum of the proto-galactic cloud, imparted by the large scale structure of the Universe. This angular momentum results in the rotation and flattening of the central galaxy which is formed. Yet this epoch is characterised by violent interactions, and the forming gas disk can be described as dynamically hot, resulting in the high velocity dispersion of the forming stars in the disk. The result is the formation of a thick disk. In falling gas after this multiple merger epoch settles smoothly to a thin disk.
Several formation scenarios for the thick disk were presented by Gilmore et al. (1989): 1) a slow, pressure supported collapse which follows the formation of halo Population II stars (Larson 1976); 2) Violent dynamical heating of the early thin disk by satellite accretion (Quinn et al. 1993) or violent relaxation of the Galactic potential (Jones & Wyse 1983); 3) accretion of thick disk material directly (Statler 1988; Bekki & Chiba 2000; Abadi et al. 2003); 4) enhanced kinematic diffusion of the thin disk stellar orbits (Norris 1987); 5) a rapid dissipational collapse triggered by high metallicity (Wyse & Gilmore 1988). To unravel which of these processes was the major driver of thick disk formation, information of the metallicity, ages, and chemical abundances of thick disk stars can be compared to the predictions that the various scenarios make.
Lack of a vertical metallicity gradient in the thick disk (Gilmore et al. 1995), as well as a lack of large intermediate age thick disk population seems to rule out the slow collapse of scenario 1). The lack of overlapping age distributions between thick and thin disk stars, as well as the discontinuity in their chemical abundances argues, against the enhanced kinematic diffusion scenario 4). Further evidence against such a scenario is the size of the discontinuity in velocity dispersion, which appears to be too great to be explained by the known heating mechanisms, i.e. local gravitational perturbations in the thin disk, such as giant Molecular Clouds (Spitzer & Schartzschild 1953), or transient spiral structure (Barbanis & Woltjer 1967; Carlberg & Sellwood 1985). Freeman (1991) suggested that these disk heating mechanisms saturated or became inefficient at 30 km/s. Lack of correlation between the scale length of the thick and thin disk components of disk galaxies observed in Dalcanton & Burnstein (2002, DB hereafter), also contradicts scenario 4) for thick disk formation in other galaxies. If the thick disk were made up of primarily of material accreted slowly over time from many smaller satellites, on suitable orbits, as in scenario 3), then the metallicity of the stars would be too low to explain the observed peak metallicity of the thick disk. The well known metallicity-mass relation of galaxies would require accretion of massive satellites (1010M⊙), which would destroy the thin disk, in order to obtain metallicities of [Fe/H]0.6, unless the accreted satellites are gas rich and the accretion process induces a significant self-enrichment (Bekki & Chiba 2002). In addition, recent high resolution spectroscopic observations of individual stars in dwarf spheroidals (dSphs), find solar element to iron abundance ratios (e.g. Shetrone et al. 2001, 2003), which differs significantly from observed [/Fe] and [Fe/H] in the thick disk. This indicates that the accretion of systems similar to dSphs is not the dominant source of thick disk stars. As noted by Wyse (2004), all the thick disk formation scenarios allow the possibility of a portion of the thick disk stars to have originated directly from accretion.
The heating of the disk early in its violent evolution, as in scenario 2), is well supported by Galactic observations (Quillen & Garret 2001; Wyse 2000; Gilmore et al. 2002; Freeman & Bland-Hawthorn 2002; FBL). This scenario is consistent with the observed abrupt increase in velocity dispersions, the distinct chemical properties of the two disk components, and the homogeneity of thick disk abundances. We contend that our scenario of thick disk formation during the epoch of multiple mergers of gas rich building blocks is consistent with scenario 2), and hence with these observations of the Milky Ways thick disk. We note that the scenario 2) suggests two possible heating mechanisms. In the first mechanism of scenario 2), a thin disk forms and is heated by an accretion event. Evidence that the thick disk has had a more intense star formation history than the thin disk (e.g. Bensby et al. 2003; MGTB) would seem to favour the mechanism we propose over this “puffed up” thin disk, although the latter mechanism is not inconsistent with a rapid thick disk formation timescale (e.g. FBL). Our simulations more closely resembles the mechanism of Jones & Wyse (1983), in which a thick disk forms during a violent relaxation of the galactic potential, prior to the formation of the thin disk. We note also that the in situ formation of the thick disk in our scenario leads to efficient self-enrichment. Our scenario also incorporates features of scenario 3), but rather than accreting stars into the thick disk directly, our scenario envisages star formation being triggered by accretion of gas rich building blocks during a chaotic merging epoch at high redshift. The increased cooling due to metals, as mentioned in scenario 5), helps ensure a rapid star formation rate in the thick disk. Thus, although we are proposing our thick disk formation scenario as “new”, it shares features with previously proposed scenarios.
We have underway a program to examine a statistically significant number of simulated disk galaxies similar to those examined here, with varying masses, angular momentum and merging histories. This will help determine whether the properties of our thick disk-like component depend on the adopted model parameters and specific merger histories. We hope to predict the expected frequency of thick disks and to characterise thick disk properties such as age, metallicity and colour of the stellar populations.
The formation of the thick disk in the manner we have outlined is a natural consequence of the early, violent merging epoch of the CDM universe, indicating that thick disks would be a widespread component of disk galaxies. Recent, deep observations of a sample of 47 nearby edge-on galaxies by DB indicate that thick disks are almost ubiquitous around disk galaxies. A lack of correlation between thick and thin disk scale lengths, as found by DB, is also explained by our formation scenario. Confirmation of these finding would strengthen the case for our thick disk formation mechanism.
References
- (1) Abadi, M. G., Navarro, J. F. & Steinmetz M. 2003, ApJ, 597, 21
- (2) Barbanis, B.; Woltjer, L. 1967 ApJ, 150 461
- (3) Beers, T. C., Drilling, J. S., Rossi, S., Chiba, M., Rhee, J., Führmeister, Birgit, Norris, J. E. & von Hippel, T. 2002 AJ 124 931
- (4) Bekki, K. & Chiba, M. 2000, ApJ, 534, 89
- (5) Bekki, K. & Chiba, M. 2002, ApJ, 566, 245
- (6) Bensby, T., Feltzing, S., & Lundström, I. 2003, A&A, 410, 527
- (7) Brook, C. B, Kawata, D., Gibson, Brad K., & Flynn C. 2004, MNRAS, in print
- (8) Carlberg, R. G. & Sellwood, J. A. 1985 ApJ, 292, 79
- (9) Chen, Y. Q., Nissen, P. E., Zhoa, G., Zhang, H. W., & Benoni, T. 2000, A&AS, 141, 491
- (10) Chen, B., Stoughton, C., Allyn Smyth, J., et al. 2001, ApJ, 553, 184
- (11) Chiba, M., & Beers, T. C., 2000, AJ, 119, 2843
- (12) Dalcanton, J. J., & Bernstein, R. A. 2002, AJ, 124, 1328
- (13) Edvardsson, B., Anderson, J., Gustafsson, B., Lambert, D. L., Nissen, P. E. & Tomkin, J., 1993, A&A 275, 101
- (14) Feltzing, S., Bensby, T., & Lundström, I. 2003, A&A, 397, 1
- (15) Freeman, K. C., 1991 in Dynamics of Disk Galaxies, ed. B. Sundelius, (Göteborgs University and Chalmer University of Technology, Göteborg Sweden), p.15
- (16) Freeman, K. C. & Bland-Hawthorn, J. 2002 ARA&A, 40 487
- (17) Fuhrmann, K., 1998, A&A, 338, 161
- (18) Gilmore, G., Wyse, R. F. G. & Norris, J. E. 2002 ApJ 574, 39
- (19) Gilmore, G. 2003, in Galaxy Evolution: Theory and Observations eds V. Avila-Reese, C. Firmani, C. Frenk & C. Allen Rev Mex AA, CS, vol. 17, 149
- (20) Gilmore, G., Wyse, R. F. G., & Kuijken, K. 1989, ARA&A, 27, 555
- (21) Gilmore, G., Wyse, R. F. G., & Jones, J. B. 1995, AJ, 109, 3
- (22) Gilmore, G., & Reid, N. 1983, MNRAS, 202, 1025
- (23) Gilmore, G., & Wyse, R. F. G. 1985, AJ, 90, 2015
- (24) Gratton, R. G., Carretta, E., Matteucci, F., & Sneden, C. 2000, A&A, 358, 671
- (25) Habing, H. J. 1988, A&A, 200, 40
- (26) Quinn, P. J., Hernquist, L., Fullagar, D. P. 1993, ApJ 403, 74
- (27) Jones, B. J. T., & Wyse, R. F. G. 1983 A&A, 120, 165
- (28) Kawata, D. & Gibson, B. K. 2003, 2003, MNRAS, 340, 908
- (29) Katz, N. 1992, ApJ, 391, 502
- (30) Katz, N., & Gunn, J. E., 1991, ApJ, 377, 565
- (31) Larson, R. B. 1976, MNRAS 176, 31
- (32) Mashonkina, L., & Gehren, T. 2001, A&A, 376, 232
- (33) Mashonkina, L., Gehren, T., Travaglio, C., & Borkova, T. 2003, A&A, 397, 275
- (34) Martin, J. C., Morrison, H. L. 1998 AJ, 116, 1724
- (35) Nordeström et al. 2004 A&A, in press
- (36) Norris, John, 1987 in The Galaxy, ed. G. Gilmore, B. Carswell, p. 297, Dordrecht: Reidel
- (37) Nissen P. E., Schuster W. J., 1997, A&A, 326, 751
- (38) Ojha, D. K. 2001, MNRAS, 322, 426
- (39) Phelps, S., Meisenheimer, K., Fuchs, B., Wolf, C. & Jahreiss, H., 1999, in Galaxy Evolution: Connecting the Distant Universe with Local Fossil Record, Obs de Meudon, 1998.
- (40) Prochaska, J. X., Naumov, S. O., Carney, B. W., McWilliam, A., & Wolfe, A. M. 2000, ApJ, 120, 2513
- (41) Quillen A. C., and Garnett D. 2001. in Galaxy Disks and Disk Galaxies, ASP Conf. Ser., ed. G Jose, SJ Funes, EM Corsini, 230:87-88. San Francisco: Publ. Astron. Soc. Pac.
- (42) Reddy, B. E., Tomkin, J., Lambert, D. L., & Allende Prieto, C. 2003, MNRAS, 340, 304
- (43) Robin, A. C., Haywood, H., Crézé, M., Ojha, D. K., Bienaymé, O. 1996, A&A, 305, 125
- (44) Shetrone, M. D., C t , P. & Sargent, W. L. W. 2001, ApJ 548 592
- (45) Shetrone, M., Venn, K. A., Tolstoy, E., Primas, F., Hill, V. & Kaufer, A. 2003 AJ 125 684
- (46) Schröder, K. P. & Pagel, B. E. J. 2003, MNRAS, 343, 1231
- (47) Spitzer, L. & Schwarzschild, M. 1953 ApJ, 118, 106
- (48) Statler, Thomas S., 1988 ApJ, 331, 71
- (49) Strömgren, B. 1987 in The Galaxy, ed. G. Gilmore, B. Carswell, p. 297, Dordrecht: Reidel
- (50) Tautais̆ienė, G., Edvardsson, B., Tuominen, I. & Ilyin, I. 2001, A&A, 380, 578
- (51) Thacker, R. J. & Couchman, H. M. P. 2000, ApJ, 545, 728
- (52) Wyse, R. F. G. & Gilmore, G. 1988, Astron J. 95, 1404
- (53) Wyse, R. F. G. & Gilmore, G. 1995, AJ 110, 2771
- (54) Wyse R. F. G., 2000, in The Galactic Halo: From Globular Clusters to Field Stars, ed. A. Noel et al. (Liége: Inst. d’Astrophys. G ophys.), 305
- (55) Wyse R. F. G., 2004, in ‘The Local Group as an Astrophysical Laboratory’, ed. M. Livio (Cambridge, Cambridge University Press)
- (56)