Luminous infrared galaxies as plausible
-ray sources
for GLAST and IACTs
Abstract
We argue that luminous infrared galaxies (LIGs) may constitute a newly detectable population of -ray sources for the next generation of ground and space-based high energy telescopes. Additionally, we report for the first time upper limits on their fluxes using data obtained with the EGRET telescope.
1 Introduction
Diffuse -ray emission from cosmic-ray (CR) interactions with interstellar gas and photons is an important source of the -ray luminosity of the universe, although the luminosities of individual normal galaxies are relatively modest. Approximately 90% of the high-energy -ray luminosity of the Milky Way (1.3 L⊙, Strong, Moskalenko, & Reimer 2000) is diffuse emission from CR interactions with interstellar gas and photons (Hunter et al. 1997). To date, the LMC is the only external galaxy that has been detected in the light of its diffuse -ray emission (Sreekumar et al. 1992). Only upper limits have been obtained for other local group galaxies (e.g., Pavlidou & Fields 2001). At 1 Mpc, for example, the flux of the Milky Way would be approximately 2.5 photons cm-2 s-1 (100 MeV), well below the sensitivity of past -ray missions. Although normal galaxies, or even galaxies with fairly intense star formation such as the LMC, are quite numerous, their distances make them very faint -ray sources.
Luminous infrared galaxies (LIGs) are the dominant population of extragalactic objects in the local universe () at bolometric luminosities above L⊙. Some, having L⊙, are the most luminous local objects (see Sanders & Mirabel 1996 for a review). These galaxies possess very large amounts of molecular gas (e.g., Sanders 1991; Downes et al. 1992; 1993; see below). Consequently, they have large CO luminosities, but also a high value for the ratio , both being about one order of magnitude greater than for normal spirals. The latter implies, based on star formation models, a greater star formation rate per unit mass of gas. The molecular gas is often found concentrated in the central regions of the galaxies, at densities orders of magnitude larger than in Galactic giant molecular clouds. LIGs are generally regarded as recent galaxy mergers in which much of the gas of the colliding objects has fallen into a common center (typically less than 1 kpc in extent), triggering a huge starburst (e.g., Sanders et al. 1988, Melnick & Mirabel 1990).111In the case of Arp 302, however, the large CO luminosity comes from an unusually large ( M⊙) and spatially extended amount of molecular gas, while it appears to form stars at the Galactic rate (Lo et al. 1997). See below for more discussion on this issue. Evidence indicates that the infrared luminosities of LIGs are indeed due to starburst regions rather than enshrouded active galactic nuclei (AGNs). In some cases, as in Arp 299, even when a hidden AGN was observed, it cannot account for the whole FIR luminosity (Della Cecca et al. 2002).
The large masses of dense interstellar gas and the enhanced densities of supernova remnants and massive young stars suggest that LIGs may have -ray luminosities orders of magnitude greater than normal galaxies. Using a simple criterion, we explore here the prospects for detecting these objects with the next generation of -ray telescopes. A more detailed theoretical model of -ray emission for an individual LIG will be presented in a companion paper. (See Blom et al. 1997 and Paglione et al. 1996 for examples of flux estimations from nearby starburst galaxies.) Upper limits from existing EGRET data for the fluxes of likely -ray–bright LIGs are also presented.
2 Flux estimations and observability
Neglecting possible CR density gradients within the interstellar medium of a LIG, the hadronically-generated -ray number luminosity (photons per unit of time) is (see, e.g., Torres et al. 2003c and references therein for details) where represents the position within the interaction region , is the mass of gas, is the proton mass, is the number density, and is the -ray emissivity (photons per unit of time per atom). The -ray flux is then , where is the luminosity distance in a Friedman universe. In an appropriate scaling, where is the enhancement factor of CRs. The previous estimation assumes that with photons s-1 H-atom-1 and being the CR density near Earth. The numerical factor already takes into account the -ray emissivity from electron bremsstrahlung (see, e.g., Pavlidou & Fields 2003 and references therein).222Note that -rays can also be produced by inverse Compton interactions with the strong FIR field of the galaxy. However, we shall disregard this contribution in favor of the hadronic channel (between accelerated protons and diffuse material of density ), which is a well justified approach above 100 MeV (see, e.g., Paglione et al. 1996 and references therein). We also disregard additional hadronic production of high energy -rays with matter in the winds of stars (see, e.g., Romero & Torres 2003; Torres et al. 2003). Both these effects would improve the possibility for the galaxies to be detected. Note that is approximately the GLAST satellite sensitivity after 1 yr of all-sky survey. A similar estimation can be made for the TeV flux expected from these objects. Völk et al. (1996) found, , where a power law slope of 2.1 is assumed for the CR spectrum. Here, photons cm-2 s-1 is the expected 5 flux sensitivity for a 50 hr observation at small zenith angle at the new ground-based imaging atmospheric Čerenkov telescopes (IACTs). Then, those galaxies that might appear in the new GeV catalogs might also constitute new targets for the ground-based telescopes at higher energies, provided their proton spectrum are sufficiently hard. In addition, the signal-to-noise ratio in neutrino telescopes (neutrinos will be unavoidably produced in hadronic interactions leading to charged pions) can be approximately computed starting from the -ray flux (see, e.g., Anchordoqui et al. 2003). The result is that LIGs would be new candidate sources for ICECUBE if they are detectable sources of TeV photons. Once produced, photons (and of course also neutrinos) escape the FIR-dominant field of the galaxy (which can be seen using the and pair-production cross sections, Cox 1999, p.213ff, and typical LIG parameters, e.g., the kpc-radius of the central starburst where the -ray emission proceeds). In addition, the small redshifts () for the LIGs we are considering make opacities due to processes with photons of the CMB and IR-background negligible (see, e.g., Stecker 1971), so that once they escape the galaxy they may reach Earth unscathed.
3 A Plausible LIG–-ray connection
LIGs not only possess a large amount of molecular gas, but a large fraction of it is at high density (e.g., Gao & Solomon 2003a, b). This makes them prone to star formation, and thus to have significant CR enhancements. In nearby starburst galaxies, like M82 and NGC253, the supernova rate is estimated to be at least yr-1 (Rieke et al. 1980), comparable to the massive star formation rate (SFR), which is at least M⊙ yr-1 (Ulvestad et al. 1997, Forbes et al. 1993). The SFR in the LIGs is 100–1000 times larger (e.g., Gao & Solomon 2003a, Fig. 6; Pasquali et al. 2003) and scales with the amount of dense molecular gas (traced by the HCN line). Völk et al. (1989) have calculated the CR energy density of M82 from minimum energy considerations, assuming a proton/electron ratio of 100 as it is locally observed. They obtain a value eV cm-3. Suchkov et al. (1993) estimate eV cm-3 from the synchrotron flux, and an upper limit of eV cm-3 from the observed density of molecular clouds. (The H2 molecules are destroyed by CRs and hence they dominate the mass of the clouds only for a few hundred thousand years). It is natural to expect that (the central regions of) LIGs have yet bigger enhancements, comparable to the ratio between their SFRs and that of the Milky Way. Interestingly, there is evidence for the existence of extreme starbursts regions within LIGs (see, e.g., Downes & Solomon 1998). These, larger than giant molecular clouds but with densities found only in small cloud cores, appear to be the most outstanding star-forming regions in the local universe (each representing about 1000 times as many OB stars as 30 Doradus). The CR enhancement factor in these small but massive regions can well exceed the average value for the galaxy. In Arp 220, for instance, two such regions were discovered to contain about M⊙ (Downes & Solomon 1998). If the local CR enhancement there is significantly larger than the starburst average, these extreme environments could be the main origin for any -ray emission observed from this galaxy.
In order to establish the plausibility of the future detection of LIGs in the -ray band, we consider the HCN survey just presented by Gao & Solomon (2003a,b). This survey is a systematic observation (essentially, all galaxies with strong CO and IR emission were chosen for HCN survey observations) of 53 IR-bright galaxies, including 20 LIGs with L⊙, 7 with L⊙, and more than a dozen of the nearest normal spiral galaxies. It also includes a literature compilation of data for another dozen IR-bright objects. This is the largest and most sensitive HCN survey (and thus of dense interstellar mass) of galaxies to date. We have computed the minimum average value of for which the -ray flux above 100 MeV is above 2.4 photons cm-2 s-1. Luminosity distances used were those provided in the HCN survey, assuming a Hubble parameter of =75 km s-1 Mpc-1; although, since redshifts are low enough, changes in the cosmological model do not introduce significant changes in distances.
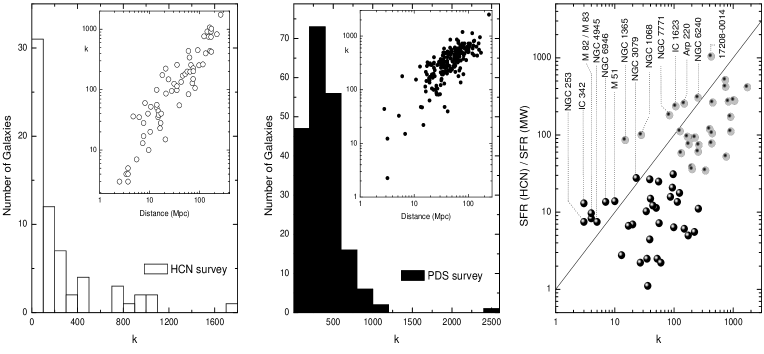
Naively, the smaller the value of , the greater the possibility for these Galaxies to appear as -ray sources. All but three objects in the HCN survey require a value to be above the GLAST satellite sensitivity, see Fig. 1 (left panel), where their luminosity distance distribution is also shown in the inset. A typical case for a plausible new GLAST source would be a LIG with L⊙, Mpc, HM⊙, and a CR enhancement of the order of 100. This enhancement is an average value over the innermost central starburst region, where most of the CO and HCN luminosity is observed (see, e.g., Taniguchi & Ohyama 1998, Gao & Solomon 2003a,b), i.e., it considers that all molecular mass in that region is illuminated by the enhanced CR spectrum. It is reasonable to expect local variations from the average , particularly if extreme starbursts regions are separate from the core, but yet it is a useful criterion for an observability study (Völk et al. 1996).
The masses used to generate Fig. 1 assume the standard conversion factors between CO or HCN luminosity and H2 molecules (Gao & Solomon 2003a,b). We note, nevertheless, that several authors presented the case for a reduction in these factors when applied to powerful starburst regions, particularly with L⊙. Downes & Solomon (1998) derived gas masses from a model of radiative transfer, finding gas masses a factor of lower than previous estimates. Solomon et al. (1997) (see also Bryant & Scoville 1999) concurred, but showed that even after reducing by such amount, still the best estimations for molecular masses in LIGs are M⊙. Thus, we retain (as suggested in the HCN survey) all estimations of mass using the standard conversion factors. (Note that most LIGs in our sample have L⊙ anyway, and that an uncertainty of a factor of a few in would not affect the plausibility for detection in most cases). Additionally, the HCN survey gives only H2 molecular mass; contributions to the full content of interstellar matter other than H2, e.g., by He, are not considered.
We have also considered the larger Pico dos Dias Survey (PDS, Coziol et al. 1998), consisting of relatively nearby and luminous galaxies selected in the FIR. PDS galaxies have a lower mean IR luminosity , redshifts smaller than 0.1, and form a complete sample limited in flux in the FIR at erg cm-2 s-1. CO or other line measurements for most of the PDS galaxies are currently unavailable. Thus, in order to get a first insight as to how many PDS galaxies could appear as -ray sources for GLAST we have applied the correlation between the and , which is tight throughout three orders of magnitude (see e.g., Solomon et al. 1992, Gao & Solomon 2003a,b), to deduce .333It is important to notice, while analyzing the PDS sample, that the correlations derived in the HCN survey entertain the IR luminosity, not the FIR luminosity. Then, one needs to recompute –starting from the IRAS Catalog– the IR luminosities of all PDS starbursts when applying such correlation. We then use the correlation between and , which is tight for less luminous galaxies such as those in the PDS (see Fig. 3 of Gao & Solomon 2003a), to estimate the total amount of molecular gas. 153 out of 203 PDS galaxies (75%) need an average enhancement to appear as -ray sources in the next generation of catalogs. In the middle panel of Fig. 1 we show the distribution of CR enhancements required for GLAST detection as well as, in the inset, the luminosity distances for all galaxies in the PDS. These distributions appear different from those corresponding to HCN galaxies. The reason is that the PDS galaxies are less IR-luminous than the latter, contain less molecular mass, and thus require larger enhancement factors (typically a factor of 3–5 larger than a typical case in the HCN survey) to be detectable by GLAST. Quantitatively, only 5% of the PDS galaxies have star formation rates larger than 100 M⊙ yr-1 (just 10 galaxies out of 203), the largest being 255 M⊙ yr-1. This has to be compared with 20% of the HCN galaxies having the same characteristics, with the largest star formation rate being 660 M⊙ yr-1. Then, remarkably, even when PDS galaxies are still IR-bright, we do not expect most of them to appear in the GLAST catalog.
The reason why this is so is more clearly seen in the right panel of Fig. 1. There we show, for the HCN Galaxies, a plausible value of the CR enhancement (obtained as the ratio between the SFR of the galaxy and that of our Milky Way444The latter is also obtained from the correlations given in the HCN survey, i.e., from the Milky Way’s HCN luminosity (e.g., Solomon et al. 1992, Wild & Eckart 2000) as SFR(MW)=M⊙) M⊙ yr-1= K km s-1 pc2) M⊙ yr-1. In any case, we note that the value of for our Galaxy is uncertain and thus this panel should be taken as indicative, not as a precise prediction of .) versus the needed value of in order to make the galaxy detectable by GLAST. Galaxies appearing above or around the line of unit slope are prime candidates for detection. While a galaxy with high ratio (i.e., with a high mass fraction of dense gas) will be a LIG (or a ULIG), the converse is not always true (Gao & Solomon 2003a). There are gas-rich galaxies which are LIGs only because of the huge amount of molecular gas they possess, not because they have most of it at high density (and thus are undergoing a strong starburst phenomenon). In some of these cases, while the value of enhancement needed for detection might only be of a few hundreds, the plausible value of is much lower, since no strong star formation is ongoing.555For example, in the HCN survey, there are a group of 7 LIGs (out of 31) that are gas-rich (CO-luminous) but have normal star formation efficiency (i.e., ). Some examples are NGC 1144, Mrk 1027, NGC 6701, and Arp 55. They are using the huge molecular mass they have in creating stars at a normal SFR. In the context of -ray observability, GLAST will detect those galaxies that, being close enough, not only shine in the FIR but that do so because of their active strong star formation processes.
In any case, since there are good candidates for detection in both surveys we suggest that both the HCN and PDS samples be taken into account when planning population analyses with the next generation of catalogs of point-like -ray sources.
4 The EGRET data
We consider a sample of galaxies, a sub-sample of the HCN survey also observed with the Owens Valley Radio Observatory (Scoville et al. 1991) and the IRAM interferometer (Downes & Solomon 1998, see also Taniguchi and Ohyama 1998), for an investigation regarding the presently available -ray data. These galaxies are shown in Table 1. There, distances are obtained from their NED redshifts under the assumption that km s-1 Mpc-1 and . For their molecular mass content, IR, and CO luminosities see the HCN survey, op. cit.
Data from the Energetic Gamma Ray Experiment Telescope (EGRET) aboard the Compton Gamma Ray Observatory (CGRO) at energies above 100 MeV were co-added and analyzed at the respective locations of the candidate objects. We present 95% confidence upper limits for the energy selection E MeV. They were obtained by a likelihood analysis (Mattox et al. 1996) from data throughout the CGRO observation cycles 1 to 9. The established EGRET sources from the 3EG catalog (Hartman et al. 1999) were included in the background model at the fluxes estimated by the likelihood algorithm. None of the seventeen LIGs we investigated have been detected, which is, in fact, consistent with the level of flux expected from LIGs (i.e., fluxes above GLAST sensitivity but below the EGRET one). The likelihood test statistic, TS, was maximal for NGC2146, corresponding to a statistical significance of 1.9. Upper limits on the -ray fluxes were obtained from the likelihood analysis. Table 1 lists these upper limits in units of cm-2 s-1. Two of the candidate sources have significant PSF-overlap with known EGRET sources: NGC3079 is 1.6 degrees away from 3EG J0952+5501, and NGC520 is 1.8 degrees away from 3EG J0118+0248. The former is a high-probability blazar-class AGN identification (0954+556); the latter, a tentative AGN identification (0119+041, a FSRQ, as suggested in Hartman et al. 1999, or 0113+0222, a narrow-line radio galaxy at z=0.05 as proposed in Sowards-Emmerd et al. 2003). In both cases, the flux upper limit has been determined under full modeling and subtraction of the respective EGRET source. Except in cases of a source location near the galactic plane (NGC2146), the upper limits determined for the fluxes are consistently on the order of a few cm-2 s-1.
5 Concluding remarks
There are several LIGs (among them the paradigmatic Arp 220, which we shall analyze in detail elsewhere) for which reasonable values of CR enhancements, comparable to, or lower than, the ratio between their SFR and the Milky Way’s, can provide a -ray flux above GLAST sensitivity, and if the CR spectrum is sufficiently hard, also above the sensitivities of the new Čerenkov telescopes. Some LIGs are then most likely to appear as new point-like -ray sources. Even when it is natural to expect that a LIG will emit copious -rays, only the more gaseous, nearby, and CR-enhanced galaxies are the ones which could be detected as point sources. Note that only non-variable -ray sources can be ascribed to LIGs. Variability indices (Torres et al. 2001, Nolan et al. 2003) can then play a role in the acceptance or rejection of possible counterparts of LIGs. The EGRET instrument was unable to detect LIGs, at least the small sample explored in this Letter. Flux upper limits at the source locations were imposed from EGRET data which are consistent with the expected level of -ray emission from LIGs.
The work of DFT was performed under the auspices of the U.S. Department of Energy (NNSA) by UC’s LLNL under contract No. W-7405-Eng-48. Support for OR by the Bundesministerium für Bildung und Forschung through DLR, grant 50 QV 0002 is gratefully acknowledged. ED-S acknowledges the Ministry of Science and Technology of Spain for financial support and the IGPP/LLNL for hospitality. We acknowledge Y. Gao, G. Romero, and the Referee, V. Pavlidou, for their insightful remarks.
| Name | |||
|---|---|---|---|
| [Mpc] | [photons cm-2 s-1] | [photons s-1] | |
| NGC3079 | 15 | 4.4 | 1.2 |
| NGC1068 | 15 | 3.6 | 9.6 |
| NGC2146 | 20 | 9.7 | 4.6 |
| NGC4038/9 | 22 | 3.7 | 2.1 |
| NGC520 | 29 | 4.6 | 4.6 |
| IC694 | 41 | 2.2 | 4.4 |
| Zw049.057 | 52 | 6.9 | 2.2 |
| NGC1614 | 64 | 5.0 | 2.4 |
| NGC7469 | 65 | 3.2 | 1.6 |
| NGC828 | 72 | 6.1 | 3.7 |
| Arp220 | 72 | 6.1 | 3.7 |
| VV114 | 80 | 3.9 | 2.9 |
| Arp193 | 94 | 5.2 | 5.4 |
| NGC6240 | 98 | 6.4 | 7.3 |
| Mrk273 | 152 | 2.3 | 6.3 |
| IRAS 172080014 | 173 | 7.5 | 2.6 |
| VIIZw31 | 217 | 3.2 | 1.7 |
References
- (1) Anchordoqui, L. A., et al. 2003, ApJ, 589, 481
- (2) Blom, J. J., Paglione, T. A. D., & Carramiñana, A. 1999, ApJ, 516, 744
- (3) Bryant, P. M., & Scoville, N. Z. 1999, ApJ, 117, 2632
- (4) Cox, A. N. 1999, Allen’s Astrophysical Quantities, Springer Verlag, New York
- (5) Coziol, R., et al. 1998, ApJS, 119, 239
- (6) Della Cecca, R., et al. 2002, ApJ, 581, L9
- (7) Downes, D., & Solomon, P.M. 1998, ApJ, 507, 615
- (8) Downes, D., Solomon, P. M., & , Radford, S. J. E. 1993, ApJ, 414, L13
- (9) Forbes, D.A., et al. 1993, ApJ, 406, L11
- (10) Gao, Y., & Solomon, P. M. 2003a, astro-ph/0310339
- (11) Gao, Y., & Solomon, P. M. 2003b, astro-ph/0310341
- (12) Hartman, R. C., et al. 1999, ApJS, 123, 79
- (13) Hunter, S. D., et al. 1997, ApJ, 481, 205
- (14) Lo, K.Y., Gao, Y. & Gruendl, R. A. 1997, ApJ, 475, 103
- (15) Mattox, J. R., et al. 1996, ApJ 461, 396
- (16) Mücke, A., & Pohl, M. 2000, MNRAS, 312, 177
- (17) Nolan, P., Tompkins, W., Grenier, I. & Michelson, P. 2003, ApJ, 597, 615
- (18) Paglione, T. A. D., et al. 1996, ApJ, 460, 295
- (19) Pasquali, A., Gallagher, J. S., & de Grijs, R. 2003, astro-ph/0308163, A&A, in press.
- (20) Pavlidou, V., & Fields, B. 2001, ApJ, 558, 63
- (21) Pavlidou, V., & Fields, B. 2002, ApJ, 575, L5
- (22) Romero, G. E., & Torres, D. F. 2003, ApJ, 586, L33
- (23) Rieke, G. H., Lebofsky, M. J., Thompson, R. I., Low, F. J., & Tokunaga, A. T. 1980, ApJ, 238, 24
- (24) Sanders, D. B., & Mirabel, I. F. 1996, ARA&A, 34, 749
- (25) Scoville, N. Z., et al. 1991, ApJ, 366, L5
- (26) Suchkov, A., Allen, R. J., & Heckman, T. M. 1993, ApJ, 413, 542
- (27) Solomon, P. M., Downes, D., & Radford, S. J. E. 1992, ApJ, 387, L55
- (28) Solomon, P. M., Radford, S. J. E., & Downes, D., 1990, ApJ, 348, L53
- (29) Solomon, P. M., Downes, D., Radford, S. J. E., & Barrett, J. W. 1997, ApJ, 478, 144
- (30) Sowards-Emmerd, D., Romani, R. W. & Michelson, P. F. 2002, ApJ, 509, 109
- (31) Sreekumar, P., et al. 1992, ApJ, 400, L67
- (32) Stecker, F. W., 1971, Cosmic Gamma Rays, NASA SP-249
- (33) Strong, A. W., Moskalenko, I. V., & Reimer, O. 2000, ApJ, 537, 763
- (34) Taniguchi, Y., & Ohyama, Y. 1998, ApJ, 509, L89
- (35) Torres, D. F., et al. 2001, A&A, 370, 468
- (36) Torres, D. F., Domingo-Santamaría E., & Romero G. E. 2003, ApJ, 601, L75
- (37) Torres, D. F., et al. 2003c, Physics Reports, 382, 303
- (38) Ulvestad, J.S., & Antonucci R.R.J. 1997, ApJ, 488, 621
- (39) Völk, H. J., Aharonian, F. A., & Breitschwerdt, D. 1996, SSRv, 75, 279
- (40) Völk, H. J., Klein, U., & Wielebinski, R. 1989, A&A, 213, L12
- (41) Wild, W., & Eckart A. 2000, A&A 359, 483
- (42) Yao, L., Seaquist, E.R., Kuno, N., & Dunne, L. 2003, ApJ, 588, 771