The Angular Size and Proper Motion of the Afterglow of
GRB 030329
Abstract
The bright, nearby (z=0.1685) gamma-ray burst of 29 March 2003 has presented us with the first opportunity to directly image the expansion of a GRB. This burst reached flux density levels at centimeter wavelengths more than 50 times brighter than any previously studied event. Here we present the results of a VLBI campaign using the VLBA, VLA, Green Bank, Effelsberg, Arecibo, and Westerbork telescopes that resolves the radio afterglow of GRB 030329 and constrains its rate of expansion. The size of the afterglow is found to be 0.07 mas (0.2 pc) 25 days after the burst, and 0.17 mas (0.5 pc) 83 days after the burst, indicating an average velocity of 3-5. This expansion is consistent with expectations of the standard fireball model. We measure the projected proper motion of GRB 030329 in the sky to 0.3 mas in the 80 days following the burst. In observations taken 52 days after the burst we detect an additional compact component at a distance from the main component of 0.28 0.05 mas (0.80 pc). The presence of this component is not expected from the standard model.
1 Introduction
The fireball model has provided a remarkably successful framework in which to interpret observations of gamma-ray bursts (GRBs) and their afterglows (see Mészáros 2002 for a recent review). Among the earliest observational tests of this model was the superluminal motion inferred for GRB 970508 (Frail et al. 1997). Large fluctuations in the radio flux density on timescales of several hours were attributed to diffractive scattering of the radio waves as they propagated through the turbulent ionized gas of our galaxy (Goodman 1997). The observed “quenching” of this scintillation pattern at 2 weeks lead to a determination of a size of 3 as, implying a mean apparent motion of 4 which was consistent with estimates from an expanding shock (Frail et al. 1997; Waxman, Kulkarni & Frail 1998). The motion appears superluminal due to a geometric effect first described by Rees (1966). This size measurement was independently supported by constraints derived from late-time calorimetry of GRB 970508 (Frail, Waxman & Kulkarni 2000).
While interstellar scintillation can be a powerful tool to test predictions of GRB afterglow models, such observations are rare. Most GRBs are expected to remain in the strong diffractive regime for only a few days (Goodman 1997; Walker 1998), and hence there are practical difficulties obtaining well-sampled light curves. Nearby GRBs (), although equally rare, enable us to image the afterglow directly, measuring the expansion or proper motion of the emitting region (Waxman 1997; Sari 1999; Granot, Piran & Sari 1999; Granot & Loeb 2003). Previous applications of the technique of Very Long Baseline Interferometry (VLBI) did not yield constraining limits on the angular size for distant GRBs () (Taylor et al. 1997, 1998). This situation changed with the detection of GRB 030329 by the HETE-II spacecraft (Vanderspek & others 2003). At (Greiner et al. 2003a) GRB 030329 is one of the nearest GRBs detected to date, and also the brightest. At centimeter wavelengths it reached peak flux densities of 50 mJy, motivating us to undertake a comprehensive multi-epoch VLBI program. In this paper we describe the results of the first five epochs covering the time between 3 and 83 days after the burst.
2 Observations and Results
The five epochs are summarized in Table 1. All observations employed the Very Long Baseline Array (VLBA) of the NRAO111The National Radio Astronomy Observatory is operated by Associated Universities, Inc., under cooperative agreement with the National Science Foundation.. Other telescopes used in one or more epochs include the Effelsberg 100-m telescope222The 100-m telescope at Effelsberg is operated by the Max-Planck-Institut für Radioastronomie in Bonn., the phased VLA, the Green Bank Telescope (GBT), the Arecibo telescope, and the Westerbork (WSRT) tied array. The observing runs were typically 5 hours long, with 256 Mbps recording in full polarization with 2 bit sampling. The nearby (1.5∘) source J1051+2119 was used for phase-referencing with a 2:1 minute cycle on source:calibrator below 15 GHz and a 1.3:1 minute cycle on source:calibrator at 15 GHz and above. The weak calibrator J1048+2115 was observed hourly to check on the quality of the phase referencing. Self-calibration was used to further refine the calibration and remove atmospheric phase errors when the signal-to-noise was sufficient.
From our 8.4 GHz observations on April 6 we derive a 3 limit on the linear polarization of 0.16 mJy/beam, which corresponds to a limit on the fractional polarization of 1.0%. In a contemporaneous optical observation Greiner et al. (2003b) measure a polarization of 2.2+/-0.3%. The decrease in polarization at lower frequencies could be explained as the result of the source being optically thick at 8.4 GHz at these early times.
For each observation listed in Table 1 we fit a circular Gaussian to the measured visibilities to derive angular diameters (or limits). For components that are slightly resolved, a Gaussian, uniform disk, and ring all have a similar quadratic dependence on baseline length for the short baselines (Pearson 1999). There are some differences in scaling in that a Gaussian with size 1 mas FWHM is equivalent to a uniform disk with diameter 1.6 mas, or to a ring with diameter 1.1 mas. The results of the Gaussian fits are summarized in Table 2. Note that sizes smaller than the synthesized beam are measurable because of the high signal-to-noise. Significant source sizes of 70 as and 170 as are measured on April 22 and June 20, respectively. Uncertainties in the size estimates were derived from the signal-to-noise ratios and the synthesised beam. As a further check, we performed 100 Monte-Carlo simulations of the data using identical () coverage, similar noise properties, and a Gaussian component of known size added. We found the variance of the recovered sizes, by modelfitting in the same way we treat the observations, to be a factor of two lower than the estimated 1 uncertainties shown in Table 1.
The Gaussian fits made to the measured visibility data as a function of baseline length returned residuals consistent with noise in all but one case. The fit to the 15 GHz observation on May 19 produces a significant residual (20 sigma) which is 30% of the peak flux density and offset to the northeast at 0.28 0.05 mas from the main component. The exact nature of this second component is not known but it would require an average velocity of 19 to reach its offset from the flux centroid. This component is not detected in the less sensitive 22 GHz image taken on the same day, nor was it seen in the fifth epoch at 8.4 GHz.
In addition to angular size, a best fit position was derived for each observation in Table 1. These positions are listed in Table 2, expressed for convenience as offsets from the 8.6 GHz position on April 1, and plotted in Fig. 1. Error bars were estimated from the variation in the position of GRB 030329 over the course of the observation, added in quadrature with an estimated systematic uncertainty in the position of 0.2 mas. This systematic term arises from imperfect modeling of the atmosphere and is roughly proportional to the angular separation between the phase-reference calibrator and the target source. Note that the two observations at 5 GHz suffer from a large, systematic offset, most likely due to the increased contribution of the ionosphere at this frequency. The phase check source, J1048+2115, exhibited a similar systematic offset at 5 GHz. Discarding the measurements at 5 GHz, and solving for proper motion, we derive mas yr-1 and mas yr-1, or an angular displacement over the first 80 days of 0.100.14 mas.
3 Constraints on GRB Afterglow Models
3.1 Angular Size Measurements
A gamma-ray burst drives a relativistic blast wave into a circumburst medium of density whose radius is related to the energy of the explosion approximately by , where is the bulk Lorentz factor of the fireball. A more precise description of the dynamics is given by the Blandford & McKee (1976) solution. The apparent radius of the relativistic blast wave as seen by a distant observer viewing a GRB close to face on is approximately . A calculation by Galama et al. (2003) for constant density gives,
| (1) |
where is the isotropic energy normalized to erg and is the time in days in the observers frame. The coefficient in Eqn. 1 is the same as in Granot, Piran & Sari (1999) but it is 6% larger than the estimate by (Waxman, Kulkarni & Frail 1998). A circumburst medium shaped by mass loss from a massive progenitor star is expected to have a density that falls off with radius as , where is a constant, typically normalized to A=5 g cm-1 (i.e., values for the mass loss rate and wind velocity of a typical WR star). Chevalier & Li (2000) give estimates for the line-of-sight radius and Lorentz factor in a wind-blown medium but for consistency we use Galama et al. (2003):
| (2) |
Assuming a Lambda cosmology with km/s/Mpc, and , the angular-diameter distance of GRB 030329 at is Mpc. Thus the angular diameters corresponding to the radii in Eqns.1 and 2 are as and as for the ISM and Wind models, respectively.
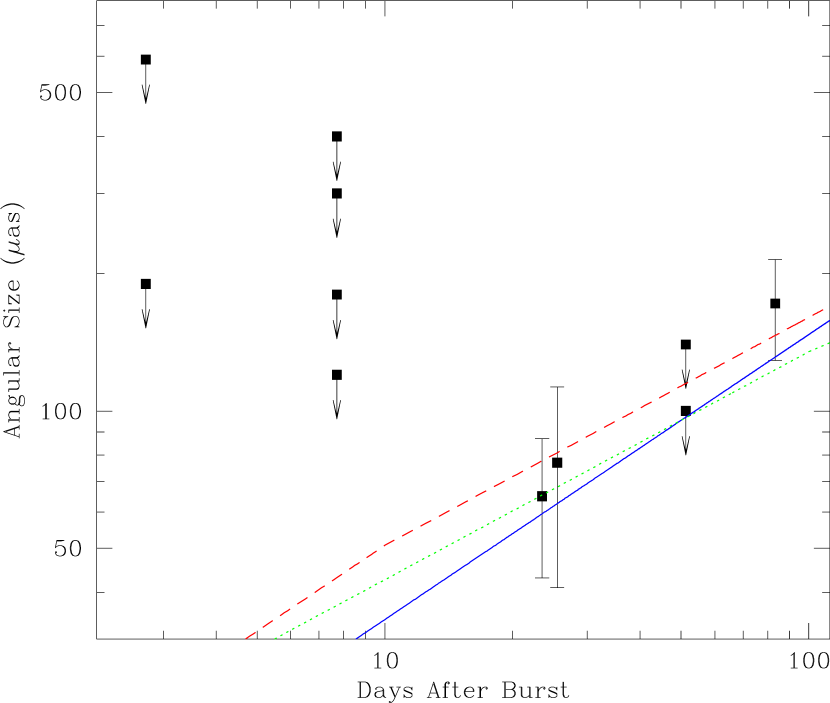
The measured sizes 24 and 83 days after the burst give average apparent perpendicular expansion velocities of 5 and 3 respectively. Based on energetics and breaks in the light curves, typical GRBs appear to be collimated into a cone of angle, radians (Berger, Kulkarni, & Frail 2003), which we must be within to see the gamma-rays. Since the apparent expansion, , is given by , then to get an apparent superluminal expansion of 5 requires Lorentz factors of 7, and values of close to unity. These values for are much larger than 0.1 found in simulations by Cannizzo, Gehrels, & Vishniac (2004).
In Fig. 2 we show the evolution of the expected angular size of GRB 030329 for the ISM and Wind models for some representative values of (or ) and jet break times. There is good agreement from the predictions of the isotropic models with our measurements (Table 2). The size estimates in the ISM model are more robust than the wind model in the sense that they are relatively insensitive to the ratio of , yielding values of 60 as and 130 as for at =25 and =83 days, respectively.
The introduction of a jet raises the energy requirements substantially. Part of this increase may be due to our limited understanding of how to describe the lateral expansion of a GRB jet. However, for d an acceptable fit is obtained for 10 (or 7) and a best fit for 30. For d acceptable fits for either the ISM or wind models require 100.
There exists a wide range of energy estimates for GRB 030329 in the literature. Vanderspek et al. (2004) estimate an isotropic gamma-ray energy release E erg. Allowing for a reasonable radiative efficiency =0.2 (Panaitescu & Kumar 2001), =9. A jet-break seen at 0.5 d in the X-ray and optical light curves (Price et al. 2003; Tiengo et al. 2003) reduces this energy by a factor about 400. However, Granot, Nakar & Piran (2003) in explaining the unusual fluctuations in the optical light curve, increase the energy by an factor of 10 by having the afterglow shock “refreshed” by slower moving ejecta shells.
3.2 Proper Motion Limits
In the relativistic fireball model a shift in the flux centroid is expected due to the spreading of the jet ejecta (Sari 1999). For a jet viewed off the main axis the shift can be substantial (Granot & Loeb 2003). However, since gamma-rays were detected from GRB 030329 it is likely that we are viewing the jet largely on axis. The predicted displacement in this case is expected to be small (0.02 mas), and well below our measured limit over 80 days of 0.100.14 mas (see §2).
Proper motion in the cannonball model originates from the superluminal motion of plasmoids ejected during a supernova explosion with 1000 (Dado, Dar & De Rújula 2003). Dar & De Rújula (2003) predicted a displacement of 2 mas over the 80 days of our VLBI experiment assuming plasmoids propagating in a constant density medium. This estimate was revised downward to 0.55 mas by incorporating plasmoid interactions with density inhomogeneities at a distance of 100 pc within a wind-blown medium (Dado, Dar & De Rujula 2004). Neither variant of this model are consistent with our proper motion limits. A more general problem for the cannonball model is the absence of rapid fluctuations in the radio light curves of GRB 030329 (Berger et al. 2003). Strong diffractive scintillation is expected between 1 and 5 GHz with a modulation index of order unity and a timescale of a few hours, because the size of the plasmoids (0.01 as) always remain below the Fresnel scale (5 as) of the turbulent ionized medium (Taylor & Cordes 1993; Walker 1998). Strong and persistent intensity variations in centimeter radio light curves for all GRBs are expected in the cannonball model. Strong intensity variations are not seen for GRB 030329, nor are they expected for the relativistic blastwave model. Our angular size measurements in §3.1 and Fig. 2 suggest that the expanding fireball is too large after the first few days to exhibit diffractive scintillation. There are moderate variations seen in the radio light curves of GRB 030329 (25% at 4.9 GHz, 15% at 8.5 GHz and 8% at 15 GHz) which decrease by a factor of three from 3 to 40 d after the burst. Berger et al. (2003) have attributed this behavior to an expanding fireball undergoing weak interstellar scintillation and derive a size for GRB 030329 of 20 as at =15 d. However, the details of the change in modulation index depend on knowing the distance of the screen, the transition frequency between weak and strong ISS, and the geometry of the scattering region.
4 Conclusions
We present the first images directly resolving a GRB afterglow 25 and 83 days after the explosion. The observed expansion velocity of 3-5 can be fit with standard fireball models. We estimate the energetics of the burst to have an isotropic equivalent energy, , divided by the ambient density of assuming a jet break at 10 days, and expansion into a constant density circumburst medium. Our measurements also place stringent upper limits on the proper motion of the fireball to less than 0.3 mas over the 80 days covered, or 1.4 mas/year. These limits are also consistent with the standard fireball model. Much less easy to explain is the single observation 52 days after the burst of an additional radio component 0.28 mas northeast of the main afterglow. This component requires a high average velocity of and cannot be readily explained by any of the standard models. Since it is only seen at a single frequency, it is remotely possible that this image is an artifact of the calibration. Other nearby GRBs would benefit from more frequent time sampling to search for the presence of similar high-velocity components.
References
- Berger et al. (2003) Berger, E. et al. 2003, Nature, 426, 154.
- Berger, Kulkarni, & Frail (2003) Berger, E., Kulkarni, S. R., & Frail, D. A. 2003, ApJ, 590, 379.
- Blandford & McKee (1976) Blandford, R. D. and McKee, C. F. 1976, Phys. of Fluids, 19, 1130.
- Cannizzo, Gehrels, & Vishniac (2004) Cannizzo, J. K., Gehrels, N., & Vishniac, E. T. 2004, ApJ, 601, 380.
- Chevalier & Li (2000) Chevalier, R. A. and Li, Z. 2000, ApJ, 536, 195.
- Dado, Dar & De Rújula (2003) Dado, S., Dar, A., and De Rújula, A. 2003, A&A, 401, 243.
- Dado, Dar & De Rujula (2004) Dado, S., Dar, A., and De Rujula, A. 2004, astro-ph/0402374.
- Dar & de Rujula (2003) Dar, A. and de Rujula, A. 2003, GRB Circular Network, 2133, 1.
- Frail et al. (1997) Frail, D. A., Kulkarni, S. R., Nicastro, S. R., Feroci, M., and Taylor, G. B. 1997, Nature, 389, 261.
- Frail, Waxman & Kulkarni (2000) Frail, D. A., Waxman, E., and Kulkarni, S. R. 2000, ApJ, 537, 191.
- Galama et al. (2003) Galama, T. J., Frail, D. A., Sari, R., Berger, E., Taylor, G. B., and Kulkarni, S. R. 2003, ApJ, 585, 899.
- Goodman (1997) Goodman, J. 1997, New Astr., 2(5), 449.
- Granot & Loeb (2003) Granot, J. and Loeb, A. 2003, ApJ, 593, L81.
- Granot, Nakar & Piran (2003) Granot, J., Nakar, E., and Piran, T. 2003, Nature, 426, 138.
- Granot, Piran & Sari (1999) Granot, J., Piran, T., and Sari, R. 1999, ApJ, 513, 679.
- Greiner et al. (2003a) Greiner, J., Peimbert, M., Estaban, C., Kaufer, A., Jaunsen, A., Smoke, J., Klose, S., and Reimer, O. 2003, GRB Circular Network, 2020, 1.
- Greiner et al. (2003b) Greiner, J., et al. 2003, Nature, 426, 157
- Lipkin et al. (2004) Lipkin et al. 2004, ApJ in press; astro-ph/0312594.
- Mészáros (2002) Mészáros, P. 2002, Ann. Rev. Astr. Ap., 40, 137.
- Panaitescu & Kumar (2001) Panaitescu, A. and Kumar, P. 2001, ApJ, 560, L49.
- Pearson (1999) Pearson, T. J. 1999, ASP Conf. Ser. 180: Synthesis Imaging in Radio Astronomy II, 335
- Price et al. (2003) Price, P. A. et al. 2003, Nature, 423, 844.
- Rees (1966) Rees, M. J. 1966, Nature, 211, 468.
- Sari (1999) Sari, R. 1999, ApJ, 524, L43.
- Taylor et al. (1998) Taylor, G. B., Beasley, A. J., Frail, D. A., and Kulkarni, S. R. 1998, in Huntsville Gamma-Ray Burst Symposium, 571+.
- Taylor et al. (1997) Taylor, G. B., Frail, D. A., Beasley, A. J., and Kulkarni, S. R. 1997, Nature, 389, 263.
- Taylor & Cordes (1993) Taylor, J. H. and Cordes, J. M. 1993, ApJ, 411, 674.
- Tiengo et al. (2003) Tiengo, A., Mereghetti, S., Ghisellini, G., Rossi, E., Ghirlanda, G., and Schartel, N. 2003, A&A, 409, 983.
- Vanderspek & others (2003) Vanderspek, R. and others 2003, GRB Circular Network, 1997, 1.
- Vanderspek et al. (2004) Vanderspek, R. et al. 2004, submitted to ApJ; astro-ph/0401311.
- Walker (1998) Walker, M. A. 1998, MNRAS, 294, 307.
- Waxman (1997) Waxman, E. 1997, ApJ, 491, L19.
- Waxman, Kulkarni & Frail (1998) Waxman, E., Kulkarni, S. R., and Frail, D. A. 1998, ApJ, 497, 288.
- Willingale et al. (2004) Willingale, R. et al. 2004, MNRAS in press;astro-ph/0307561.
| Date | Frequency | Integ. Time | BW | Polar. | Instrument | |
|---|---|---|---|---|---|---|
| (days) | (GHz) | (min) | (MHz) | |||
| 01 Apr 2003 | 2.73 | 4.617 | 108 | 16 | 2 | VLBA |
| 4.995 | 108 | 16 | 2 | VLBA | ||
| 8.421 | 114 | 16 | 2 | VLBA | ||
| 8.869 | 114 | 16 | 2 | VLBA | ||
| 06 Apr 2003 | 7.71 | 4.617 | 102 | 16 | 2 | VLBA |
| 4.995 | 102 | 16 | 2 | VLBA | ||
| 8.421 | 96 | 16 | 2 | VLBA | ||
| 8.869 | 96 | 16 | 2 | VLBA | ||
| 15.354 | 12 | 32 | 2 | VLBA | ||
| 22.222 | 6 | 32 | 2 | VLBA | ||
| 22 Apr 2003 | 24.5 | 15.354 | 96 | 32 | 2 | VLBA+EB |
| 22.222 | 104 | 32 | 2 | VLBA+EB | ||
| 19 May 2003 | 51.3 | 15.354 | 90 | 32 | 2 | VLBA+EB+Y27+GBT |
| 22.222 | 118 | 32 | 2 | VLBA+EB+Y27+GBT | ||
| 20 Jun 2003 | 83.3 | 8.409 | 138 | 32 | 2 | VLBA+EB+Y27+WB+AR |
| Epoch | Freq. | rms | Beam | RAoffset | DECoffset | size | Selfcal? | |
|---|---|---|---|---|---|---|---|---|
| (GHz) | (mJy) | (mJy) | (mas) | (mas) | (mas) | (mas) | ||
| (1) | (2) | (3) | (4) | (5) | (6) | (7) | (8) | (9) |
| 01 Apr 2003 | 4.8 | 3.0 | 0.10 | 2.17 0.99 | 0.66 0.56 | 0.12 0.56 | 0.59 | N |
| 8.6 | 8.3 | 0.16 | 1.24 0.57 | 0.0 0.22 | 0.0 0.30 | 0.19 | N | |
| 06 Apr 2003 | 4.8 | 5.1 | 0.11 | 2.23 1.05 | 0.56 0.56 | 0.15 0.56 | 0.40 | N |
| 8.6 | 15.4 | 0.08 | 1.28 0.58 | 0.07 0.2 | 0.25 0.2 | 0.30 | Y | |
| 15.4 | 26.8 | 0.39 | 1.16 0.39 | 0.24 0.2 | 0.06 0.2 | 0.12 | Y | |
| 22.2 | 36.0 | 0.80 | 1.00 0.47 | 0.29 0.2 | 0.26 0.2 | 0.18 | Y | |
| 22 Apr 2003 | 16.2 | 14.1 | 0.12 | 0.74 0.26 | 0.25 0.2 | 0.35 0.2 | 0.065 0.022 | Y |
| 22.2 | 11.1 | 0.22 | 0.52 0.18 | 0.26 0.2 | 0.25 0.2 | 0.077 0.036 | Y | |
| 19 May 2003 | 15.4 | 4.0 | 0.08 | 0.67 0.24 | 0.11 0.2 | 0.40 0.2 | 0.10 | Y |
| 22.2 | 4.0 | 0.14 | 0.57 0.19 | 0.31 0.2 | 0.03 0.2 | 0.14 | Y | |
| 20 Jun 2003 | 8.4 | 3.0 | 0.03 | 0.97 0.53 | 0.03 0.2 | 0.24 0.2 | 0.172 0.043 | Y |