THE COOLING FLOW CLUSTER ABELL 2626 AND THE ASSOCIATED RADIO EMISSION
Abstract
We present VLA data at 330 MHz and 1.5 GHz of the radio emission observed in the cooling flow cluster A2626. By producing images at different resolutions we found that the radio source consists of different components: an unresolved core plus a jet-like feature, two elongated parallel features, and an extended diffuse emission (radio mini-halo). Low resolution images allow us to derive morphological and spectral information of the diffuse emission: the radio mini-halo is extended on a scale comparable to that of the cooling flow region and is characterized by amorphous morphology, lack of polarized flux and very steep spectrum which steepens with distance from the center. We then applied to this new mini-halo source a model for particle re–acceleration in cooling flows (Gitti, Brunetti & Setti 2002). In particular, we found that its main radio properties (brightness profile, integrated radio spectrum and radial spectral steepening) can be accounted for by the synchrotron radiation from relic relativistic electrons in the cluster, which are efficiently re-accelerated by MHD turbulence amplified by the compression of the cluster magnetic field in the cooling flow region.
1 Introduction
The cluster A2626 (z=0.0604) is a good candidate to study the interaction between the X–ray emitting intra–cluster medium (ICM) and radio emitting plasma in clusters of galaxies. This cluster hosts a relatively strong cooling flow (White, Jones & Forman 1997) and contains a very unusual radio source exhibiting a compact unresolved core and a diffuse structure (Roland et al. 1985; Burns 1990). Earlier radio observations showed that the compact component is associated with the centrally dominant elliptical galaxy (Owen, Ledlow, & Keel 1995), while the diffuse emission has no optical counterpart. Comparisons with X–ray data revealed an enhanced X–ray emission spatially coincident with the radio source, thus providing strong observational evidence for a connection between the hot, X–ray gas and the radio plasma. In addition, the X–ray map of the cooling flow region shows an elongation coincident with the diffuse radio component (Rizza et al. 2000).
We studied in detail the radio properties of A2626 in order to better investigate the nature of the interaction between the ICM and the radio plasma and in particular the origin of the diffuse radio emission in the core of cooling flow clusters.
A Hubble constant is assumed in this paper, therefore at the distance of A2626 corresponds to 95 kpc. The radio spectral index is defined such as .
2 Radio properties of A2626: analysis of VLA archive data
We have analyzed VLA archive data of A2626 at the frequencies MHz and GHz and at different resolutions with the aim to derive the surface brightness map, the total spectral index and the spectral index distribution of the diffuse radio emission. Standard data reduction was done using the National Radio Astronomy Observatory (NRAO) AIPS package.
2.1 Radio analysis at GHz
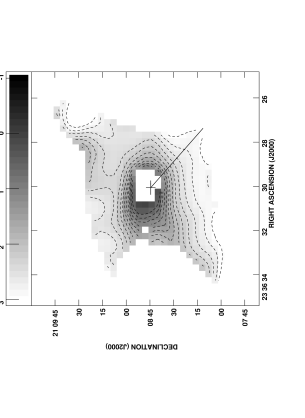
We used the 1.5 GHz C array data to produce low resolution image with a circular restoring beam of 17 arcsec. The 1.5 GHz map (Fig. 1) shows an unresolved core and a diffuse boxy–shaped emission extended for , corresponding to about 190 kpc. No significant polarized flux is detected, leading to a polarization upper limit of %. An unrelated source (associated with the S0 galaxy IC5337 at the same redshift of the cluster) is present to the west of the diffuse emission, with a total flux density of 3.9 mJy.


By using the 1.5 GHz B array data we produced the high resolution image (Fig. 2) with a restoring beam of arcsec. The central component is found to consist of an unresolved core, plus a jet-like feature pointing to the south-western direction. The extended emission is resolved out and two elongated parallel features of similar brightness and extent are detected. The flux density of the central component, the short jet included, is mJy, in agreement with Roland et al. (1985).
In order to estimate the total integrated flux density of the diffuse radio emission at 1.5 GHz and derive the surface brightness map and spectral trend, we subtracted the emission from the central nuclear source. This subtraction allows us to derive a good estimate of the total flux density of the diffuse emission ( mJy).
As discussed in Gitti et al. (2004), we believe that the elongated structures visible in Fig. 2 are distinct (or that they may represent an earlier evolutionary stage) from the diffuse emission, and that the diffuse radio source may belong to the mini–halo class. The total flux density of these structures is mJy, thus contributing to only 20 % of the flux of the diffuse radio emission. Since we are interested in studying and modeling the diffuse radio emission, we produced a new low–resolution map at 1.5 GHz where these discrete radio features have been subtracted (Fig. 3). To be conservative, the region in which the surface brightness is affected by the central emission (within the circle in Fig. 3) has been excluded in modeling the diffuse radio emission (see Sect. 3).
2.2 Radio map at MHz
We used the 330 MHz B+DnC array data to produce low resolution images with a circular restoring beam of 17 arcsec. The imaging procedure was performed using data with uv coverage matching that at 1.5 GHz. The diffuse structure at 330 MHz (Fig. 4) consists of two elongated almost parallel features located to the north and south of the core, respectively. No radio emission is detected at the location of the 1.5 GHz radio nucleus. Assuming for the 330 MHz core flux an upper limit of 3, we obtain that the radio core has an inverted spectrum (Table LABEL:8.12_gitti_risradio.tab). The total flux density of the diffuse emission is Jy. The unrelated source, detected at 1.5 GHz to the west of the diffuse radio emission, is not detected at 330 MHz; this implies a spectrum with 0.6.

2.3 Spectral index distribution
Due to the lack of a high–resolution image, the two elongated features cannot be subtracted at 330 MHz as done at 1.5 GHz. Therefore, in deriving the spectral information of the diffuse emission we considered for consistency the low–resolution images in Fig. 1 and 4, which both include the contribution of the two features to the total flux. The integrated spectral index of the diffuse emission between MHz and GHz is .
In Fig. 5 we show a grey scale image of the spectral index map of the diffuse radio emission between MHz and GHz. The spectrum steepens from the central region towards the north and south direction, with the spectral index increasing from 1.2 to 3.
2.4 Summary
The radio results are summarized in Table LABEL:8.12_gitti_risradio.tab.
| Emission | |||
|---|---|---|---|
| (mJy) | (mJy) | () | |
| Nuclear | 9.3 | ||
| Diffuse |
The extended radio source observed at the center of A2626 is characterized by amorphous morphology, lack of polarized flux and a very steep spectrum that steepens with distance from the center. Finally, the size of the diffuse radio emission is comparable to that of the cooling flow region (Rizza et al. 2000). These results indicate that the diffuse radio source may be classified as a mini–halo.
3 Model for electron re–acceleration in cooling flows: origin of radio mini–halos
3.1 Overview of the model
Gitti, Brunetti & Setti (2002) developed a model for radio mini–halos consisting in the re–acceleration of relic relativistic electrons by MHD turbulence via Fermi–like processes, with the necessary energetics supplied by the cooling flow.
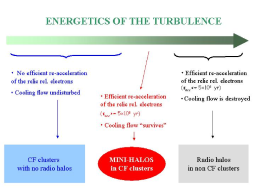
The MHD turbulence is assumed to be frozen into the flow of the thermal ICM and is thus amplified due to the compression of the turbulent coherence length scale and the amplification of the magnetic field in the cooling flow region. However, the seed large–scale turbulence (before the amplification) must not be too high in order to avoid the disruption of the cooling flow. There is thus a fine–tuning of the turbulent energy to produce diffuse radio emission from a cooling flow cluster: in the picture of the model the physical conditions of mini–halo clusters are intermediate between those which lead to the formation of extended radio halos, hosted by non–cooling flow clusters, and those holding in cooling flow clusters without radio halos (see Fig. 6).
3.2 Model application to A2626
In order to test the predictions of the model we have calculated the following expected observable properties: total spectrum, brightness profile, and steepening of the spectrum with the distance from the center. The expected brightness profile and radial spectral steepening in the model were compared to the observed profiles along the radial direction indicated in Fig. 5. We found that the model is able to reproduce all the observational constraints of A2626 for physically–meaningful values of the parameters (Table LABEL:8.12_gitti_model.tab). The application of the model to A2626 is discussed in detail in Gitti et al. (2004).
| Magnetic field | Electron | |
| at the cooling radius | energetics | |
| 1.2-1.6 G | erg | 0.7 % |
3.3 Conclusions
The main radio properties of the mini–halo observed in A2626 can be accounted for by the model. We found that only a small fraction of the cooling flow power should be converted into electron re–acceleration. Therefore we conclude the cooling flow process is able to provide sufficient energy to power the radio mini–halo in A2626.
Acknowledgments
It is a pleasure to acknowledge my collaborators G. Brunetti, L. Feretti and G. Setti. I would also like to thank K. Dyer and L. Sjouwerman for organizing this intresting Conference. This work was partly supported by the CNR grant CNRG00CF0A, by the Italian Ministry for University and Research (MIUR) under grant Cofin 2001-02-8773 and by the Austrian Science Foundation FWF under grant P15868.
References
- Burns (1990) Burns J. O. 1990, AJ 99, 14
- Gitti, Brunetti & Setti (2002) Gitti, M., Brunetti, G., & Setti, G. 2002, A&A, 386, 456
- Gitti et al. (2004) Gitti, M., Brunetti, G., Feretti, L. & Setti, G. 2004, A&A, 417, 1
- Owen, Ledlow & Keel (1995) Owen, F.N., Ledlow, M.J., Keel, W.C. 1995, AJ, 109, 140
- Rizza et al. (2000) Rizza E., Loken C., Bliton M., Roettiger K., & Burns J.O. 2000, AJ, 119, 21
- Roland et al. (1985) Roland, J., Hanish, R. J., Véron P., & Fomalont, E. 1985, A&A, 148, 323
- White, Jones & Forman (1997) White, D. A., Jones, C., & Forman, W. 1997, MNRAS, 292, 419