First Polarimetry results of two candidate
high-mass protostellar objects
We present m imaging polarimetry of two high-mass star forming regions – W48 and S152. Within these regions we have identified two candidate high-mass protostellar objects – W48W and S152SE. The submillimetre continuum emission from the candidate HMPOs is bright in comparison to the nearby H ii regions. W48W is a cold dense source, with no radio or mid-infrared emission. S152SE has an IRAS source IRAS 22566 +5828 in the Southwestern part of the region, which appears in the mid-infrared m emission, but there is no radio emission. The m data shows another core within the region, in the Northeast. The polarimetry is ordered and the degree of polarisation is high over the candidate HMPOs – for W48W and for S152SE. Polarimetry results of this nature indicate a strong, ordered magnetic field threading the candidate HMPOs. The magnetic field direction in both S152SE and W48W is perpendicular to the direction of elongation of the cloud which would imply collapse along the field lines. Estimates of the magnetic field strength are derived using the Chandrasekhar & Fermi method. We calculate plane of the sky field strengths of 0.7 mG for W48W and 0.2 mG for S152SE. We discuss the drawbacks of using the Chandrasekhar & Fermi method with a large beam size. Mass-to-flux ratios have been calculated and both clouds are found to be roughly critical.
Key Words.:
ISM: magnetic fields – ISM: individual objects: W48, S152 – stars: formation – techniques: polarimetric – submillimetre1 Introduction
Theoretical and observational studies of low mass star formation have lead to an evolutionary scenario based on the identification and studies of what are referred to as Class 0-III young stellar objects (YSOs) (Shu et al. 1987; Lada 1987; André et al. 1993; Boss 1997, 2002; Shirley et al. 2002). The precise details, such as outflow mechanisms and magnetic fields are still not definite, but understanding is improving (Bachiller et al. 1995; Cernicharo & Reipurth 1996; Cabrit et al. 1997; Königl & Pruditz 2000; Fiege & Henriksen 1996a, b; Crutcher et al. 1993; Mouschovias & Spitzer 1976). The earliest stages of star formation are of particular interest, as this is the stage where the highest rates of accretion occur along with the onset of outflows. The youngest protostars - the class 0 YSOs - are somewhat difficult to observe since they are enshrouded with dust and so suffer large amounts of extinction.
High mass star formation is not as clearly understood. Very few studies have been carried out on the earliest stages of high mass star formation compared to low mass (e.g. Beuther et al. 2002a; Evans et al. 2002). This is generally because regions of high mass star formation are located at greater distances than the low mass star forming regions, and given that high mass star formation takes place on shorter evolutionary timescales, coupled with the statistical rarity of massive stars, it is difficult to locate and observe high mass stars in the process of formation – the so-called high-mass protostellar objects (HMPOs). Surveys searching for HMPOs are attempting to overcome this, in particular Sridharan et al. (2002) and Beuther et al. (2002b), who use a colour selected, radio-quiet IRAS sample, and Thompson et al. (2002) who are searching for HMPOs in the vicinity of ultra-compact H ii (UCH ii) regions.
Mapping magnetic fields may yield vital information on the function of magnetic fields in star formation. Submillimetre polarimetry is one of the best ways to study the magnetic field. Spinning dust grains align themselves with the magnetic field, producing polarised thermal emission which can then be measured and used to trace the magnetic field structure projected onto the plane of the sky.
In a bid to understand the magnetic field structures in the envelopes of YSOs we have obtained submillimetre imaging polarimetry of a sample of high and low mass YSOs using the JCMT in Hawaii. In this paper we present results from two high mass regions – W48 and S152. The two sources were selected as part of a larger sample of high-mass star forming regions. They were not selected specifically to find candidate HMPOs.
2 Observations and Data Reduction
The observations were carried out at the James Clerk Maxwell Telescope (JCMT) in Hawaii using the Submillimetre Common User Bolometer Array (SCUBA) camera (Holland et al. 1999) together with the polarimetry module (Greaves et al. 2003) mounted on the entrance window of SCUBA. The data were obtained using the jiggle mapping mode, and a 16 point jiggle map was completed for each of the 16 different positions of the half-wave retarder (separated by 22.5∘). This process was repeated 8 times for W48, giving an integration time of 2.3 hours and 9 times (2.6 hours) for S152. The chop-throw was 150″ with a position angle of 0∘ in local coordinates for W48, and 140″ with a position angle of 90∘ in azimuthal coordinates for S152. The chop-throw size and position angle were chosen carefully to ensure that the telescope was not chopping onto other sources, contaminating the data.
Data reduction was carried out using SCUBA User Reduction Facility (SURF) (Jenness & Lightfoot 1998) commands. The nod of the telescope and the flatfield corrections were carried out in the usual ways, with the extinction correction using the calculated from the (Archibald et al. 2002) (measured to be 0.08 throughout observations of W48 and 0.07 for S152) for the time of the observation, calculated from polynomials fitted to measurements of taken throughout each night of observing. Noise observations were used to identify and ‘switch off’ any excessively noisy bolometers so that they took no further part in the data reduction. Sky removal of the data was carried out using bolometers with no significant flux from the source in order to remove sky noise from the data.
Once the instrumental polarisation was calculated and removed on a bolometer-by-bolometer basis, the data were combined together to produce final maps in the three Stoke’s parameters, I, Q and U using POLPACK software (Berry & Gledhill 2001). The Stoke’s parameters were calculated by fitting the following curve (Sparks & Axon 1999) to the data:
| (1) |
Where is the expected intensity in image , is the wire-grid analyser transmission factor, is the analyser polarising efficiency factor and is the effective retarder position angle after correction for the parallactic angle for image .
These were then combined to calculate the polarised intensity, P, and the position angles:
| (2) |
| (3) |
where is the position angle of the polarisation vectors.
The uncertainties in each of these quantities are given by:
| (4) |
| (5) |
where is the signal-to-noise in .
The vectors were selected so that all have errors in polarisation of less than 0.5% for W48 and and 0.75% for S152. The error limit was selected to be different for the two sources as the size of the S152 region meant that telescope offsets were required to cover the source, resulting in each pixel receiving less integration time relative to W48. The vectors are clipped on the polarisation errors instead of signal-to-noise as clipping on the latter would result in disposing of points where the polarisation is low.
Finally, flux calibration (Jenness et al. 2002) was carried out using observations of Uranus and CRL2688 for W48 and S152 respectively. The flux calibration factors (FCFs) on each night of observing were calculated to be 2.02 Jy/arcsec2/V for W48 and 1.82 Jy/arcsec2/V for S152. These FCFs were then applied to the data.
3 Results & Discussion
3.1 Submillimetre Polarimetry
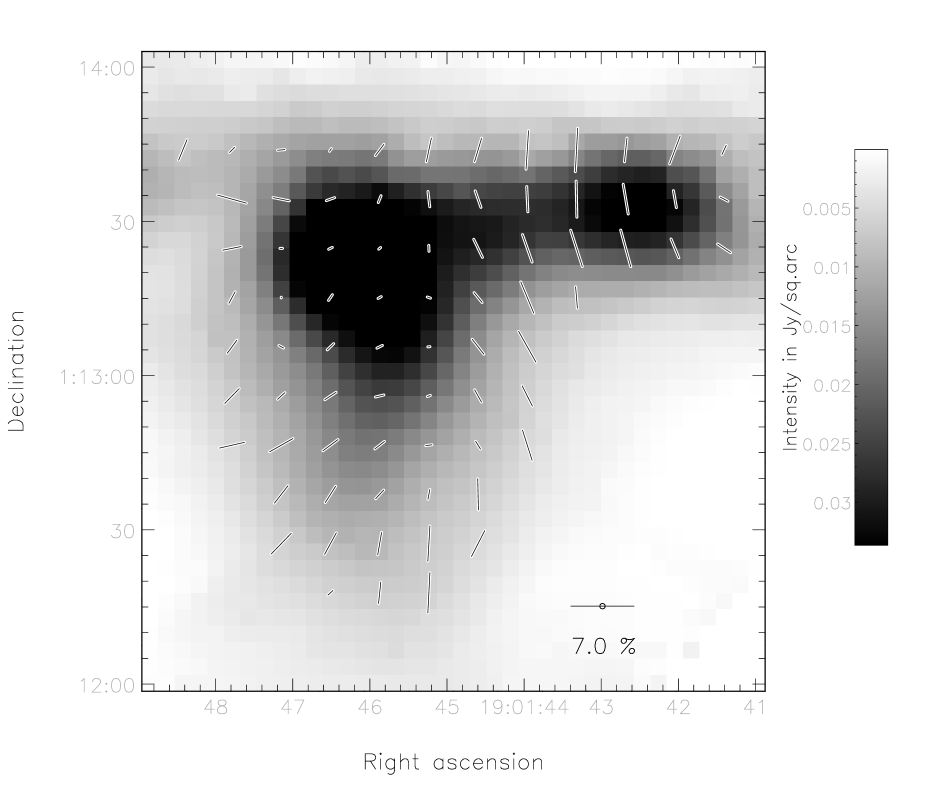
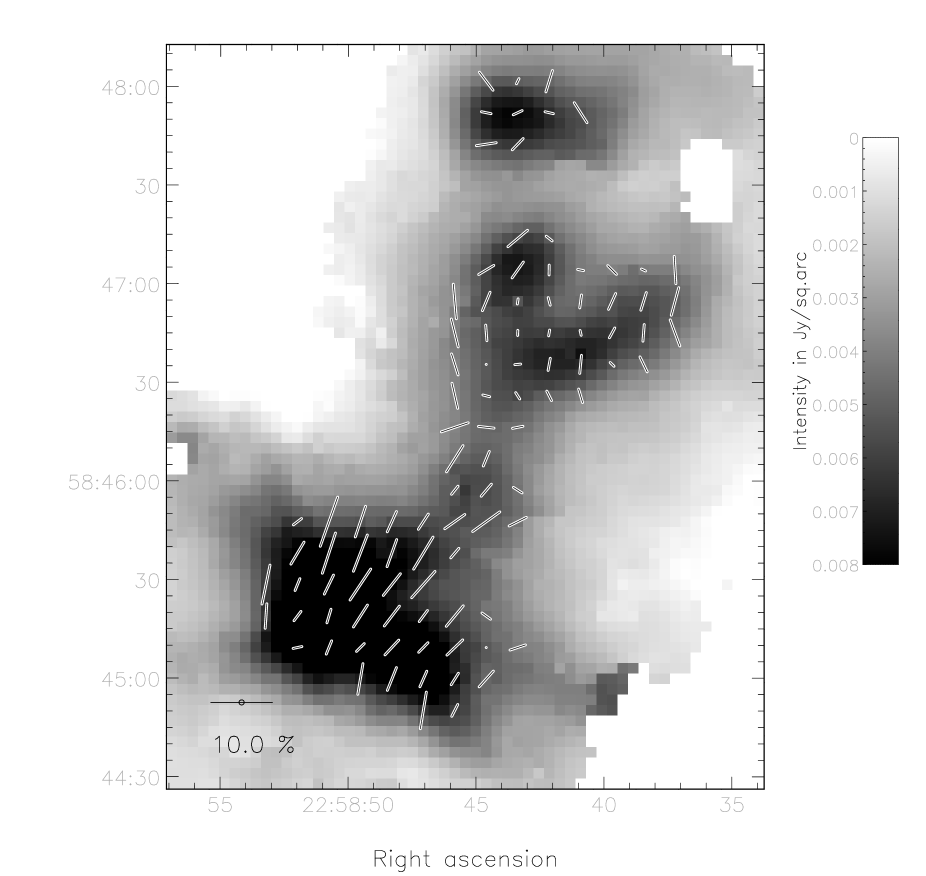
Figures 1 and 2 present the data observed with the JCMT. The greyscale is the Stoke’s I, or the intensity of the thermal emission (850m) from dust grains, the vectors represent the direction of the magnetic field on the plane of the sky (the measured E vectors rotated through 90∘). The length of the vectors indicate the degree of polarisation.
The massive star forming region W48 (Fig. 1) is a Galactic H ii region at a distance of about 3.4 kpc (Vallée & MacLeod 1990) and is 1.3∘ to the East of the supernova remnant W44. Numerous infra-red sources have been detected towards W48, including IRS1 and IRS2 (Zeilik & Lada 1978), along with H2O and OH masers (Jenness, Scott & Padman 1995; Turner 1979; Genzel & Downes 1977; Hofner & Churchwell 1996; Caswell 2001).
Fig. 1 shows that W48 has two submillimetre cores, the main, bright core in the East, W48main, and the smaller core in the West, W48W. The two cores appear to be connected by a ridge of dust and gas. In the Northwest of W48main the polarimetry B-vectors have a North-South direction, perpendicular to the ridge connecting the two cores. The degree of polarisation drops with increasing intensity, from 2% towards the edge of the source, to 0.5% towards the intensity peak. This has been observed in many sources, including W51 (Chrysostomou et al. 2002), Bok globules (Henning et al. 2001) and the OMC (Matthews et al. 2002). Explanations for this decrease in polarisation with increasing intensity include i) a twisting magnetic field towards the centre of the core, resulting in a lower net polarisation percentage – due to cancellation effects within the beam, ii) a lower grain alignment efficiency towards the centre of the core – producing more unpolarised emission, and iii) the dust particles may be more spherical in regions of high density, which also produces more unpolarised emission, resulting in a lower percentage polarisation.
The polarimetry across the submm source W48W and the ridge connecting it to W48main is ordered (total variance in the position angle, 0.05 radians2) with a high (6%) degree of polarisation. There is no evidence of a decrease in polarisation with intensity towards the centre of W48W.
Figure 2 shows the complex region Sharpless 152 (Sharpless 1959). Located at a distance of 5kpc (Wouterloot et al. 1993), S152 forms part of a physical pair with the nearby region S152 (Pismis 1990). Numerous H2O and OH masers have been studied towards this source (Jenness, Scott & Padman 1995; Wouterloot & Habing 1985; Henkel et al. 1986). The S152 H ii region is located in the Northwest of the imaged region in Fig. 2, where the ridge splits in two. The polarimetry in this region indicates that the magnetic field is North-South in direction (in the plane of the sky), aligning with the North-South ridge.
In the Southeast of the imaged region there is a submillimetre bright core S152SE. This is the first time that this source has been observed in the submillimetre continuum, with the S152 H ii region having only been observed in the submillimetre previously by Jenness, Scott & Padman (1995). The polarimetry implies that the magnetic field lines are perpendicular to the direction of elongation of the source, suggestive of collapse along the field lines. The degree of polarisation is relatively high (8%) across the region S152SE. In the Southwest part of S152SE there is an IRAS source (IRAS 22566+5828).
3.2 Comparison with 1.4GHz and 8.28m emission
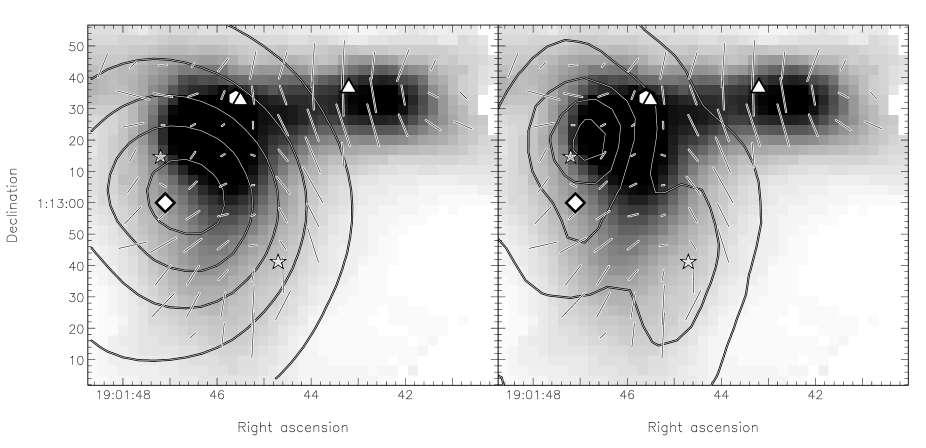
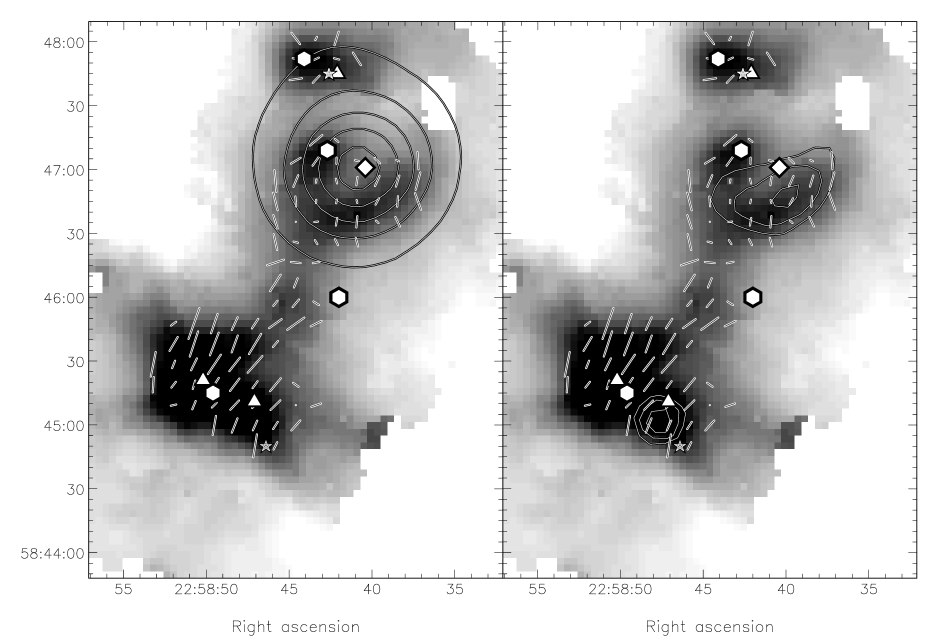
We have obtained 1.4GHz emission maps of the W48 and S152 regions, downloaded from the NRAO/VLA Sky Survey library (NVSS) (Condon et al. 1998). Also, we obtained mid-infrared data of both of these regions at 8.28m (A band) downloaded from the Midcourse Space Experiment (MSX) catalogue. Figs 3 and 4 show contour plots of the 1.4GHz and MSX A-band emission overlaid onto our submillimetre measurements.
The left panel of Fig. 3 shows the W48 region imaged with SCUBA, with contours of the 1.4GHz continuum emission. The radio emission aligns well with the H ii region to the SE of the main submillimetre core. There is no radio emission associated with W48W. The right panel of Fig. 3 shows MSX A-band (8.28 m) mid-infrared data contoured over the SCUBA data. The infra-red emission occurs only over the main source, indicating that the Western source, W48W, is cold.
Figure 4 shows the 1.4GHz emission (left panel) and MSX A-band data (right panel) contoured over the SCUBA data of S152. The 1.4GHz emission traces the H ii region, as marked by the white diamond. The MSX data reveal that there is infrared emission from the dust ridges that are close to the H ii region, indicating that they are warm. There is also what appears to be a point source of warm emission in the submillimetre bright Southeastern source S152SE. This is probably associated with the IRAS source 22566+5828, marked by the white star as the offset could be due to the large error of the IRAS position, which encompasses the MSX source, or a temperature/optical depth effect.
Comparisons of the SCUBA, MSX and NVSS 1.4GHz emission indicate that both W48W and S152SE are cold, dense regions of gas and dust. This suggests that they could be candidate HMPOs at an early stage of evolution. Most current HMPO surveys (e.g. Sridharan et al. 2002) use selection criteria which include only the more evolved HMPOs for study. W48W and S152SE are too cold to be included in these surveys, which are based on the IRAS Point Source Catalog, indicating that there may be many more young HMPOs which may only be indentified through submillimetre surveys.
3.3 Masers
Maser emission is common among star forming regions, specifically H2O, OH, methanol and ammonia maser emission. Maser emission is a good indicator of star formation as it only occurs in regions of high density. It has been shown that H2O maser emission traces the earliest evolutionary stages of massive stars (Codella et al. 1994; Palumbo et al. 1994; Codella & Felli 1995; Codella et al. 1995; Codella, Felli & Natale 1996; Codella, Testi & Cesaroni 1997; Testi et al. 1997; Felli et al. 1997).
There are many masers within the regions observed. W48 has H2O and OH masers located around the W48main submm core. Whilst no maser emission has been detected on the source W48W, there has been a detection of an H2O maser close to the source, on the ridge connecting the two cores. This indicates that the ridge and/or W48W is the site for early star formation, supporting the idea of W48W being a candidate HMPO. The location of the masers are indicated on Fig. 3.
Numerous masers have been detected towards S152, mainly H2O and SiO, with H2O masers having been studied in S152SE. Again, only H2O masers have been discovered in this region indicating that the region is possibly undergoing the earliest stages of cloud collapse, again supporting the idea that S152SE is a candidate HMPO. Fig 4 shows the location of the masers in this region.
3.4 Masses of Candidate HMPOs
The mass of the clumps can be calculated via the relation:
| (6) |
where is the gas-to-dust ratio, is the flux density of the clump, the distance to the clump, the absorption coefficient at frequency , and is the Planck function at frequency for a blackbody of temperature of .
Using a gas-to-dust ratio of 100:1 (Hildebrand 1983), and an absorption coefficient at 850 m of 0.15 m2 kg-1 estimated from Ossenkopf & Henning (1994) based on a number density of nH = 105 cm-3, thick ice mantles and a formation timescale of 105 years, temperatures of 20K, flux densities and radii measured from the SCUBA data listed in table 1, along with the distances quoted in table 1, we calculate the masses to be 1500 M☉ and 3500 M☉ respectively.
The mass of these objects are subject to the uncertainties within the parameters used, specifically the gas-to-dust ratio, which could be as small as 45:1 (McCutcheon et al. 1995). Also, the absorption coefficient at 850 m has still not been determined precisely (Hildebrand 1983; Chini et al. 2001). The value adopted in this paper from Ossenkopf & Henning (1994) agrees with the values determined by Bianchi et al. (2003) and Visser et al. (2002).
3.5 Magnetic Field Strength
It is important to try to establish the magnetic field strength as well as the magnetic field morphology in these regions for a more complete understanding of the contribution of magnetic fields to the star formation process. Estimates of the magnetic field strength can be gained through use of the Zeeman effect and the Chandrasekhar & Fermi (1953) (CF) method. The Zeeman effect uses line splitting to calculate the strength of the line-of-sight component of the field, while the CF method estimates the strength of the plane of sky field based on the dispersion of position angles of the polarisation vectors. The CF method is applicable here and leads to estimates of 0.65 mG for W48W and 0.2 mG for S152SE. The parameters used are shown in table 1.
| (7) |
where is the mean density (g cm-3), the line-of-sight velocity dispersion (cm s-1), is the dispersion in polarisation position angles and is corrected for measurement errors () where is in (rad), and is a correction factor found to be 0.5 (Ostriker, Stone & Gammie 2001).
| Object | RA | Dec | Distance | Flux | Radius | Mass | Density1 | Bpos | ||
|---|---|---|---|---|---|---|---|---|---|---|
| (J2000) | (J2000) | (kpc) | (Jy) | (cm) | (M☉) | (g cm-3) | (cm s-1) | (rad) | (mG) | |
| W48W | 19 01 42.5 | +1 13 33 | 3.4 | 22 | 9 1017 | 1500 | 1 10-18 | 8 104 | 0.22 | 0.65 |
| S152SE | 22 58 50 | +58 45 22 | 5 | 22 | 2.3 1018 | 3500 | 1 10-19 | 8 104 | 0.26 | 0.2 |
1 Assuming spherical geometry.
The CF method should be used with caution when calculating the magnetic field strength with data of this resolution, as it can over-estimate the field strength. The large beam size of the JCMT means that small scale tangling of the magnetic field can occur within a beam, so the measured vectors only represent the net magnetic field within the beam. Heitsch et al. (2001) used their models to test the effects of limited resolution on the observed field structure and the CF method of calculating the mean field strength. They conclude that small-scale variations were completely supressed, resulting in the impression of a more homogeneous field, and when this is the case, the magnetic field strength is over-estimated by a factor of 2 for field strengths consistent with molecular clouds. However, they purposefully leave out any information on the polarisation percentage p, which would decrease where tangling of the magnetic field occurs. In order to avoid over-estimating the magnetic field, we have only used the candidate HMPO regions for our field strength estimates as the field is presumed a-priori to be homogeneous, and there is no decrease in the degree of polarisation which implies that on large-scales the magnetic field is not tangled. We have also applied the correction factor (Ostriker, Stone & Gammie 2001) of 0.5, consistent with the findings of Heitsch et al. (2001).
Uncertainties in our estimates of the magnetic field strength arise from calculating the density of the clumps, which incorporates the errors involved in calculating the mass. Also, errors in calculating the volume of the clump contribute as a spherical geometry has been assumed for each clump. The velocity of the gas within the clump introduces another error as a FWHM of 2 kms-1 has been used but it may be anywhere between 1 kms-1 and 3 kms-1 (Brand et al. 2001; Thompson & Macdonald 2003). Measurement errors are also introduced by the angle , although these are relatively small in comparison to the other errors stated.
3.6 Cloud Support
The virial theorem provides a gross method of analysing the stability of the clumps. We will simply estimate the values of the various energy terms to see how much support is provided by bulk motions and magnetic pressure against collapse. Applying our magnetic field strengths to the Virial Theorem:
| (8) |
(McKee et al. 1993) where is the gravitational constant, is the mass of the clump, the radius, the turbulent velocity of the gas (FWHM) and B the magnetic field strength in Gauss.
Substituting values from table 1 into Eq. 8, it can be shown that the gravitational energy is of the order of the sum of the kinetic and magnetic energy terms, indicating the clouds are gravitationally bound or contracting.
There are currently two models of star formation; star formation driven by ambipolar diffusion and that driven by turbulence. The ambipolar diffusion model of star formation (Ciolek & Mouschovias 1994) is based on subcritical clouds that at first contract via ambipolar diffusion. When the central parts become supercritical, the magnetic field cannot support the core and it collapses dynamically. The turbulence model of star formation states that turbulence provides support against cloud collapse, as the magnetic field is too weak to provide support (the core is supercritical).
To determine the importance of the magnetic field as a support mechanism, the mass to flux ratio can be used.
| (9) |
where we take the critical value to be:
| (10) |
(Mestel 1999). If the ratio is lower than the critical value ( 1), the cloud is said to be subcritical, and the magnetic field can support the cloud perpendicular to the field direction irrespective of external pressure. We calculate mass-to-flux ratios, in units of the critical ratio, of 1.2 for W48W, using a magnetic field strength of 0.65 mG, and 1.3 for S152SE using a magnetic field strength of 0.2 mG. This implies that both W48W and S152SE are close to critical.
The value of the numerical coefficient in Eq. 10 is model-dependent, with Eq. 10 representing the model for a spherical cloud inclusive of surface terms. Mestel (1999) also calculates a numerical coefficient of 0.2 for an extreme spheroidal model of eccentricity 1, whereas Nakano & Nakamura (1978) use a value of 0.4 for a disk-like model (ignoring surface terms), and Crutcher (2003) uses a value of 0.2 for a spherical model (ignoring surface terms). This leads to ranges in of for W48W and for S152SE. These calculations of are based on the plane of the sky magnetic field strength, Bpos. If the magnetic field does not lie entirely in the plane of the sky in these regions, the actual magnetic field strength will be greater than that calculated, and therefore the value of will decrease.
Previous studies of magnetic fields (see Crutcher 2003, for a review) have all indicated critical/supercritical star forming cores, with the only subcritical results being for the diffuse ISM and HI clouds. Crutcher (2003a) studied prestellar cores, and found that after corrections for geometry applied statistically, they were approximately critical. These are at roughly the same evolutionary stage as HMPOs, but are the low-mass equivalent. Our results are consistent with W48W and S152SE being very early stage HMPOs, and are found to be close to critical.
4 Conclusions
We present the first submillimetre polarimetry data taken towards HMPOs, found in the vicinity of the W48 and S152 H ii regions. The polarimetry across W48 is complicated. There is a drop in the polarisation percentage with increasing intensity which may be explained by twisting of the magnetic field towards the centre of the core, or by relatively increased emission from unaligned dust grains. Polarimetry of S152 indicates that the plane of sky magnetic field has a North-South direction across the H ii region.
Comparisons of our submillimetre continuum data with 8.28m and 1.4GHz emission indicate that W48W and S152SE are candidate HMPOs, at an early stage of evolution. The presence of water masers in these areas supports this hypothesis. Both candidate HMPOs exhibit high degrees of polarisation (6–8%) and CF calculations provide estimates of the plane of sky magnetic field strength of 0.65mG for W48W and 0.2mG for S152SE.
The polarisation vectors are well aligned in both regions, indicating the magnetic field lines are perpendicular to the direction of elongation and imply collapse along field lines. This polarimetry pattern has been predicted using models of subcritical cores collapsing under the effect of gravity and ambipolar drift (see Padoan et al. 2001), although our estimates of show that these clouds are close to critical and as such we are unable to rule out turbulence driven star formation models.
Acknowledgements.
The JCMT is operated by the Joint Astronomy Centre in Hilo, Hawaii on behalf of the parent organizations Particle Physics and Astronomy Research Council in the United Kingdom, the National Research Council of Canada and The Netherlands Organization for Scientific Research. This research made use of data products from the Midcourse Space Experiment. Processing of the data was funded by the Ballistic Missile Defense Organization with additional support from NASA Office of Space Science. This research has also made use of the NASA/IPAC Infrared Science Archive, which is operated by the Jet Propulsion Laboratory, California Institute of Technology, under contract with the National Aeronautics and Space Administration. The authors acknowledge the data analysis facilities provided by the Starlink Project which is run by CCLRC on behalf of PPARC. The authors would like to thank our referee, Richard Crutcher, for careful reading of the original manuscript and useful comments.References
- André et al. (1993) André, P., Ward-Thompson, D. & Barsony, M., 1993, ApJ, 406, 122
- Archibald et al. (2002) Archibald, E.N., Jenness, T., Holland, W.S. et al., 2002, MNRAS, 336, 1
- Bachiller et al. (1995) Bachiller, R., Guilloteau, S., Dutrey, A., et al. 1995, A&A, 299, 857
- Berry & Gledhill (2001) Berry, D.S., & Gledhill, T.M., 2001, Starink User Note 233.5
- Beuther et al. (2002a) Beuther, H., Schilke, P., Gueth, F. et al. 2002, A&A, 387, 931
- Beuther et al. (2002b) Beuther, H., Schilke, P., Menten, K.M., et al. 2002, ApJ, 566, 945
- Bianchi et al. (2003) Bianchi. S., Gonçalves, J., Albecht, M., et al. 2003, A&A, 399 43
- Boss (1997) Boss, A.P., 1997, ApJ, 483, 309
- Boss (2002) Boss, A.P., 2002, ApJ, 568, 743
- Brand et al. (2001) Brand, J., Cesaroni, R., Palla, F., et al. 2001, A&A, 370, 230
- Cabrit et al. (1997) Cabrit, S., Raga, A., & Gueth, F., 1997, in Herbig-Haro Flows and the Birth of Stars, IAU Symposium No.182, eds. B. Reipurth & C. Bertout.(Dordrecht: Kluwer), 163
- Caswell (2001) Caswell, J.L. 2001, MNRAS, 326, 805
- Cernicharo & Reipurth (1996) Cernicharo, J., & Reipurth, B., 1996, ApJ, 460L, 57
- Chandrasekhar & Fermi (1953) Chandrasekhar, S., & Fermi, E., 1953, ApJ, 118, 113
- Chini et al. (2001) Chini, R., Ward-Thompson, D., Kirk, J.M., et al. 2001, A&A, 369, 155
- Chrysostomou et al. (2002) Chrysostomou, A., Aitken, D.K., Jenness, T. et al. 2002, A&A, 385, 1014
- Ciolek & Mouschovias (1994) Ciolek, G.E., & Mouschovias, T.Ch., 1994, ApJ, 425, 142
- Codella & Felli (1995) Codella, C. & Felli, M. 1995, A&A, 302, 521
- Codella et al. (1994) Codella, C., Felli, M., Natale, V. et al. 1994, A&A, 291, 261
- Codella et al. (1995) Codella, C., Palumbo, G.G.C., Pareschi, G., et al. 1995, MNRAS, 276, 57
- Codella, Felli & Natale (1996) Codella, C., Felli, M., Natale, V., 1996, A&A, 311, 971
- Codella, Testi & Cesaroni (1997) Codella, C., Testi, L., & Cesaroni, R., 1997, A&A, 325, 282
- Comoretto et al. (1990) Comoretto, G., Palagi, F., Cesaroni, R., et al., 1990, A&AS, 84, 179
- Condon et al. (1998) Condon, J.J., Cotton, W.D., Greisen, E.W., et al. 1998, AJ, 115, 1693
- Crutcher (2003) Crutcher, R. 2003, in International Workshop: Magnetic fields in Star Formation: theory versus observations, in press.
- Crutcher (2003a) Crutcher, R., Nutter, D.J., Ward-Thompson, D., & Kirk, J.M., 2003, ApJ, 600, 279
- Crutcher et al. (1993) Crutcher, R.M., Troland, T.H., Goodman, A.A., et al. 1993, ApJ, 407, 175
- Evans et al. (2002) Evans, N.J., Shirley, Y.L., Mueller, K.E., & Knez, C., 2002, in Hot Star Workshop III: The Earliest stages of Massive star Birth,ASP conference proceedings, V267. Eds P.Cromther (San Francisco Astronimical Society of the pacific), 17.
- Felli et al. (1997) Felli, M., Testi, L., Valdettaro, R., & Wang, J.-J., 1997, A&A, 320, 594
- Fiege & Henriksen (1996a) Fiege J.D., & Henriksen, R.N., 1996, MNRAS, 281, 1038
- Fiege & Henriksen (1996b) Fiege J.D., & Henriksen, R.N., 1996, MNRAS, 281, 1055
- Genzel & Downes (1977) Genzel, R., & Downes, D., 1977, A&AS, 30, 145
- Greaves et al. (2003) Greaves, J.S., Holland, W.S., Jenness, T., et al. 2003, MNRAS, 340, 353
- Harju et al. (1998) Harju, J., Lehtinen, K., Booth, R.S., & Zinchenko, I., 1998, A&AS, 132, 211
- Heitsch et al. (2001) Heitsch, F., Zweibel, E.G., MacLow, M.-M., et al. 2001, ApJ, 561, 800
- Henkel et al. (1986) Henkel, C., Guesten, R. & Haschick, A.D., 1986, A&A, 165, 197
- Henning et al. (2001) Henning, Th., Wolf, S., Launhardt, R. & Waters, R. 2001, ApJ, 561, 871
- Herbig (1970) Herbig, G.H., 1970, in Proc. 14th Liege Symp., 59, 13
- Hildebrand (1983) Hildebrand, R.H., 1983, QJRAS, 24, 267
- Hofner & Churchwell (1996) Hofner, P., & Churchwell, E., 1996, A&AS, 120, 283
- Holland et al. (1999) Holland, W.S., Robson, E.I., Gear, W.K., et al. 1999, MNRAS, 303, 659
- Jenness et al. (2002) Jenness, T., Stevens, J.A., Archibald, E.N. et al., 2002, MNRAS, 336, 14
- Jenness & Lightfoot (1998) Jenness, T., & Lightfoot, J.F., 1998, ASP conference series, Vol. 145, eds. R. Albrecht, R.N. Hook & H.A. Bushouse, p216.
- Jenness, Scott & Padman (1995) Jenness, T., Scott, P.F. & Padman, R., 1995, MNRAS, 276, 1024
- Königl & Pruditz (2000) Königl, A., & Pruditz, R.E., 2000, in Protostars and Planets IV, eds. V. Mannings, A. Boss & S. Russell (Tucson: University of Arizona press), 759
- Lada (1987) Lada, C.J. 1987, IAUS, 115, 1
- Matthews et al. (2002) Matthews, B.C., Fiege, J.D. & Moriarty-Schieven, G. 2002, ApJ, 569, 304
- McCutcheon et al. (1995) McCutcheon, W.H., Sato, T., Purton, C.R., et al. 1995, AJ, 110, 1762
- McKee et al. (1993) McKee, C.F, Zweibel, E.G., Goodman, A.A. & Heiles, C. 1993, in Protostars and Planets III, eds. E.H. Levy, J.I Lunine (Tucson: University of Arizona press), 327
- McKee & Tan (2003) McKee, C.F. & Tan, J.C., 2003, ApJ, 585, 850
- Mestel (1999) Mestel, L., 1999, in Stellar Magnetism, Clarendon Press, Ch. 11.
- Mezger & Smith (1977) Mezger, P.G., & Smith, L.F., 1977, in IAU Symp. 75, Star Formation, ed. T. de Jong & A. Maeder (Dordrecht: Reidel), 133
- Mouschovias & Spitzer (1976) Mouschovias, T.C. & Spitzer, L., Jr. 1976, ApJ, 201, 326
- Nakano (1998) Nakano, T., 1998, ApJ, 494, 587
- Nakano & Nakamura (1978) Nakano, T., & Nakamura, T., 1978, PASJ, 30, 681
- Ossenkopf & Henning (1994) Ossenkopf, V., & Henning, Th., 1994, A&A, 291, 943
- Ostriker, Stone & Gammie (2001) Ostriker, E.C., Stone, J.M. & Gammie, C.F. 2001, ApJ, 546, 980
- Padoan et al. (2001) Padoan, P., Goodman, A., Draine, B.T., et al., 2001, ApJ, 559, 1005
- Palumbo et al. (1994) Palumbo, G.G.C., Scappini, F., Pareschi, G., et al. 1994, MNRAS, 266, 123
- Pismis (1990) Pismis, P., 1990, A&A, 234, 443
- Sharpless (1959) Sharpless, S., 1959, AJS, 4, 257
- Shirley et al. (2002) Shirley, Y.L., Evans, N.J., II, & Rawlings, J.M.C., 2002, ApJ, 575, 337.
- Shu et al. (1987) Shu, F.H., Adams, F.C. & Lizano, S., 1987, ARA&A, 25, 23
- Shu et al. (2000) Shu, F.H., Najita, J.R., Shang, H., & Li, Z.-Y., 2000, in Protostars and Planets IV, eds. V. Mannings, A. Boss & S. Russell (Tucson: University of Arizona press), 789
- Sparks & Axon (1999) Sparks, W.B. & Axon, D.J., 1999, PASP, 111, 1298
- Sridharan et al. (2002) Sridharan, T.K., Beuther, H., Schilke, P., et al. 2002, ApJ, 566, 931
- Szymczak, et al. (2000) Szymczak, M., Hrynek, G. & Kus, A.J., 2000, A&AS, 143, 269
- Testi et al. (1997) Testi, L., Felli, M., Omont, A., et al. 1997, A&A, 318, 13
- Thompson & Macdonald (2003) Thompson, M.A., & Macdonald, G.H., 2003, A&A, 407, 237
- Thompson et al. (2002) Thompson, M., Hatchell, J., MacDonald, G., Millar, T., 2002, in Hot Star Workshop III: The earliest stages of massive star birth. ASP Conference proceedings, Vol. 267. Ed P. Crowther, San Francisco, Astronomical Society of the Pacific, 2002, p. 429
- Turner (1979) Turner, B.E., 1979, A&AS, 37, 1
- Vallée & MacLeod (1990) Vallée, J.P., & MacLeod, J.M., 1990, ApJ, 358, 183
- Visser et al. (2002) Visser, A.E., Richer, J.S., & Chandler, C.J., 2002, AJ, 124, 2756
- Ward-Thompson et al. (2000) Ward-Thompson, D., Kirk, J.M., Crutcher, R.M., et al., 2000, ApJ, 537L, 135
- Wouterloot & Habing (1985) Wouterloot, J.G.A., & Habing, H.J., 1985, A&A, 151, 297
- Wouterloot et al. (1993) Wouterloot, J.G.A., Brand, J., Fiegle, K., 1993, A&AS, 98, 589
- Zeilik & Lada (1978) Zeilik, M., II, & Lada, C.J., 1978, ApJ, 222, 896