X-RAY SPECTRAL VARIABILITY IN CYGNUS X-1
Abstract
Spectral variability in different energy bands of X-rays from Cyg X-1 in different states is studied with observations and time domain approaches. In the hard tail of energy spectrum above keV, average peak aligned shots are softer than the average steady emission and the hardness ratio decreases when the flux increases during a shot for all states. In regard to a soft band lower keV, the hardness in the soft state varies in an opposite way: it peaks when the flux of the shot peaks. For the hard and transition states, the hardness ratio in respect to a soft band during a shot is in general lower than that of the steady component and a sharp rise is observed at about the shot peak. For the soft state, the correlation coefficient between the intensity and hardness ratio in the hard tail is negative and decreases monotonically as the timescale increases from 0.01 s to 50 s, which is opposite to that in regard to a soft band. For the hard and transition states, the correlation coefficients are in general negative and have a trend of decrease with increasing timescale.
1 INTRODUCTION
The intensity and spectral variabilities of the high energy emission from X-ray binaries carry valuable information about their production regions and mechanisms around compact objects. Cyg X-1, one of the most early discovered and best-studied black hole X-ray binaries (Bowyer et al., 1965), is the brightest source in the hard X-ray sky suitable for the study of rapid variability. The compact object has a mass of and the companion star HDE226868 discovered in an optical observation by Walborn (1973) has a mass of 18 (Herrero et al., 1995). The X-ray emission of Cyg X-1 is very complex in a wide time scale from months to milliseconds. In a long-term period, Cyg X-1 generally shows three different states: hard, soft and transition states.
Many temporal and spectral properties of X-rays from Cyg X-1 have been studied before, e.g., power density spectra (PDS), time lags and coherences in different energy bands and on different time scales. Most of these studies are carried out in the frequency domain by using Fourier transformation. Studies for different states of Cyg X-1 have been done with the observation data of the Proportional Counter Array (PCA) on board the Rossi X-ray Timing Explorer (RXTE), e.g., studies of temporal properties of Cyg X-1 in the soft state (Cui et al. 1997a, ), during the spectral transitions (Cui et al. 1997b, ), and in the hard state (Nowak et al., 1999). The hard state PSD of Cyg X-1 in the Fourier frequency range between 0.001 Hz and 100 Hz can be successfuly modeled with multiple energy-dependent Lorentzians – distinct broad noise components (Nowak 2000; Pottschmidt et al. 2003).
A characteristic shape of a Fourier PDS or a structure in the PDS, e.g. a quasi-periodic oscillation (QPO) or a broad noise component, can be generated by different kinds of process. For finally understanding the undergoing physical processes, it is also necessary to study variabilities directly in the time domain. On the subsecond timescale, the X-rays from Cyg X-1 show large-amplitude chaotic fluctuations. Randomly occurring shots may have significant contribution on the rapid variability (Terrel 1972; Oda 1977; Sutherland, Weisskopf & Kahn 1978; Nolan et al. 1981; Meekings et al. 1984; Miyamoto et al. 1988, 1992; Lochner, Swank & Szymkowiak 1991). To study the shot process Negoro, Miyamoto & Kitamoto (1994) constructed the average peak aligned shot profile in the 1.2–58.4 keV energy band and its hardness ratios in (7.3–14.6 keV)/(1.2–7.3 keV) and (14.6–21.9 keV)/(1.2–7.3 keV) with observation data of Cyg X-1 in the hard state. They found that the shot becomes first softer, and then, just after the peak, harder than the average emission. With /PCA data of Cyg X-1 and an improved shot detection algorithm, Feng, Li & Chen (1999) studied evolution of hardness ratios in (13–60 keV)/(2–6 keV) in the hard, soft and transition states. Their results confirmed what Negoro, Miyamoto & Kitamoto (1994) had found in the hard state, and they found that in the soft state, shots are harder, and in the transition states softer than the time average emission. Li, Feng & Chen (1999) used the correlation analysis technique to study the relationship between temporal and spectral variabilities in Cyg X-1 in different states and the results are consistent with that from the average shot analysis mentioned above.
The X-ray Spectrum of Cygnus X-1 can be decomposed into several components : thermal Comptonization, Compton reflection, and a soft excess. We make use of /PSPC observations of Cyg X-1 to study spectral variability in different energy bands. Poutanen (2001) in his review paper pointed out that it would be of interest to see how the hardness in the energy bands above keV varies in the shots. This would provide important information about spectral variability of the hard (power-law like) tail. We lay the emphasis on studying hardness evolution during shots and the correlation coefficient between hardness and intensity in the hard tail in this paper. Our results imply that the observed behavior, and then the physical mechanism, of the hard component is quite different from that of soft component.
2 SPECTRAL EVOLUTION DURING SHOTS
A series of observations of Cyg X-1 were performed by in 1996. The All Sky Monitor on revealed that Cyg X-1 started a transition from the normal hard state to the soft state. It stayed in soft state for nearly 3 months and then went back down to hard state. The data used in our work are from the public archives, listed in the Table 1. We extract the PCA data with the version 4.2 of standard ftools for windows to get 1 ms time bin light curves. In this process, the data were selected to use when the source was observed at the elevation angle larger than , the offset pointing less than , and the number of PCUs turning “ON” equaling to 5. In hard X-ray band, Cyg X-1 is a very bright source. The average of the background contribution for 13–60 keV is at 10% level and less than 1% for lower bands (2–6 keV & 6–13 keV). For the purpose of studying the average features of shots, background can be negligible. The dead-time per event in one PCU is about 10 s (Zhang et al., 1999). For Cyg X-1, the effect of dead-time is about 1% (Maccarone, Coppi & Poutanen 2000), which is neglected in our analysis. We search shots from 1 ms time bin light curves by using the algorithm proposed by Feng, Li & Chen (1998), which is a modified algorithm to the peak detection technique of Negoro, Miyamoto & Kitamoto (1994) and Li & Fenimore (1996). In order to suppress the effects of statistical fluctuation, a light curve with 1 ms time bin was first merged into larger time bin of 10 ms. Then the bin having more counts than the both sides neighboring bins is selected as a candidate peak. In the neighboring 1 s on both sides of each candidate peak, we search for the bins with counts and so that the condition
| (1) |
is satisfied with being selected from [2, 3]. If and only if the number of bins with counts and is larger than a certain criterion respectively, we affirm that the count rate is significantly smaller around the candidate peak bin. And then this candidate peak is selected as a potential shot peak. Then each selected potential shot peak bin and its both sides neighboring bins are divided into thirty bins with time bin of 1 ms. A shot is finally selected by the criteria that their count should be 2 times larger than that of the mean count of the observation and should be the maximum within the thirty bins.
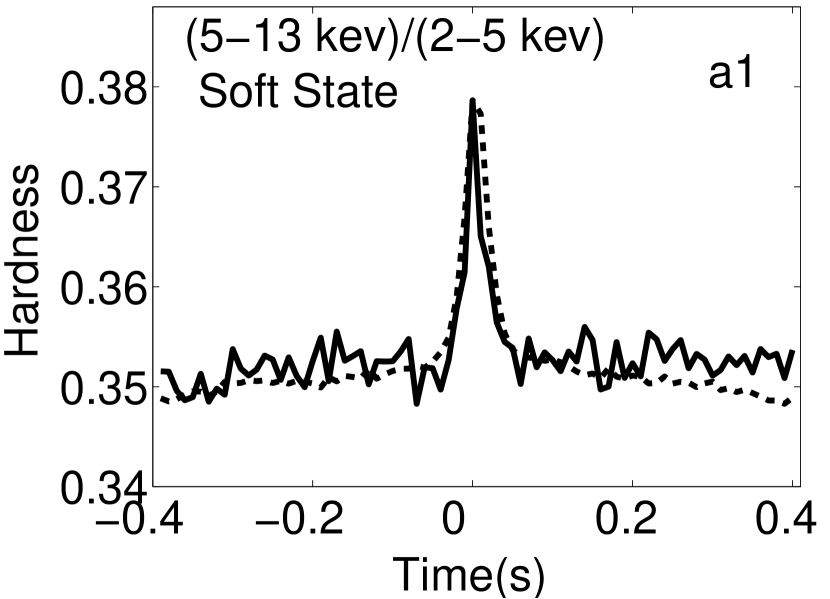
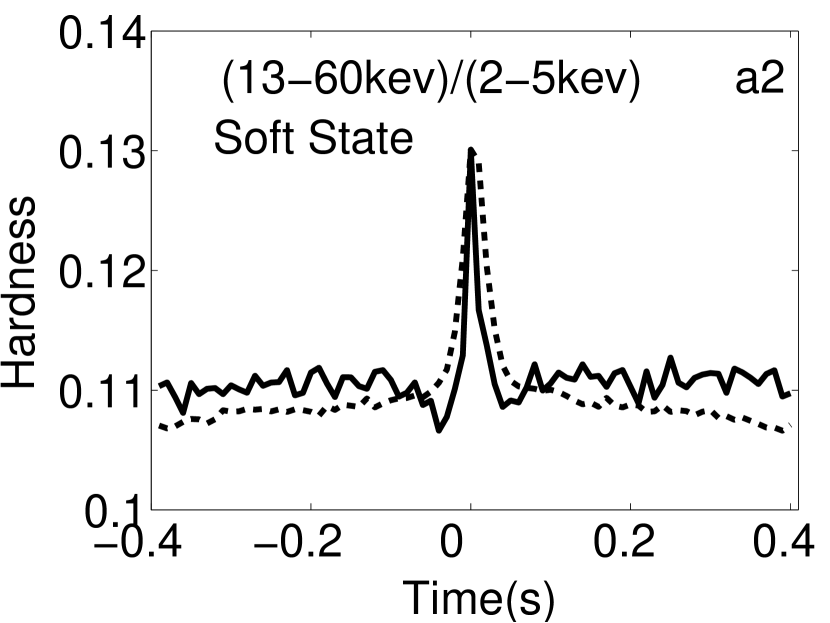
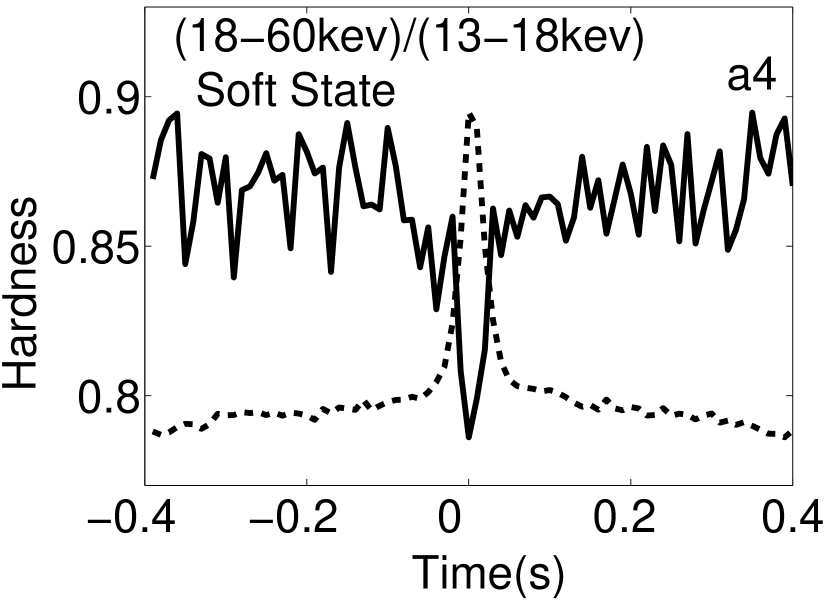
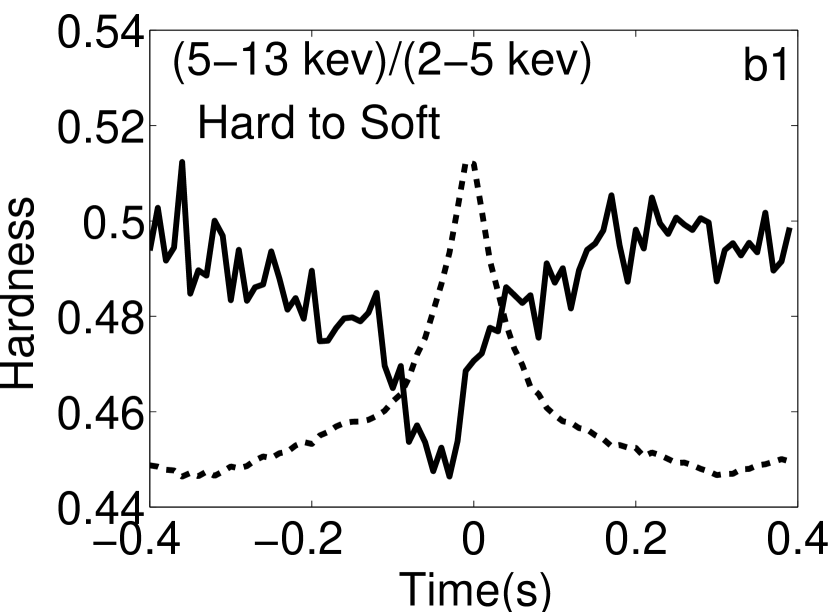
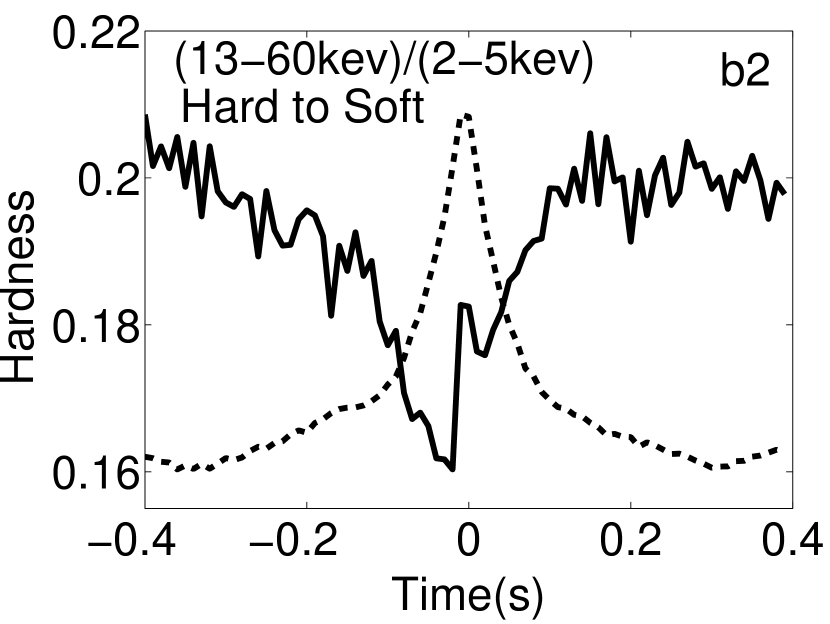
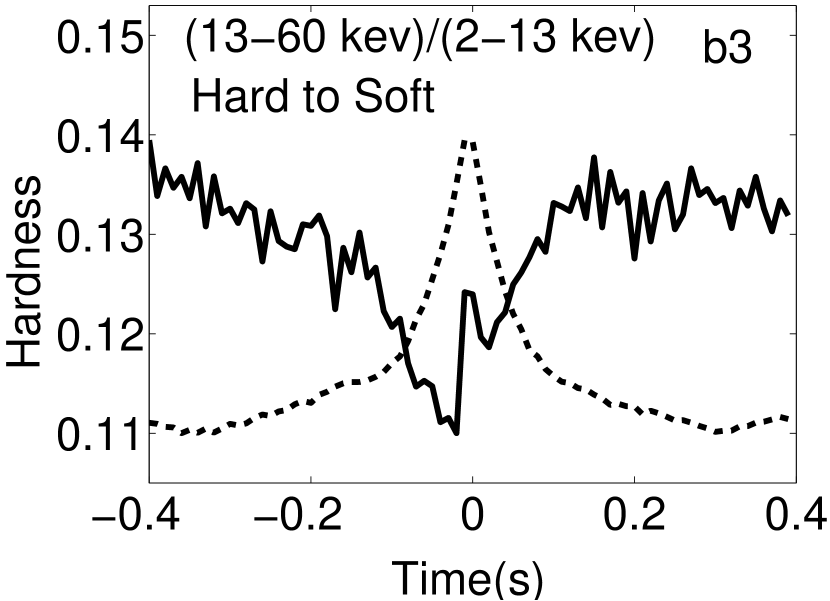
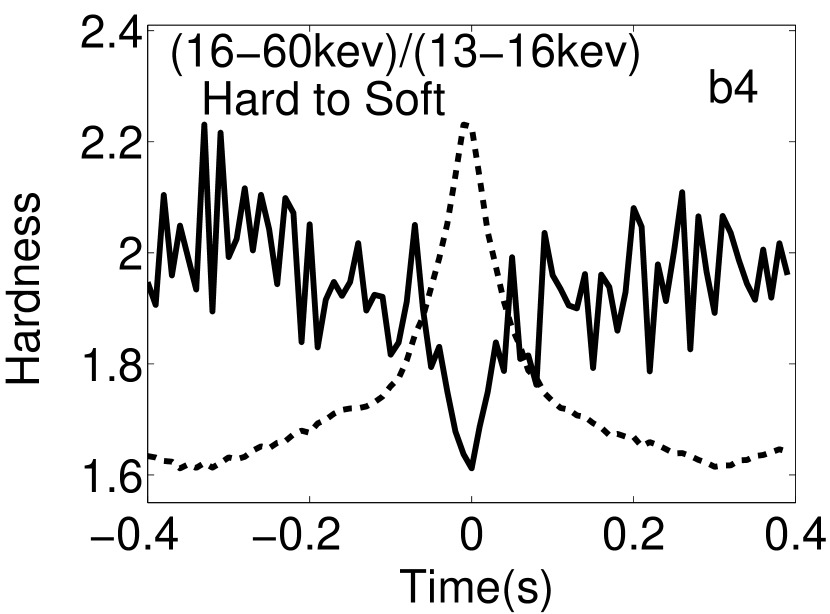
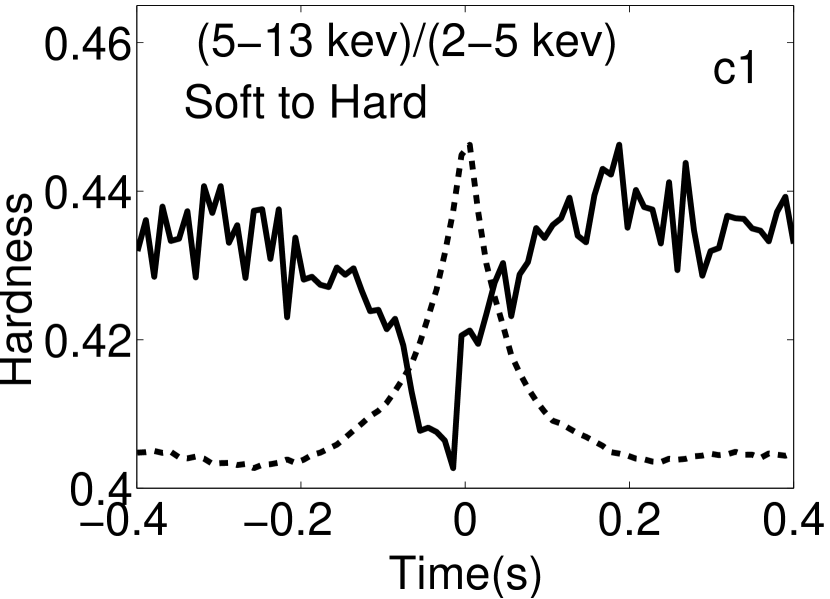
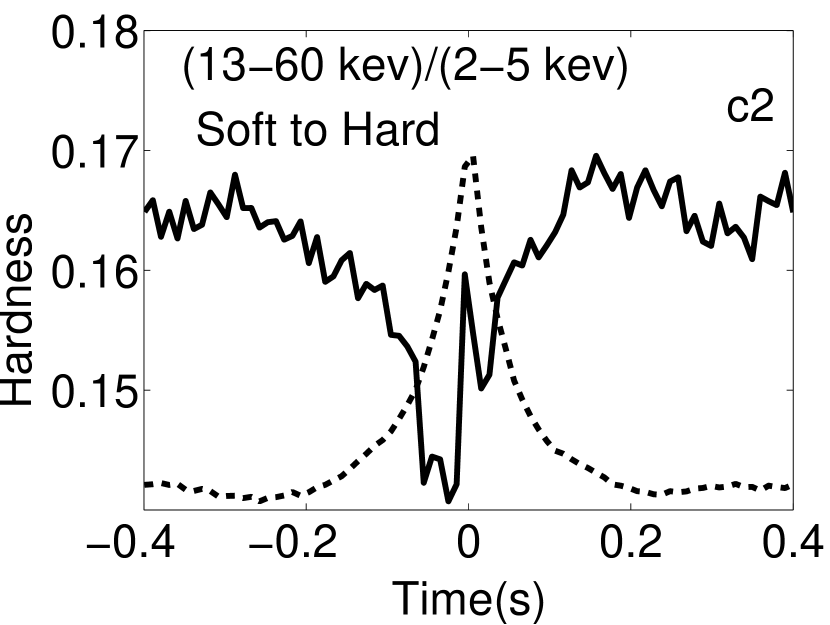
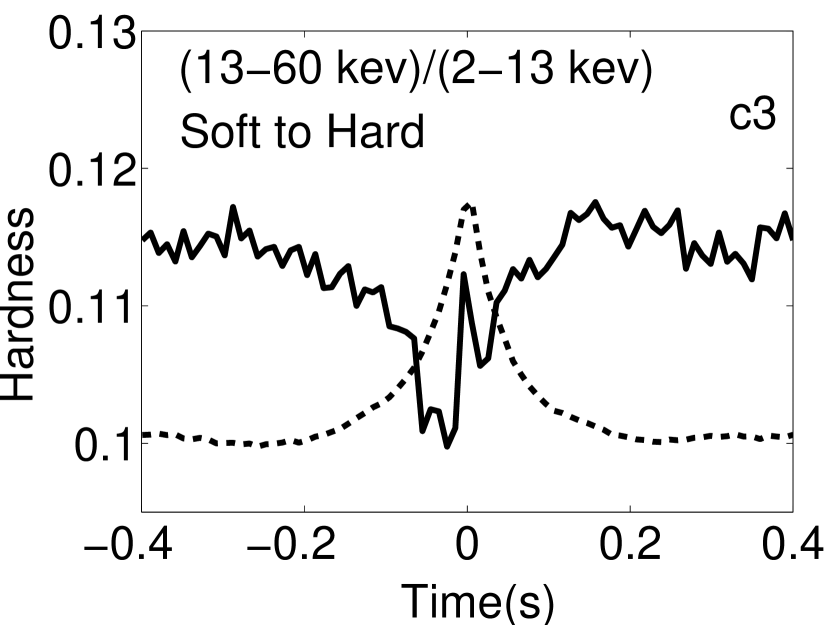
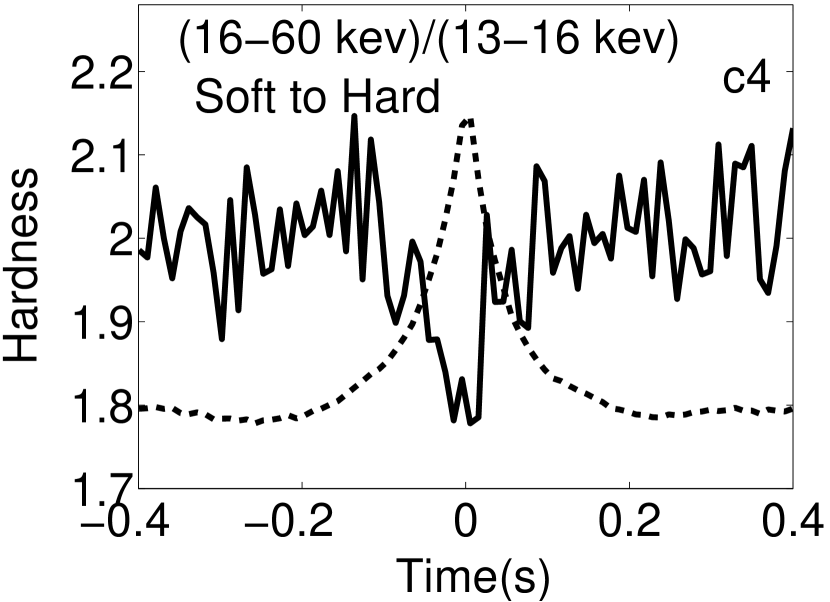
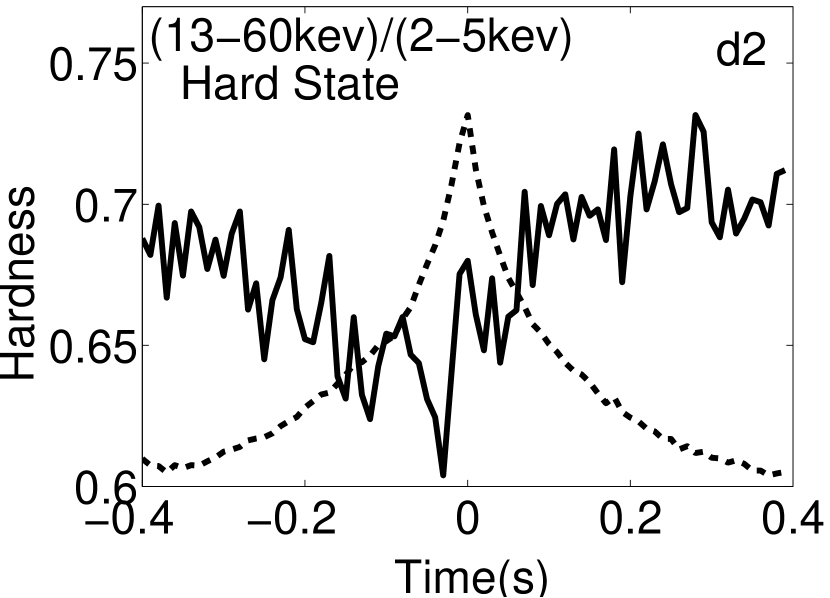
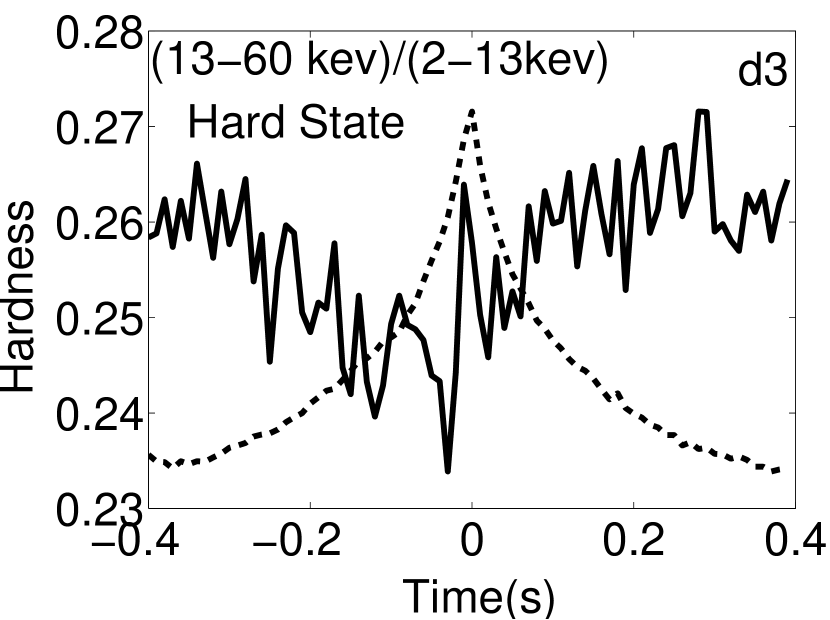
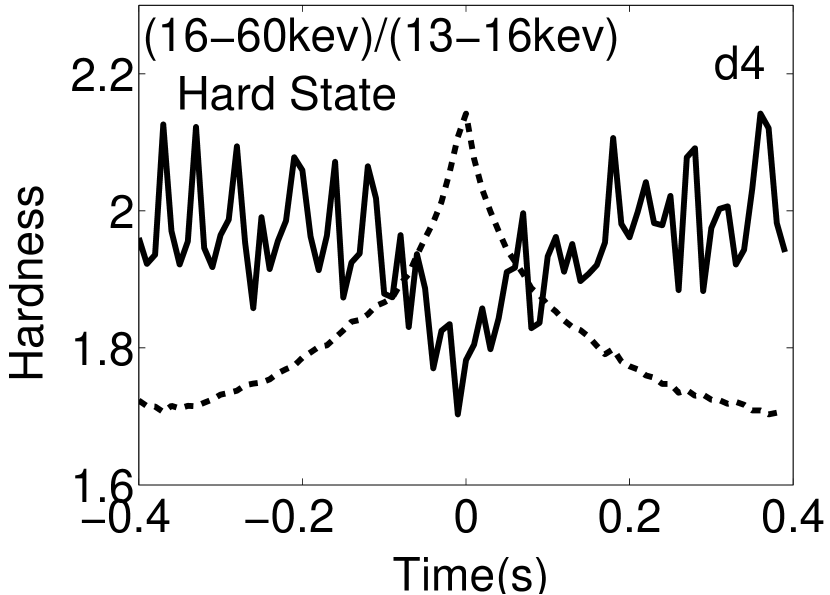
The shot detection process was performed respectively in each of three energy bands 2–6 keV, 6–13 keV and 13–60 keV (2–5 keV, 5–13 keV and 13–60 keV for the hard state). A shot peak is selected as a true shot peak if it coincidences in all the three energy bands within 30 ms. We define the 400 ms time interval neighboring a shot peak as a shot period. For a studied pair of energy bands and , we calculate the evolution curve of hardness ratios with in the shot period, where are the count rate of band and respectively. Figure 1 shows the total shot profile of 2–60 keV energy band (dashed line) and hardness variation (solid line) for different states and different pairs of studied energy band. All the panels in Fig. 1 are classified into four groups, a1-a4 for the soft state, b1-b4 for the transition state of hard-to-soft, c1-c4 for the soft-to-hard transition state, and d1-d4 for the hard state.
From the panels a4, b4, c4, and d4 of Fig. 1, one can see that the hardness ratios in the power-law tail, (16–60 keV)/(13–16 keV), vary negatively correlated with the intensity, the hardness variation during a shot is dominated by a negative peak. This feature is almost completely opposite to what is seen in the hardness ratios in respect to an energy band below keV for the soft state: The hardness ratios of (6–13 keV)/(2–6 keV), (13–60 keV)/(2–6 keV), and (13–60 keV/(2–13 keV) peak when the corresponding fluxes of the shots peak, shown in a1, a2, and a3 in Fig. 1. Maccarone & Coppi (2002a) studied the short timescale correlations between line and continuum fluxes in Cyg X-1. They found that the spectrum got harder as the source got brighter in soft state. For the hard and transition states, the variation of hardness ratio in regard to a energy band below keV behaves with a similar feature: the shot becomes first softer, and then, just around the peak, rapidly harder.
3 CORRELATION BETWEEN HARDNESS AND INTENSITY
We here study X-ray spectral variability of Cyg X-1 in different energy bands and different timescales through correlation analysis. Li, Feng & Chen (1999) proposed an algorithm to calculate the correlation coefficient between the hardness ratio and the total intensity on a given timescale . The total observation data of Cyg X-1 in a spectral state is divided into periods. For an observation period and a given time bin , the effective data in two studied energy bands are divided into segments with a duration of . The correlation coefficient
| (2) |
is calculated for each segment and then their average and standard deviation are derived. The correlation coefficient on a timescale is estimated by
| (3) |
where
| (4) |
and its uncertainty is given by
| (5) |
where
| (6) |
Finally, the result for the observation can be presented as : = .
Usually we can use some convenient statistical methods based on the normal distribution to make statistical inference, e.g. significance test, on . For the case of short time scale , although the number of counts per bin may be small for it to be assumed as a normal variable, it is easy to obtain a total number of segments from a certain observation that is large enough that the central limit theorem can be applied and that a normal distribution can be assumed for estimating the uncertainty of .
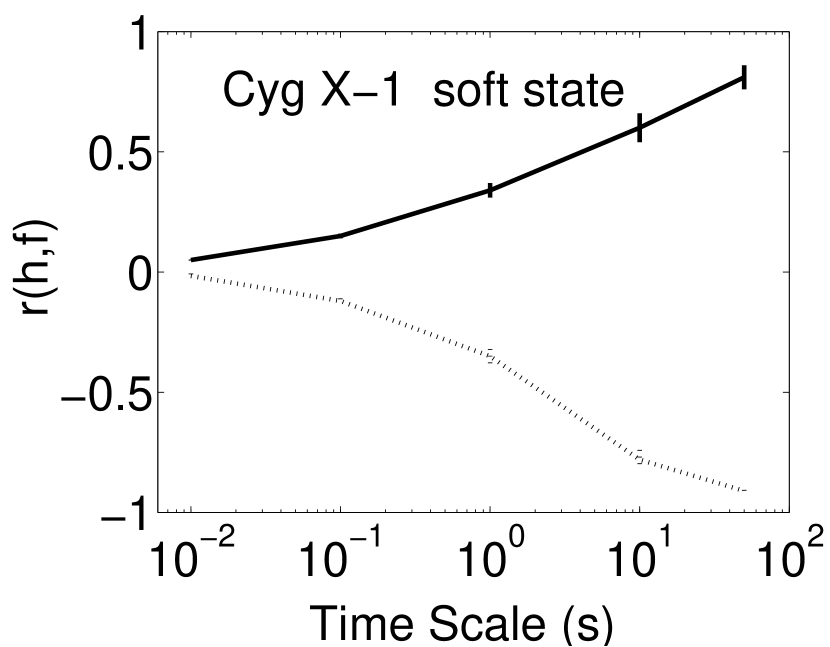
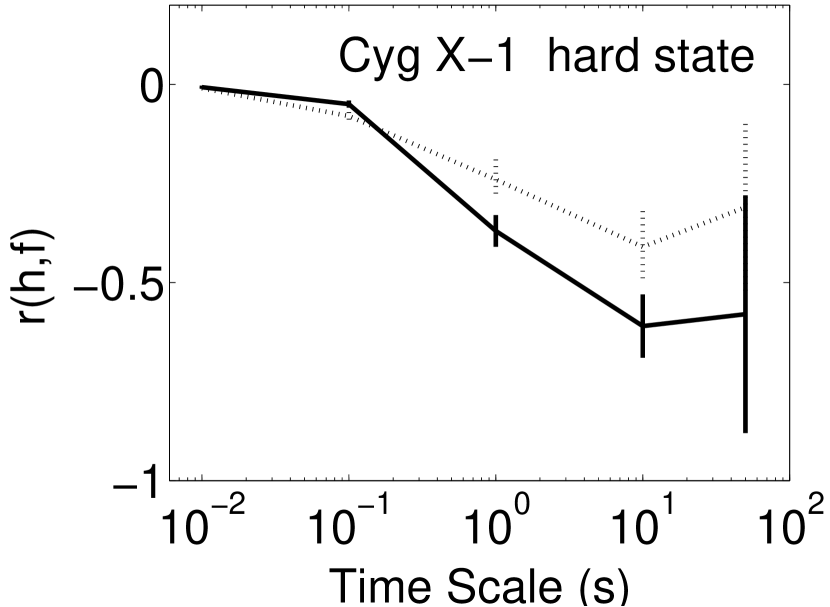
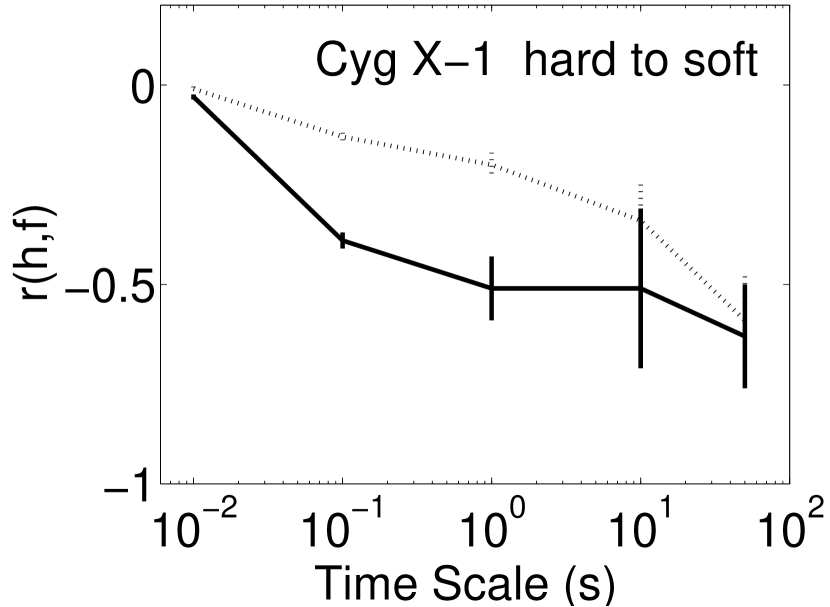
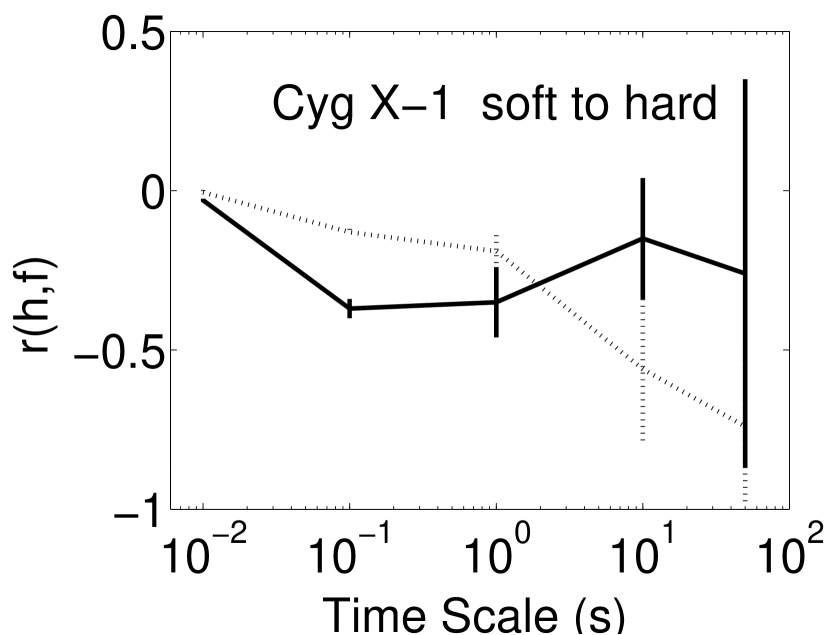
For each state, we calculate the correlation coefficients between intensity and hardness ratio of (13–60 keV)/(2–6 keV) and (16–60 keV)/(13–16 keV) on time scales 0.01 s, 0.1 s, 1 s, 10 s, and 50 s respectively. The results are shown in Table 2–3 and Figure 2.
From upper-left panel of Fig. 2 for the soft state, we can see that the correlation coefficients between the intensity and hardness ratio in the 2–6 keV band are positive on all timescales between 0.01 s and 50 s. In contract, they are negative for the 13–16 keV band. The two kinds of correlation vary with timescale in opposite directions: for the hardness ratios in regard to the soft band, the correlation coefficient increases monotonically and reaches near unity as the timescale increases from 0.01 s to 50 s; on the other hand, for in the hard band, the correlation coefficient decreases monotonically and reaches near . The hard and transition states have the similar feature in hardness-intensity correlation: the correlation coefficients are in general negative and have a trend of decrease with increasing timescale.
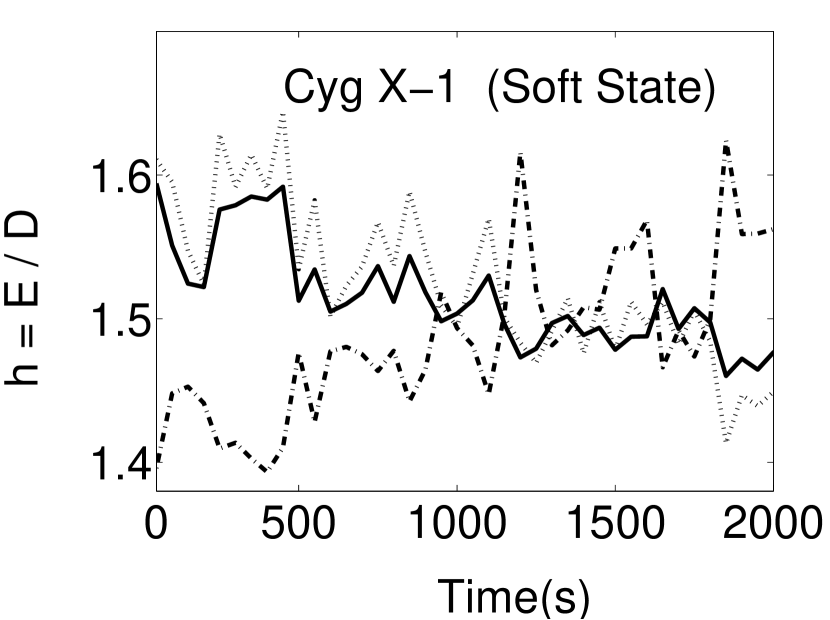
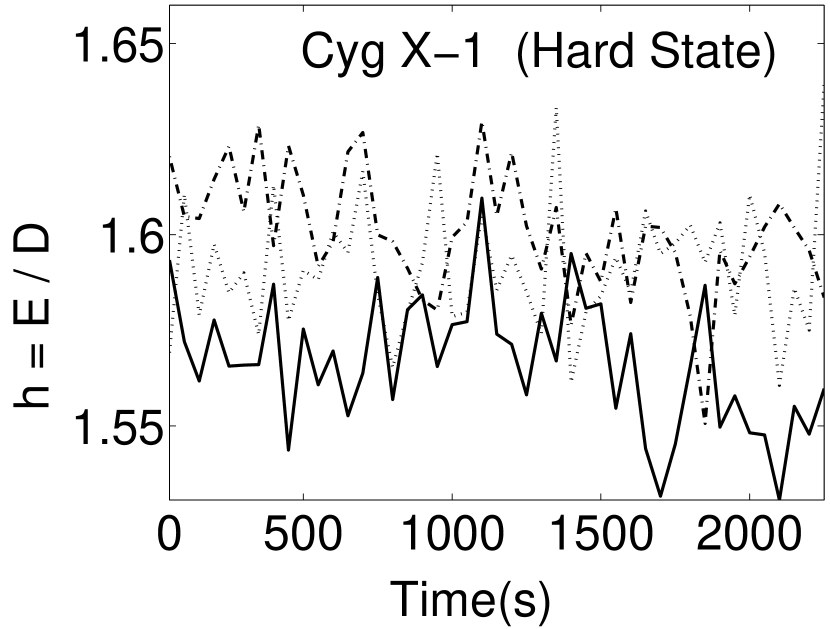
Figure 3 shows example of light curve and hardness profiles in 50 s time bin in the soft and hard states. From Fig.3 we can see that, consistent with the results of correlation analysis, the hardness ratios in (13–60 keV)/(2–6 keV) are positively related to the light curve and the hardness in (16–60 keV)/(13–16 keV) negatively for the soft state, and a rather complex mixture of positive and negative correlations for the hard states.
4 SUMMARY AND DISCUSSION
The simplest single shot models assume that the observed lightcurve consists of the superposition of individual uncorrelated shots with a fixed profile and intensity. Lochner, Swank & Szymkowiak (1991) found that the simplest shot models cannot fit the overall PSD shape of Cyg X-1 well. Recently Maccarone & Coppi (2002b) found that the single shot variability models also cannot produce the observed skewness pattern. In this work we study the spectral evolution in different energy bands of X-rays from Cyg X-1 in different states during the average peak aligned shots in subsecond duration region, our results on shot are in the average meaning, neither assuming the shots have a fixed profile and nor assuming the shots can be responsible alone for the overall power spectrum. The timescale analysis we performed for correlation between hardness and intensity is not correlated with any special shot model. Main features in spectral variability of Cyg X-1 X-rays revealed by our time domain analysis can be summarized as follows: (1) For any spectral state of Cyg X-1, on the average the hardness profile of the hard spectral component above keV is in the shape of a valley bottomed out when flux peaks during a shot, which is different from that in respect to the softer component. (2) During an average shot of Cyg X-1 in the soft state, the hardness in regard to a softer band lower keV peaks when the flux peaks . (3) For the hard and transition states, shots are softer than the time average emission, a sharp rise is appeared at about the shot peak in the average profile of hardness ratio in respect to a soft band. (4) The correlation coefficients between the intensity and hardness ratio on timescales between 0.01 s and 50 s are negative or near zero when Cyg X-1 is in the hard or transition states. In the soft state, the correlation coefficient in the hard band decreases monotonically and reaches near as the timescale increases from 0.01 s to 50 s; by contrast, the correlation in regard to a soft band is positive and increases when timescale increases.
The significant difference observed in Cyg X-1 of soft state between the shot spectral evolution in the hard band above keV and that in respect to a softer band indicates that different mechanisms dominate the shot processes in the two energy bands. It is broadly believed that the process of producing the hard power-law like spectrum is thermal Comptonization: hard emission above keV is produced by inverse Compton scattering of soft seed photons by hot electrons of temperature keV (e.g. Sunyaev & Trümper 1979). When a seed photon of energy collides with a relativistic electron in the hot corona with Lorenz factor , the energy, , of the emitted photon is given by (e.g. Lang 1999). After a collision from an electron of energy 100 keV, the energy of a seed photon of 10 keV will be lifted to keV. Most scattered photons escaped from the hot corona undergo only one collision and the hardness ratio in respect to the 13–16 keV band decreases when the number of seed and scattered photons increase. Thus the anti-correlation between the ratio of counts in (16–60 keV)/(13–16 keV) and the hard band intensity during shots in any spectral state can be understood by the Comptonization process in the hot corona. Recently, by using a timescale analysis technique of shot width, Feng, Li & Zhang (2004) found that the energy dependence of shortest width of X-ray shots from the black hole binaries Cyg X-1, XTE J1550-564 and GRO J1655-40 in their hard state in the energy band below about 10–20 keV is opposite to that in higher energy region: below about 10–20 keV the shortest width decreases with increasing energy, and above about 10–20 keV it increases with increasing energy. It is expected that detailed study of shot spectral evolution and other energy resolved timing in the hard band can help to understand the hot corona and the shot production and propagation processes.
The evolution of shot hardness ratio in regard to a soft band below keV should depend on not only the hot gas, but also the cold disk. It is natural to assume that shots are most probably produced at the innermost region of the cold disk joined with the hot corona which is a most turbulent region, and the steady component around a shot is a global average of emission from different regions of the hot corona (Li, Feng & Chen 1999). For the soft state, the disk may extend down to the last stable orbit and the hot cloud is restricted to the corona surrounding the disk (Esin et al., 1998). As the inner disk, and then the corona embedding it, has a higher temperature, the shot spectrum from the innermost region should be harder. For the hard and transition states, the optically thick disk is truncated at larger distance and jointed a spherical corona around the black hole. Shots should be softer than the steady emission as they produce and Comptonize at the outer part of the corona with temperature lower than the average of the total corona. The difference between the profile of hardness ration in regard to a soft band in the soft state and that in the other states may reflect the difference of their corona geometries. The presence of an uprush of the hardness profile around the shot peak in the hard and transition states is probably an evidence that a shock wave is produced along with shot propagating in the spherical corona.
The correlation coefficients between the hardness ratio and intensity obtained for different timescales and different states of Cyg X-1 shown in Tables 2–3 and Figure 2 are qualitatively consistent with the results from the shot analysis. The correlation analysis is made for the temporal variability in general, not only for shots. The correlation being weaker at shorter timescales indicates the existence of other uncorrelated rapid variations. For the soft state, the correlation coefficients varying (increasing or decreasing) monotonically and reaching a perfect correlation (or anti-correlation) along with the timescale from 0.01 s to 50 s may indicate that the effect of uncorrelated noise being weakened on larger timescales.
The authors thank the referee for helpful comments and suggestions. This work is supported by the Special Funds for Major State Basic Research Projects and the National Natural Science Foundation of China. The data analyzed in this work are obtained through the HEASARC on-line service provided by the NASA/GSFC.
References
- Bowyer et al. (1965) Bowyer, S., Byram, E. T., Chubb, T. A., & Friedman, H. 1965, Science, 147, 394
- (2) Cui W., Heindl W.A., Rothschild R.E., Zhang S.N., Jahonda K. & Focke W. 1997a, ApJ, 474, L57
- (3) Cui W., Zhang S.N., Focke W. & Swank J.H. 1997b, ApJ, 484, 383
- Esin et al. (1998) Esin A.A., Narayan R., Cui W., Grove J.E. & Zhang S.N. 1998, ApJ, 505, 854
- Feng, Li, & Chen (1999) Feng, Y. X., Li, T. P, & Chen, L. 1999, ApJ, 514, 373
- Feng, Li, & Zhang (2004) Feng, H., Li, T.P., & Zhang, S.N. 2004, ApJ, 606 (astro-ph/0401205)
- Herrero et al. (1995) Herrero, A., Kudritzki, R.P., Gabler, R., Vilchez, J.M., & Gabler, A. 1995, A&A, 297, 556
- Lang (1999) Lang K.R. 1999, Astrophysical Formulae (Springer-Verlag)
- Li, Feng, & Chen (1999) Li, T. P., Feng, Y. X., & Chen, L. 1999, ApJ, 521, 789
- Li (1996) Li, H., & Fenimore, E. E. 1996, ApJ, 469, L115
- Lochner, Swank, & Szymkowiak (1991) Lochner, J.C., Swank, J.H., & Szymkowiak, A.E. 1991, ApJ, 375, 295
- Maccarone, Coppi, & Poutanen (2000) Maccarone, T.J., Coppi, P.S., & Poutanen J., 2000, ApJ, 537, L107
- (13) Maccarone, T.J., Coppi, P.S., 2002a, MNRAS, 336, 817
- (14) Maccarone, T.J., Coppi, P.S., 2002b, MNRAS, 335, 465
- Meekings et al. (1984) Meekins, J.F., Wood, K.S., Hedler, R.L., Byram, E.T., Yentis, D.J., Chubb, T.A., & Friedman, H. 1984, ApJ, 278, 288
- Miyamoto et al. (1988) Miyamoto, S., Kitamoto, S., Mitsuka, K., & Dotani, T. 1988, Nature, 336, 450
- Miyamoto et al. (1992) Miyamoto, S., Kitamoto, S., Iga, S., Negoro, H., & Terada, K. 1992, ApJ, 391
- Negoro, Miyamoto, & Kitamoto (1994) Negoro, H., Miyamoto, S., & Kitamoto, S. 1994 ApJ, 423, L127
- Nolan et al. (1981) Nolan, P.L., et al. 1981, ApJ, 246, 494
- Nowak et al. (1999) Nowak M.A., Vaughan B.A., Wilms J., Dove J.B. & Begelman C. 1999, ApJ, 510, 874
- Nowak (2000) Nowak M.A. 2000, MNRAS, 318, 361
- Oda (1977) Oda, M. 1977, Space Sci. Rev., 20, 757
- Pottschmidt et al. (2003) Pottschmidt K., Wilms J., Nowak M.A., Pooley G.G., Gleissner T., Heindl W.A., Smith D.M., Remillard R., & Staubert R. 2003, A&A, 407, 1039
- Poutanen (2001) Poutanen, J. 2001, Adv. Space Res., 28, 267
- Sutherland, Weisskopf, & Kahn (1978) Sutherland, P.G., Weisskopf, M.C., & Kahn, S.M. 1978, ApJ, 219, 1029
- Sunyaev & Trümper (1979) Sunyaev R. & Trümper J. 1979, Nature, 279, 506
- Terrel (1972) Terrel, N.J. 1972, ApJ, 174, L35
- Walborn (1973) Walborn, N. R. 1973 ApJ, 179, L123
- Zhang et al. (1999) Zhang, W., Jahoda, K., Swank, J. H., Morgan, E. H., & Giles, A. B. 1999, 449, 930


| State | Obs. ID | Start Time | Stop Time |
|---|---|---|---|
| Hard to Soft | 10412–01–01–00 | 23/05/96 14:14:05 | 23/05/96 18:08:05 |
| 10412–01–03–00 | 30/05/96 07:47:05 | 30/05/96 08:45:05 | |
| Soft | 10512–01–08–00 | 17/06/96 07:59:05 | 17/06/96 09:08:05 |
| 10512–01–08–02 | 17/06/96 04:47:05 | 17/06/96 05:44:05 | |
| Soft to Hard | 10412–01–05–00 | 11/08/96 07:02:05 | 11/08/96 08:25:05 |
| 10412–01–07–00 | 12/08/96 14:41:05 | 12/08/96 15:59:05 | |
| Hard | 10236–01–01–03 | 17/12/96 12:45:42 | 17/12/96 13:25:13 |
| 10236–01–01–04 | 17/12/96 22:21:42 | 17/12/96 00:42:13 |
| State | Time Scale | ||||
|---|---|---|---|---|---|
| 0.01 s | 0.1 s | 1 s | 10 s | 50 s | |
| Soft | 0.05 | 0.15 | 0.34 | 0.60 | 0.81 |
| Hard | -0.007 | -0.05 | -0.37 | -0.61 | -0.58 |
| Hard to Soft | -0.03 | -0.39 | -0.51 | -0.51 | -0.63 |
| Soft to Hard | -0.03 | -0.37 | -0.35 | -0.15 | -0.26 |
| State | Time Scale | ||||
|---|---|---|---|---|---|
| 0.01 s | 0.1 s | 1 s | 10 s | 50 s | |
| Soft | -0.016 | -0.12 | -0.35 | -0.78 | -0.91 |
| Hard | -0.01 | -0.08 | -0.24 | -0.41 | -0.31 |
| Hard to Soft | -0.01 | -0.13 | -0.20 | -0.34 | -0.59 |
| Soft to Hard | -0.005 | -0.13 | -0.19 | -0.56 | -0.74 |