A SUBARU SEARCH FOR LYMAN EMITTERS AT z=5.8 WITH AN INTERMEDIATE-BAND FILTER
Abstract
We present the results of a survey for Ly emitters at 5.8 using a new intermediate-band filter centered at 8275 Å with 340 Å (i.e., the spectroscopic resolution is ) with a combination with a traditional narrow-band centered at 8150 Å with 120 Å (). Our observations were made with use of the Subaru Prime Focus Camera, Suprime-Cam, on the 8.2 m Subaru telescope in a sky area surrounding the high redshift quasar, SDSSp J104433.04012522.2 at , covering an effective sky area with arcmin2. In this survey, we have found four Ly-emitter candidates from the intermediate-band image ( 5.8 with ). Combined with our previous results based on the NB816 imaging, we discuss the star formation activity in galaxies between and .
Subject headings:
cosmology – observations: cosmology – early universe: galaxies: formation – galaxies: evolution1. INTRODUCTION
Probing the star formation activity in galactic or subgalactic systems at high redshift is essentially important for understanding of the formation and early evolution of galaxies. This is also important to investigate major sources of the cosmic reionization (e.g., Loeb & Barkana 2001). Recent optical deep surveys and their optical spectroscopic follow-up observations have revealed more than two dozens of such star forming galaxies beyond (e.g., Hu et al. 2002, 2004; Kodaira et al. 2003; Santos et al. 2003; see for a review Taniguchi et al. 2003b, and Spinrad 2003).
In an attempt to find star-forming objects at , we made an optical deep imaging survey in a sky area around the SDSS quasar, SDSSp J104433.04012502.2 (Ajiki et al. 2003). In this survey, we found 20 Ly emitter (LAE) candidates at . Two of them were confirmed as real LAEs at (Ajiki et al. 2002) and at (Taniguchi et al. 2003a) based on their optical spectroscopy. In this survey, the narrowband filter NB816 ( = 8150 Å with = 120 Å) was used to select LAEs at . In addition to this narrowband filter, we also used a new intermediate-band filter IA827 ( = 8275 Å with = 340 Å) (Hayashino et al. 2001; Taniguchi 2001; Taniguchi et al. 2003b) in the same observing run. Using the IA827 filter, we are able to search for LAEs in the very luminous part of the Ly luminosity function at in a very large volume. This intermediate-band filter is one of a series of intermediate-band filters, called the IA filter system, dedicated to the Suprime-Cam on the 8.2m Subaru telescope (e.g., Taniguchi 2001; see also Fujita et al. 2003). The scientific merits of the IA filter system are described in Taniguchi (2001), see for some spectacular results with a similar composite filter system, COMBO-17, Wolf et al. (2003).
In this paper, we report new results on our deep imaging survey for LAEs at with use of the intermediate-band filter, IA827. We adopt a flat universe with , , and where 70 km s-1 Mpc-1). Magnitudes are given in the AB system throughout this paper.
2. OBSERVATIONS AND DATA REDUCTION
2.1. Observations
We have carried out a very deep optical imaging survey for faint LAEs in the field surrounding the quasar SDSSp J104433.04012502.2 at redshift 5.74111 The discovery redshift was (Fan et al. 2000). Since, however, the subsequent optical spectroscopic observations suggested a bit lower redshift; (Djorgovski et al. 2001) and (Goodrich et al. 2001), we adopt in this paper. (Fan et al. 2000; Djorgovski et al. 2001; Goodrich et al. 2001), using the prime-focus wide-field camera, Suprime-Cam (Miyazaki et al. 2002) on the 8.2 m Subaru Telescope (Kaifu et al. 2000) on Mauna Kea. Suprime-Cam consists of ten 2k 4k CCD chips and provides a very wide field of view, (0.202 arcsec pixel-1).
In this survey, we used the intermediate-band filter, IA827, centered at 8275 Å with a passband of Å; the wavelength coverage corresponds to the redshift range of 5.66 – 5.94 for Ly emission; note that the central wavelength of IA827 filter varies within 25 Å with the positions on the filter, causing an uncertainty in the redshift estimate within . We also used broad-band filters, , , , and , and the narrow-band filter, NB816, centered at 8150 Å with a passband of Å; the wavelength corresponds to the redshift range of 5.65–5.75 for Ly emission (see Ajiki et al. 2003). The total-response (filter, optics, and atmosphere transmission and CCD sensitivity are taken into account) curves of the filter bands used in our observations are shown in Figure 1. A summary of the imaging observations is given in Table 1. All observations were done under photometric conditions, and the seeing was between 07 and 14 during the observing run. Spectrophotometric standard stars used in the flux calibration for IA827 are HZ 21 (Oke 1990), and PG 1034+001 (Massey et al. 1988). The detailed flux calibration for the , , , and NB816 data and data reduction procedures are given in Ajiki et al. (2003).
The total size of the reduced field is arcmin2. After masking the regions contaminated by fringes and bright stars, our actual survey area is 720 arcmin2 (see Ajiki et al. 2003). The volume probed by the IA827 imaging has (co-moving) transverse dimensions of 4.0 Mpc2, and the FWHM of the filter corresponds to a co-moving depth along the line of sight of 123 Mpc ( and ; note that these values are average of 13 different position on the IA827 filter). Therefore, a total volume of Mpc3 is probed in our IA827 image.
2.2. Source Detection and Photometry
Source detection and photometry were performed using SExtractor version 2.2.2 (Bertin & Arnouts 1996) in the double image mode. A source is selected as a 13-pixel connection above the 2 noise level on the IA827 image. Photometry was performed with a 2.8 arcsec diameter aperture for each band image after matching image size of the data of each band with the -band data (1.4 arcsec). The limiting magnitudes are , , , , , and for a 3 detection with a 2.8 arcsec diameter aperture. In the above source detection, we find sources down to .
3. RESULTS
3.1. Selection of IA827-Excess Objects
Since the effective wavelength of the IA827 filter is 8275 Å, we use a continuum band Iz827 evaluated from a linear combination of where and are the fluxes at and bands, respectively. A 3 limit of Iz827 is in a 2.8 arcsec diameter aperture.
When we select IA827-excess objects, we should be careful because objects at with no emission line could be selected as nominal IA827-excess objects. This is due to that the absorption by intergalactic neutral hydrogen causes the strong continuum depression at Å for objects at . In order to exclude such contamination in our selection procedure of IA827-excess objects, we investigate the effect of continuum depression for high- LAEs with different Ly emission-line equivalent widths ( = 0, 100, 300, and 500 Å) as a function of redshift; ). The results are shown in Figure 2. In these estimates, we use the average optical depth derived by Madau et al. (1996). Figure 2 shows that even objects at with no emission line have IA827 excesses as much as mag. We also note that the redshift range of detectable LAEs depends on EW (see section 4.2).
Taking our results shown in Figure 2, we adopt a selection criterion for IA827-excess objects, , because the error of is mag for objects with . Then, we select IA827-excess objects by using the following criteria;
| (1) | |||||
| (2) | |||||
| (3) |
where
| (4) |
The criterion, corresponds to a line flux, ergs s-1 cm-2. This line-flux limit is higher by a factor of than that in Ajiki et al.(2003).
In Figure 3, we show the diagram between and IA827 for the objects in the IA827-selected catalog together with the above criteria. There are 21 IA827-selected sources which satisfy the above three criteria. Note that five of the 21 objects have been also selected as NB816-excess objects in our previous work (Ajiki et al. 2003).
3.2. Selection of LAE Candidates
In order to select LAE candidates at from our emission-line objects, we apply the same criteria as those in Ajiki et al. (2003) to all emitters; i.e.,
| (5) | |||||
| (6) | |||||
| (7) |
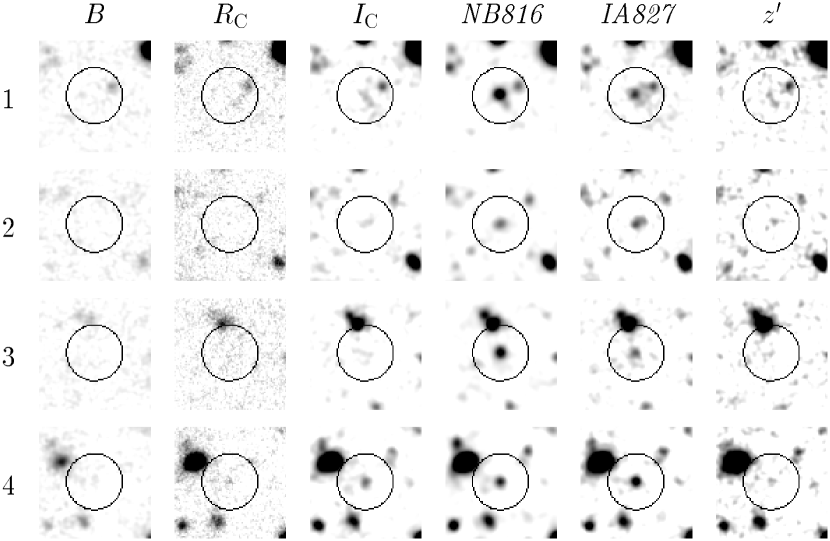
These criteria enable us to select LAEs at (see Ajiki et al. 2003). First, eleven of the 21 objects satisfy the criterion (5). None of the eleven objects has magnitude of . Therefore no object satisfies the criterion (6). Four of the eleven object satisfy the criterion (7). Finally we select 4 objects as LAE candidates at by the criteria (5) and (7). Three of the 4 LAE candidates have been already selected as LAE candidates by Ajiki et al. (2003) based on their NB816 data. The positions and photometric properties of the four -selected LAEs are given in Table 2. It is noted that all of our LAE candidates are undetected above 2 level in the - and -band images (i.e., and ). The , , , NB816, IA827, and images of the four LAE candidates are shown in Figure 4. The comparison of results of this survey and those of using NB816 (Ajiki et al. 2003) are summarized in Table 3.
4. DISCUSSION
4.1. Properties of the LAE Candidates Expected from the IA827 and NB816 Data
In the previous section, we selected the 4 LAE candidates at given in Table 2. All of them were also detected in our NB816 image. We try to estimate redshifts of the 4 LAE candidates using both the NB816 and IA827 data. In Figure 5, we show the diagram of 4 LAE candidates at between and . In this figure, we also show colors of model LAEs with Å, 500 Å, and 1000 Å. In these models, we use the average optical depth derived by Madau et al. (1996) to estimate the absorption by intergalactic neutral hydrogen, It is found that the color of the LAE candidates at above the 3 sigma detection in IA827 (Ajiki et al. 2003) are consistent with model LAEs at 5.65 – 5.75. It is also found that two of our 4 LAE candidates are expected to be at 5.70 – 5.75, and the other two are at 5.75 – 5.77. We can also estimate the EWs and line fluxes of our 4 LAE candidates from Figure 5. The estimated EWs, , and line fluxes, , of our LAE candidates are given in Table 4.
4.2. Space Density of the LAEs at
Since we have detected the 4 LAE candidates at in the volume of Mpc3, we obtain the space density of the LAE candidates at , Mpc-3. This density is lower by an order of magnitude than that of our NB816 survey, Mpc-3 at (Ajiki et al. 2003), or that of Rhoads & Malhotra (2001), Mpc-3 at and Mpc-3 at (see also Rhoads et al. 2003).
The main reason for this seems to be attributed to different limits in the EW and Ly luminosity among the above surveys. The limits in the EW and Ly luminosity of our survey, Å and ergs s-1, are much higher than those of the other surveys, Å and ergs s-1 for that of Ajiki et al. (2003), or Å and ergs s-1 for that of Rhoads & Malhotra (2001). Therefore, only a few objects that are selected as LAE candidates in the other surveys satisfy the limits in the EW and Ly luminosity of our survey. Actually, only four of 20 objects found in Ajiki et al. (2003) satisfy these criteria.
In Figure 6, the space density of both our LAE candidates and those found in Ajiki et al. (2003) are shown as a function of redshift together with that of Rhoads & Malhotra (2001). The redshift range for our LAE candidates is classified into the two redshift intervals, 5.65 – 5.75 and – 5.77. In the redshift estimate of our LAE candidates, we use Figure 5. Note that LAE candidates undetected in IA827 have redshifts between and . It is also noted that any corrections for the detection completeness is not made for all the samples.
Although our IA827 filter could prove Ly emitters at 5.7 – 5.9, all our 4 LAE candidates lie at 5.7 – 5.8. Therefore, it is interesting to consider why no LAE candidates are found at 5.8– 5.9. For LAEs at , both the Ly emission and the very weak continuum depressed at wavelengths shortward of the Ly peak are recorded in the IA827 image. Therefore, such objects are not selected as strong IA827-excess objects. This effect is indeed found in our simulations shown in Figure 2. The IA827-excess variation in redshift are shown in Figure 2.
4.3. Ly Luminosity Distributions at 5.7 – 5.8
We investigate the Ly luminosities of the candidates. The derived Ly luminosities of this survey range from to ergs s-1. In Figure 7, we show the number distributions of our LAE candidates as a function of Ly luminosity together with those previous LAE surveys at using a narrowband filter (Ajiki et al. 2003; Rhoads & Malhotra 2001; Hu et al. 2004). The figure shows that our survey probes higher-luminosity sources with respect to the other LAE surveys at ; see also Pascarelle et al. (1998) and Fujita et al. (2003). Since an intermediate-band can cover a wider volume than a typical narrowband filter, the use of such intermediate-band filter is useful finding higher-luminosity LAEs that are rarer than low luminosity ones.
4.4. Possibility of Large Scale Structure at 5.7 – 5.8
In Figure 8, we plot the spatial distributions the 4 LAE candidates together with those at of Ajiki et al. (2003). It appears that most LAE candidates are found in the western side of the quasar SDSSp J104433.04012502.2. In particular, there is no LAE candidate in the northeast of the quasar. Contours of the local surface density are also shown in this figure. The local surface density at position (, ) is the density averaged over the circle centered at (, ) whose radius is determined as the angular distance to 5 nearest neighbors. Note that smoothing with the top-hat filter of arcmin, corresponding to Mpc at , is made.
The contour map suggests that there is a high-density region in northwest side of the quasar, where the local density is higher by a factor of 3 than the average density in this field. To examine its statistical significance, we made simple simulations; we distributed 21 points randomly in the survey field and estimated the local surface density at each point. We found that 19 % of 100 random distributions also show a similar high-density region. Therefore, it is difficult to conclude that there is a high-density clustering region of LAEs at .
We would like to thank both the Subaru and Keck Telescopes staff for their invaluable help, and Dave Sanders, Sylvain Veilleux, S. Okamura, Y. Ohyama, S. Oyabu, N. Kashikawa, M. Iye, H. Ando, and H. Karoji for encouragement during the course of this study. We would also thank James Rhoads for providing us useful information on the LALA survey, M. Ouchi, M. Yagi, and K. Shimasaku for useful discussion on the data reduction of Suprime-Cam data, and T. Hayashino for his technical help. We also thank to the referee, Paul Francis, for his useful comments and suggestion. This work was financially supported in part by the Ministry of Education, Culture, Sports, Science, and Technology (Nos. 10044052, and 10304013) and JSPS (No. 15340059). MA and TN are JSPS fellows.
References
- (1) Ajiki, M., et al. 2002, ApJ, 576, L25
- (2) Ajiki, M., et al. 2003, AJ, 126, 2091
- (3) Bertin, E., & Arnouts, S. 1996, A&AS, 117, 393
- (4) Djorgovski, S. G., Castro, S., Stern, D., & Mahabal, A. A. 2001, ApJ, 560, L5
- (5) Fan, X., et al. 2000, AJ, 120, 1167
- (6) Fujita, S. S., et al. 2003, AJ, 125, 13
- (7) Goodrich, R. W., et al. 2001, ApJ, 561, L23
- (8) Hayashino, T., et al. 2000, SPIE, 4008, 397
- (9) Hu, E. M., Cowie, L. L., McMahon, R. G., Capak, R., Iwamuro, F., Kneib, J. -P., Maihara, T., & Motohara, K. 2002, ApJ, 568, L75
- (10) Hu, E. M., Cowie, L. L., Capak, P., McMahon, R. G., Hayashino, T., & Komiyama, Y. 2004, AJ, 127, 180
- (11) Kaifu, N. et al, 2000, PASJ, 52, 1
- (12) Kodaira, K., et al. 2003, PASJ, 55, L17
- (13) Loeb, A., & Barkana, R. 2001, ARA&A, 39, 19
- (14) Massey, P., Strobel, K., Barnes, J. V., & Anderson, E. 1988, ApJ, 328, 315
- (15) Madau, P., Ferguson, H. C., Dickinson, M. E., Giavalisco, M., Steidel, C. C., & Fruchter, A. 1996, MNRAS, 283, 1388
- (16) Miyazaki, S., et al. 2002, PASJ, 54, 833
- (17) Oke, J. B. 1990, AJ, 99, 1621
- (18) Pascarelle, Sebastian M., Windhorst, Rogier A. & Keel, William C. 1998, AJ, 116, 2659
- (19) Rhoads, J. E., & Malhotra, S. 2001, ApJ, 563, L5
- (20) Rhoads, J. E., et al. 2003, AJ, 125, 1006
- (21) Santos, M. R., Ellis, R. S., Kneib, J., Richard, J., & Kuijken, K. 2003 ApJ, submitted (astro-ph/0310478)
- (22) Spinrad, H. 2003, Astrophysics Update, in press (astro-ph/0308411)
- (23) Taniguchi, Y., 2001, the Japan-Germany Workshop on Studies of Galaxies in the Young Universe with New Generation Telescopes (astro-ph/0301097)
- (24) Taniguchi, Y., et al. 2003a, ApJ, 585, L97
- (25) Taniguchi, Y., Shioya, Y., Fujita, S. S., Nagao, T. Murayama, T., & Ajiki, M. 2003b, JKAS, 36, 123, and the APCTP Workshop on Formation and Interaction of Galaxies (astro-ph/0306409)
- (26) Wolf, C., Wisotzki, L., Borch, A., Dye, S., Kleinheinrich, M., & Meisenheimer, K. 2003, A&A, 408, 499


| Band | Obs. Date (UT) | (sec)aaTotal integration time. | (AB)bbThe limiting magnitude (3) within a 2.8 arcsec aperture. | (arcsec)ccThe full width at half maximum of stellar objects in the final image |
|---|---|---|---|---|
| 2002 February 17 | 1680 | 26.6 | 1.2 | |
| 2002 February 15, 16 | 4800 | 26.2 | 1.4 | |
| 2002 February 15, 16 | 3360 | 25.9 | 1.2 | |
| 2002 February 15, 16 | 5160 | 25.3 | 1.2 | |
| NB816 | 2002 February 15 - 17 | 36000 | 26.0 | 0.9 |
| IA827 | 2002 February 15 , 17 | 12420 | 25.6 | 1.2 |
| No. | (J2000) | (J2000) | bbAB magnitude in a 2.8 arcsec diameter. The magnitudes between the 2 and 3 detection levels are put in parentheses. | NB816bbAB magnitude in a 2.8 arcsec diameter. The magnitudes between the 2 and 3 detection levels are put in parentheses. | IA827bbAB magnitude in a 2.8 arcsec diameter. The magnitudes between the 2 and 3 detection levels are put in parentheses. | bbAB magnitude in a 2.8 arcsec diameter. The magnitudes between the 2 and 3 detection levels are put in parentheses. | Iz827bbAB magnitude in a 2.8 arcsec diameter. The magnitudes between the 2 and 3 detection levels are put in parentheses. | A03 ccID number in Ajiki et al. (2003). |
|---|---|---|---|---|---|---|---|---|
| h m s | ∘ ′ ′′ | |||||||
| 1 | 10 43 48.3 | 01 23 20 | 25.7 | 23.9 | 24.5 | (25.5) | 25.7 | 7 |
| 2 | 10 43 55.5 | 01 14 18 | (26.2) | 25.0 | 24.6 | 25.7 | (26.2) | 12 |
| 3 | 10 43 59.0 | 01 16 27 | (26.0) | 24.3 | 24.9 | 25.7 | (26.2) | 13 |
| 4 | 10 44 01.6 | 01 42 31 | 25.0 | 24.7 | 24.2 | 25.7 | 25.2 |
| Filter11Filter name used in the survey. | 22Central redshift corresponding to the center of the passband. | 33Minimum and maximum redshift. | 44Co-moving volume in units of Mpc3. | 55Survey limit in rest-frame equivalent width in units of Å. | 66Survey limit in Ly-luminosity in units of ergs s-1. | 77Number of LAE candidates detected in the survey. |
|---|---|---|---|---|---|---|
| NB816 | 5.70 | (5.65, 5.75) | 1.8 | 32 | 5 | 20 |
| IA827 | 5.80 | (5.66, 5.94) | 5.0 | 57 | 15 | 4 |
| NB816 & IA82788Overlap of the NB816 and IA827 surveys | 5.70 | (5.66, 5.75) | 1.7 | 57 | 15 | 3 |
| No. | NB816IA827 | Iz827IA827 | |||
|---|---|---|---|---|---|
| (Å) | (ergs s-1 cm-2) | ||||
| 1 | 5.74 | 6.3 | |||
| 2 | 5.77 | 6.8 | |||
| 3 | 5.74 | 4.8 | |||
| 4 | 5.77 | 8.0 |