Evidence for a Neutron Star in the non-pulsating massive X-ray binary 4U220654.
We present an analysis of archival RXTE and BeppoSAX data of the X-ray source 4U220654 . For the first time, high energy data ( keV) are analyzed for this source. The data are well described by comptonization models (CompTT and BMC) in which seed photons with temperatures between 1.1 keV and 1.5 keV are comptonized by a hot plasma at 50 keV thereby producing a hard tail which extends up to, at least, 100 keV. We offer a new method of identification of neutron star systems using a temperature - luminosity relation. If a given X-ray source is characterized by a low bolometric luminosity and a relatively high color blackbody temperature ( keV) it has necessarily to be a neutron star rather than a black hole. From these arguments it is shown that the area of the soft photon source must be small ( km) and that the the accretion disk, if present, must be truncated very far from the compact object. Here we report on the possible existence of a cyclotron line around keV. The presence of a neutron star in the system is strongly favored by the available data.
Key Words.:
X-ray:stars – binaries – individual: 4U2206+541 Introduction
High Mass X-ray binaries (HMXRBs) are often subdivided in two broad categories depending on the type of the optical companion: Supergiant systems and Be/X systems. The vast majority of these High Mass X-ray Binaries harbour X-ray pulsars (Bildsten et al. 1997). Around 70% of all known X-ray pulsars are in Be/X-ray systems. These are believed to be young neutron stars (NS) with relatively strong magnetic fields ( G). The X-ray spectra of these objects are usually described by powerlaws modified at high energies by a cutoff around 7–10 keV (Lewin et al. 1995). Some HMXRBs do not display X-ray pulsations. From these, three show the typical characteristics of black hole candidates, two of them being in the LMC and only one (Cyg X-1) in the Galaxy.
There are, however, other HMXRBs in which pulsations have not been detected, in spite of intensive searches, that do not display the characteristics of black hole candidates. The nature of their compact objects is therefore unknown. One such system is 4U220654.
4U220654 was first reported by Giacconi et al. (1972) using the Uhuru satellite. Steiner et al. (1984) identified the optical counterpart with the early type star BD. This star showed H in emission while the photometric colours where consistent with a B0 star and, consequently, the X-ray source was proposed as a Be/X-ray binary. It is a persistent X-ray source, having been detected by all satellites that have observed it. The luminosity is low ( erg s-1) and fairly constant in the long term but shows flaring with changes of an order of magnitude in short timescales. Fits to EXOSAT (Saraswat & Apparao 1992) and RXTE (Negueruela & Reig 2001, NR01 hereinafter) data favored powerlaw models. Using PCA data on board RXTE Corbet & Peele (2001, CP01) did not find any evidence of pulsations. Instead they found a modulation in the ASM X-ray lightcurve with a period of 9.6 d, which can be interpreted as the binary period.
On the other hand NR01 concluded that the spectral classification of the optical companion is far from being well established. The optical spectrum does not belong to any specific spectral type and is rather peculiar. These authors conclude that BD is not a classical Be star but that the most probable scenario is a peculiar active O9p star of moderate luminosity (III to V) orbited by a compact object which accretes matter from the stellar wind.
The nature of the compact object, in turn, is not clear. The presence of a cutoff at keV in the X-ray spectrum (NR01, CP01) favours a neutron star interpretation. However, the lack of pulsations does not allow to confirm it unambiguously. The system displays striking analogies with the microquasar RX J1826.2-1450LS 5039 (optical counterpart O6.5V[(f)], low persistent luminosity and no pulsations). In the case of 4U220654 the presence of a black hole would be consistent with the above characteristics (especially the lack of pulsations). However, as we will show in this paper, there is strong evidence for the presence of a NS in the system.
So far, the spectral analysis has been limited to the 2–30 keV band. The spectra have been usually fit using powerlaws modified at high energies by cutoffs. In order to gain a more physical insight into the properties of this mysterious system we present in this paper an analysis of partially unpublished archival RXTE data and unpublished BeppoSAX data of three different epochs. 4U220654 was observed in a very broad energy range from 0.5 to 200 keV by BeppoSAX and from 2.5 to 100 keV by RXTE. For the first time, data from the High Energy X-ray Timing Experiment (HEXTE) onboard RXTE are analysed for this source.
2 X-ray observations
| Detector | c/s | Start | Stop | Tint |
|---|---|---|---|---|
| LECS | 0.1970.005 | 51140.710 | 51140.853 | 12.4 |
| MECS | 0.4040.004 | 51140.685 | 51140.828 | 33.4 |
| PDS | 0.4510.006 | 51140.686 | 51140.829 | 14.6 |
| ObsID | Start | Stop | PCA | HEXTE |
|---|---|---|---|---|
| 20140-01-01-00 | 50518.176 | 50518.407 | 9.1 | 5.9 |
| 20140-01-01-01 | 50520.251 | 50520.365 | 4.5 | 3.1 |
| 60071-01-01 | 52194.010 | 52194.164 | 17.7 | 12.2 |
| 60071-01-02 | 52196.268 | 52196.601 | 29.8 | 19.2 |
| 60071-01-03 | 52198.834 | 52199.017 | 20.9 | 13.9 |
| 60071-01-04 | 52201.339 | 52201.433 | 19.6 | 12.6 |
| Total | 101.6 | 66.9 |
2.1 BeppoSAX data


We present an observation made in 1998 November 23 using the Low-Energy Concentrator Spectrometer (LECS; 0.1–10 keV; Parmar et al. p:97 (1997)), the Medium-Energy Concentrator Spectrometer (MECS; 1.8–10 keV; Boella et al. b:97 (1997)) and the Phoswich Detection System (PDS; 15–300 keV; Frontera et al. f:97 (1997)) on-board BeppoSAX. All these instruments are coaligned and referred to as Narrow Field Instruments (NFI). The MECS consists of two (three until May 9, 1997) grazing incidence telescopes with imaging gas scintillation proportional counters in their focal planes. The LECS uses an identical concentrator system as the MECS, but utilizes an ultra-thin entrance window and a driftless configuration to extend the low-energy response to 0.1 keV. The non-imaging PDS consists of four independent units arranged in pairs each having a separate collimator. Each collimator was alternatively rocked on-source and 210′ off-source every 96 s during the observation. The High Pressure Gas Scintillation Proportional Counter on-board BeppoSAX (HPGSPC) was not used in this observation as the source was not bright enough for this instrument. Table 1 lists the BeppoSAX observation epoch and net exposure times for our source. The LECS instrument is able to observe only during night time. Therefore, the on-source time for LECS is usually a half that of MECS.
Good data were selected from intervals when the elevation angle above the Earth’s limb was and when the instrument configurations were nominal, using the SAXDAS 2.0.0 data analysis package. In order to produce the spectra and lightcurves, LECS and MECS data were extracted centered on the position of the source using the standard radii of 8′ and 4′, respectively. Background subtraction for the PDS was performed in the standard way using data obtained during intervals when the collimators were offset from the source. Background subtraction for the imaging instruments (LECS and MECS) was performed using blank sky fields provided by the BeppoSAX Science Data Center, using the same region of the detector as the source.
The LECS and MECS spectra were rebinned to oversample the full width half maximum of the energy resolution by a factor 3 and to have additionally a minimum of 20 counts per bin to allow use of the statistic. Data were selected in the energy ranges 0.1–10.0 keV (LECS), 1.65–10 keV (MECS) and 15–200 keV (PDS) where the instrument responses are well determined and sufficient counts are obtained. This gives background-subtracted count rates of 0.197, 0.404, and 0.451 s-1 for the LECS, MECS and PDS, respectively.
All uncertainties quoted are on a 90% confidence level for one parameter of interest unless otherwise specified.
2.2 RXTE data
We used archival RXTE data of 4U220654 for this analysis. RXTE observed 4U220654 in AO2 from 1997 March 11 to 1997 March 12 and four times between 2001 October 12 and 2001 October 20. The observations are evenly distributed over the possible orbit. The 1997 observations were quite short and resulted in less then 15 ksec onsource time in the PCA. The 2001 observation was substantially longer and resulted in almost 90 ksec usable onsource time in the PCA. The HEXTE exposure times are substantially shorter due to the rocking of the two clusters and the deadtime of the instrument (see below). A detailed overview of the observations is given in Table 2.
RXTE consists of three instruments (for a complete description of the satellite, see Bradt et al. 1993): the Proportional Counter Array (PCA Jahoda et al 1996), the High Energy X-ray Timing Experiment (HEXTE Rothschild et al 1998), and the All Sky Monitor (ASM Levine et al. 1996).
The PCA consists of five co-aligned Xenon proportional counter units with a total effective area of 6000 and a nominal energy range from 2 keV to over 60 keV. However, due to response problems above 20 keV and the Xenon-K edge around 30keV, we restricted the use of the PCA to the energy range from 3 keV to 20 keV (see also Kreykenbohm 2002). Since the instrument is pointing continuously at the source, a background model is used for background subtraction. We used the Faint model as is appropriate for a dim source like 4U220654 (see for a description Stark 1997). To account for the uncertainties in the PCA response matrix, we used systematic errors.
On the other hand, we have estimated the galactic diffuse background emission at the source position as measured by the ROSAT PSPC instrument. Then we converted this count rate into fluxes with the PIMMS tool provided by HEASARC. The predicted 3 - 10 keV flux is less than erg s-1 cm-2 and does not contaminate the source spectrum.
The HEXTE consists of two clusters of four NaI(Tl)/CsI(Na) Phoswich scintillation detectors with a total net detector area of 1600 . However, early in the mission, an electronics failure left detector three in cluster B unusable for spectroscopy. These detectors are sensitive from 15 keV to over 200 keV; however, response matrix, instrument background and source count rate, limit the energy range from 18 to 100 keV in the case of 4U220654. Background subtraction is done in the HEXTE by source-background rocking of the two clusters every 32 s.
To improve the statistical significance of the data, we added the data of both HEXTE clusters (using a 1:0.75 weighted response matrix to account for the loss of one detector). We further improved the significance of the data by binning several channels together.
2.2.1 Lightcurves
In Fig.1 the BeppoSAX LECS, MECS and PDS lightcurves rebinned to intervals of 60 s are shown. Variations of a factor of 3 can be seen on timescales of 30 min. A search for pulsations using Scargle periodgram and Epoch-folding techniques (see, e.g., Leahy et al. 1983) failed to result in any significant peaks (see Fig.1, right panel) in agreement with previous works (NR01, CP01).
The lightcurve clearly presents flaring activity with periods of relative quiescence. The erratic flaring seems otherwise to be typical of wind accretion, as observed in other HMXRBs like Vela X-1 (Kreykenbohm et al. 2002, Kreykenbohm et al. 1999).
2.2.2 Spectrum
The overall spectrum of 4U220654 was investigated by simultaneously fitting data from the BeppoSAX NFI as well as the RXTE PCA and HEXTE data using the xspec package (Arnaud a:96 (1996) v 11.2.00).
As can be seen in Table 1, the on-source time is very different for the three SAX instruments. Strictly speaking, the MECS is sampling more epochs than LECS, while the source proved to be very variable during the observation. However, the error bars in LECS data are much larger than those of MECS so that this lack of simultaneity has a very small incidence on the fit statistics. As a matter of fact, the parameters of the fit are not too affected if we reject the LECS data completely. If we reject all the MECS data not strictly simultaneous with LECS then we obtain larger uncertainties in the fit due to the lack of photons. We prefer, therefore, to use all available data.
The photoelectric absorption cross sections of Morrison & McCammon mo:83 (1983) and the solar abundances of Anders & Grevesse a:89 (1989) were used throughout the analysis.
Since much of the work has been done so far fitting modified powerlaws up to 30 keV the first thing we test is whether these models fit properly the spectra if the high energy data is taken into account. In Table 3 we quote the and degrees of freedom for several models.
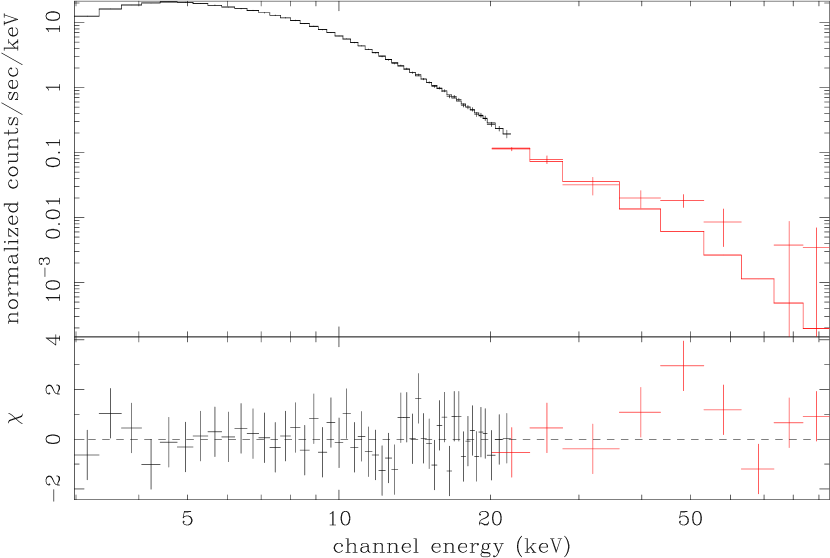
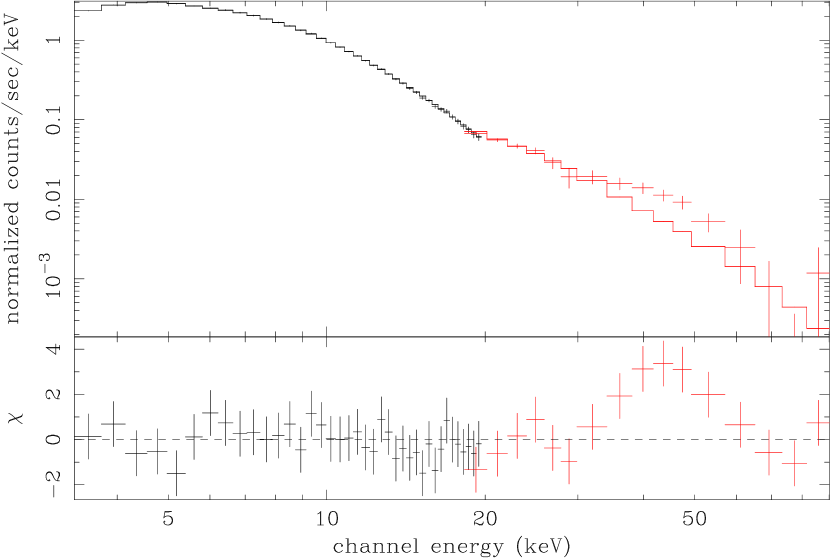
In Fig. 2 we present the XTE-1997 and XTE-2001 3-90 keV data fit with a high energy cutoff powerlaw. As can be seen, the model describes correctly the data between 3 and 30 keV, the spectral ranges used in the past. However, the model is unable to describe properly the hard energy tail beyond 30 keV. In the SAX-1998 data, the residuals present exactly the same behaviour and, in this case, do not describe properly even the low energy bins.
| Model | XTE-1997 | SAX-1998 | XTE-2001 |
|---|---|---|---|
| po | 17(54) | 2.11(115) | 8.45(51) |
| highecut(po) | 0.71(52) | 1.32(113) | 1.27(49) |
| po + bb | 0.94(52) | 1.24(117) | 0.96(49) |
| po + diskbb | 0.98(52) | 1.26(117) | 1.31(49) |
| bremss | 3.05(54) | 1.52(115) | 2.59(51) |
| raymond | 17.83(54) | 1.87(115) | 10.65(51) |
| Model | Param | XTE-1997 | SAX-1998 | XTE-2001 |
|---|---|---|---|---|
| highecut(po) | 4.5 | 1.1 | 4.6 | |
| Ecut | 7.6 | 7.8 | 4.3 | |
| Efold | 16.3 | 11 | 20 | |
| 1.6 | 1.0 | 1.6 | ||
| po + bb | 4.4 | 1.0 | 4.8 | |
| kT | 2.16 | 1.74 | 2.4 | |
| 1.96 | 1.53 | 2.0 |
The analysis yields the following conclusions:
-
•
The very presence of a hard tail is established for the first time, using high energy data from the HEXTE and PDS instruments. This hard tail extends at least to 100 keV where the signal to noise ratio starts to be poor.
-
•
Simple models including an absorbed powerlaw and an absorbed powerlaw with a high energy cutoff give poor fits when the hard tail beyond 30 keV is considered (see Fig.2)
-
•
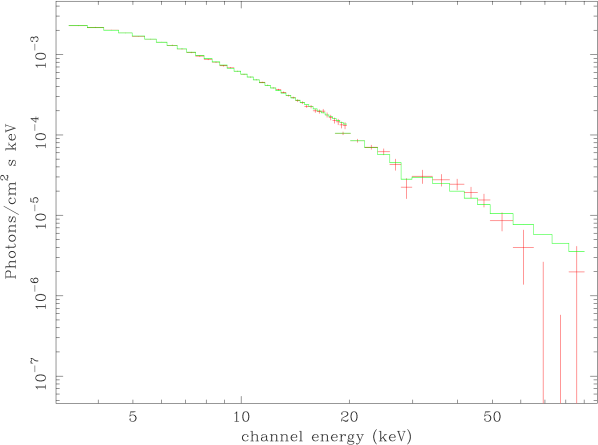
Models including a soft blackbody or multicolored disk blackbody emission plus a hard powerlaw tail give good descriptions of XTE data but not for the SAX-1998 data (Fig.3 right panel, specially at low energies). Note that the model with a multicolored blackbody disk results in a slightly worse fit (see discussion).
-
•
Other models with combine thermal models and powerlaws, result in poor fits. For XTE 2001 data, for instance, the Bremss + po model results in a of 2.5.
-
•
Models including only thermal components (Bremsstrahlung, Raymond, etc.) are unacceptable.


Although in some instances the powerlaw + bb model could give an acceptable fit, in others do not. In principle, this additive model is not physically justified but it is a crude additive approximation of the Comptonization model for which a blackbody component and powerlaw component are the low energy and high energy asymptotics, respectively (see Sunyaev & Titarchuk 1980, hereafter ST80). Thus we use exact Comptonization models for model fitting to the data rather than any approximation of it. In this work we shall deliberately apply models which parameters can be more readily interpreted in physical terms and have as few free parameters as possible.
The best fits are obtained with the thermal comptonization model (compTT in xspec) (Titarchuk ti:94 (1994), Hua & Titarchuk ht:95 (1995)), with the addition of a blackbody component at low energies, and the Bulk Motion Comptonization model (Titarchuk et al. tmk:97 (1997), Shrader & Titarchuk st:98 (1999)), or BMC model.
This single model reproduces rather well the data both at high and at low energies where it must be only modified by photoelectric absorption. The best fit parameters for these models are given in Table 5.
| Model | Parameter | XTE 1997 | SAX 1998 | XTE 2001 |
|---|---|---|---|---|
| compTT + bb | N | 2.040.12 | 0.30 0.15 | 4.220.16 |
| Tbb | 0.760.04 | 0.730.05 | 0.65 0.04 | |
| kT0 | 1.500.06 | 1.260.07 | 1.460.06 | |
| kTe | 47.790.06 | 47.480.06 | 46.460.06 | |
| 0.500.3 | 0.700.3 | 0.460.3 | ||
| F | 26.8 | 4.1 | 12.6 | |
| F | 67.0 | 5.4 | 16.5 | |
| CR(b) | 0.28 | 0.43 | 0.34 | |
| (dof) | 0.66 (49) | 1.16 (114) | 0.62 (47) | |
| BMC | N | 0.2 0.1 | 0.30 0.15 | 0.20.1 |
| (keV) | 1.380.09 | 1.09 0.08 | 1.380.09 | |
| 1.40.23 | 0.99 0.18 | 1.260.15 | ||
| 1 | 1 | 1 | ||
| 35.3 0.3 | 5.5 0.2 | 15.7 0.2 | ||
| F | 24.5 | 4.1 | 9.9 | |
| CR(b) | 0.40 | 0.72 | 0.47 | |
| (dof) | 0.71 (51) | 1.14 (116) | 0.88 (49) |
(a) unabsorbed flux in units of 10-11 erg s-1 cm-2
(b) computed as F20-60keV/F3-20keV
(c) unabsorbed flux in units of 10-11 erg s-1 cm-2. The spectral range
is 2-100 keV for RXTE data and 0.5–100 keV for BeppoSAX data
Assuming a distance of 3 kpc (NR01), the luminosity of the source was 7.22 erg s-1(XTE-1997, ’high state’), 5.8 erg s-1(SAX-1998, ’low state’) and 1.78 erg s-1(XTE-2001, ’intermediate state’) respectively. Consistently with earlier observations, no iron line around 6.4 keV is detected.
3 Discussion

As we have seen, the cutoff powerlaw is no longer a satisfactory description when data beyond 30 keV are taken into account. Indeed the spectra show clearly the presence of a hard tail which extends to the 100 keV zone. This hard tail can be described by a powerlaw or by comptonization models.
In contrast, models including only thermal components can be discarded (see Table 3). This fact, along with the presence of the hard tail, clearly argue against the accretion onto a WD or the interaction between two normal stars as the origin of the X-ray emission (a possibility put forward by NR01, owing to the unusual optical spectrum). Indeed, colliding wind systems present spectra which are rather soft with plasma at temperatures of keV (Cooke, Fabian & Pringle cfp:78 (1987), Pollock po:87 (1987)). In order to produce measurable X-ray emission the very strong stellar winds found in WR stars are required. However the optical counterpart of 4U220654 is a late O star of moderate luminosity (Class III or V). According to NR01, the putative companion could be a B star. Such a system can not produce the hard X-ray emission observed in this system. The presence of a BH or a NS is, therefore, required.
First we analyze the parameters deduced from the ’standard’ thermal comptonization plus blackbody emission model (comptt + bb in Table 5). Under this interpretation we first note that the temperature of the injected soft photons () is rather high while the luminosity of the source is very small. In order to reconcile these two facts, a small emission area must be invoked. We therefore compute the radius of the Wien soft photon source by equating the bolometric luminosity of the soft photon source with that of a black body of area (In’t Zand et al. 1999):
| (1) |
where is the comptonization parameter which gives the relative gain of energy from the inverse Compton scattering. is the flux of the comptonized component of the model, corrected for absorption, in units of erg s-1 cm-2. This is obtained by integrating the spectrum. For the parameters given in Table 5 we obtain km (XTE 1997), km (SAX 1998) and km (XTE 2001).
On the other hand, we note that the temperature of the Compton cloud is very high ( 50 keV), of the order of those found in BHCs. The source is harder (higher color ratio) when the luminosity is lower (see table 5). However, these ’state transitions’, typical for BHCs, have been observed also in some pulsars specially in low regimes.
The best single component model fit is achieved by applying the Bulk Motion Comptonization model. This model reproduces rather well the whole spectrum, without the addition of other components, both at high and at low energies.
The BMC model (Titarchuk et al. tmk:97 (1997), Shrader & Titarchuk st:98 (1999)) is a general model for comptonization of soft photons which uses the Green’s (spread) functions for the treatment of upscattering and which takes the form of a broken powerlaw. This formalism is valid for any kind of comptonization (bulk comptonization in first order , thermal comptonization in second order ) and remains valid up to photon energies comparable to the mean plasma energy ( in the case of bulk motion). This model has been applied successfully to BH systems. The origin of the soft component is the innermost disk zone where the gravitational energy of matter is released due to viscous dissipation as well as geometric compression of the matter. By itself, however, this is not a proof for the presence of a BH in the system since it can be applied also to accretion onto Neutron Stars. In this case the source of soft photons is the surface of the compact object. Either the disk or the surface (or both) emit a soft black body like spectrum with a characteristic color temperature . The comptonizing region (a compton cloud or a boundary layer) must cover effectively this zone (i.e. the innermost region of the disk or the spot over the surface) in order to be exposed to a high fraction of the seed photons.
One of the three free parameters of BMC model is a power law spectral index related to the Comptonization efficiency. When is smaller the efficiency is higher (for details see ST80). A value close to 1 (vg. in SAX-1998 data) indicates that the source is undergoing a phase transition from the low-hard to high-soft state. These transitions can be caused by the redistribution of mass accretion rates between Keplerian (disk) and sub-Keplerian components or by an increase of the optical depth for gravitational energy release at the shock (BH case) or at the surface (NS case). These spectral transition models were studied and discussed in detail by Zel’dovich & Shakura (1969), for the NS case, Chakrabarti & Titarchuk (1995) for the BH case and Titarchuk & Fiorito (2004), for the BH and NS cases. In Figure 5 we show the strong correlation between the spectral index and the color ratio (CR). This plot shows that the source is softer when it is brighter (because the upscattering is less efficient when luminosity increases). That is to say, the comptonization parameter decreases when luminosity (pressumably the mass accretion rate) increases (Titarchuk & Fiorito, 2004).

The large value (1), which is the ratio of the number of photons multiply scattered in the converging inflow to the number of photons in the thermal component, indicates that the soft spectrum has been fully comptonized and that, as a matter of fact, we do not see the source of soft photons at all. The Compton cloud completely obscures the BMC region, namely, the innermost part of the accretion disk or the surface of the NS.
Again, to reconcile the high color temperature of the soft emitting region keV with the low intrinsic luminosity () a small emission area must be invoked. Indeed, we can make use of the comptonization enhancement factor where is the soft photon source luminosity and is the resulting comptonized luminosity (Titarchuk et al. tmk:97 (1997), eq. 37). For this is equivalent to where . Using the BeppoSAX data () from Table 5 and assuming a Compton cloud of keV (deduced from the thermal comptonization model) we can derive the luminosity of the soft photon source (which we do not see) and gives erg s-1. Such a low luminosity cannot be produced in a inner accretion disk of this temperature (). Borozdin et al. bo:99 (1999) (see Eq. 9 and Fig. 9 in that reference) show that a disk of temperature 1 keV has necessarily a relatively high luminosity of the order of erg s-1that contradicts the observable luminosity of the soft component. Assuming that this luminosity is radiated by a blackbody with an area and temperature we can deduce (following the same argumentation to deduce equation 1) that [km] where is in units of erg s-1. For the values given above this yields 0.7 km. This is somewhat smaller than the values deduced previously and stresses the need for a small emission area. Clearly, it is not possible to have a contribution from a disk in this system because the inner region of an accretion disk at these temperatures would produce a much higher X-ray luminosity. Since the radius of the soft photon region is km, we conclude that the only viable candidate is a polar cap on a NS surface.
The BMC model implies an absorption column which is compatible with the expected interstellar value (NH, using the relation of Bohlin et al. bo:78 (1978) and deduced from optical data, NR01). This can be explained if the resulting comptonized spectrum is not absorbed further beyond the comptonizing material close to the X-ray source. That is to say, the circumstellar environment (surrounding the optical star) should be tenuous at the site of the compact object. This is consistent with the hypothesis that the compact object orbits a main sequence ’classical’ O star (i.e. with neither a strong stellar wind, as in supergiants nor a circumstellar envelope as in Be type stars) and also with the lack of any detectable fluorescence iron line produced in a cold thick surrounding medium.
This rarefied medium also contributes to the low luminosity. Indeed the mass loss ratio between a O9.5V and a O9.5I star is (De Jager et al. 1988):
| (2) |
So, roughly speaking, we have a factor of 102 less material to power the X-ray source in a Main Sequence star, like BD53∘2790 appears to be, than for a supergiant system like Vela X-1 and thus also a luminosity lower by the same factor.
At present, none of the characteristics that can establish unambiguously the nature of the compact object (pulsations, Type I outbursts, mass function, etc) have been established for this system. As discussed before, however, the system lacks an inner accretion disk, and the emission area is of the order of 1 or 2 km. This is only consistent with emission from a hot spot on a NS surface. Note that this conclusion is based on two different models.

Other proofs, although circumstantial, also point to the NS hypothesis. For instance the negative–positive exponential model (NPEX Mihara et al. 1995) gives a comparably satisfactory fit to the data. This model is commonly used to describe the the spectra of pulsars (Mihara et al. 1995, Makishimaet al. 1999, Kreykenbohm et al. 2002). The NPEX model has been successfully fitted to several neutron star spectra like Vela X-1 (Kreykenbohm 2002). For 4U220654 the resulting fit is acceptable (= 1.2, see Fig. 6b) or excellent (= 0.6, see Fig. 6c), using an additional low energy component like a black body. The parameters obtained are quite similar to those found in pulsar spectra.
3.1 A cyclotron line at keV?
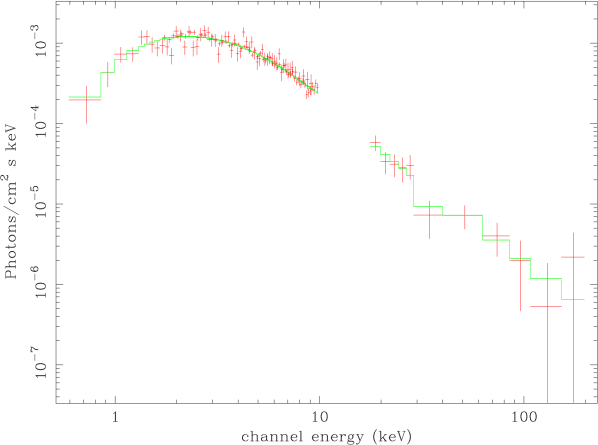
One final point deserves attention. In Figs. 3 and 4, an absorption dip around 30 keV is observed. We were first tempted to identify the dip as a cyclotron absorption. The addition of a cyclotron line does, however, not improve the fit. Furthermore, it is only one energy bin in both spectra which is below the continuum level, so an absorption feature cannot be claimed. However, it is intriguing that the same feature can be seen in all the spectra, i.e., spectra taken with different instruments and different epochs. Furthermore, although the npex model is a completely different description of the spectrum, the unexplained “dip” at 30 keV is also present (see Fig. 6). Therefore, we are inclined to think that a very weak absorption feature is really present in the data.
In order to obtain some information about the line we have first ignored the energy bins from 25 keV to 32 keV. Then we fit the BMC model. Next we freeze these parameters, add a cyclotron absorption feature (cyclabs in xspec terminology), notice again energy bins from 25 keV to 32 keV, and refit. Finally we thaw all parameters of the model and fit again. The continuum and line are shown in figure 7. For the XTE-2001 spectrum, the line is centered around keV, with a width of 1 keV and an optical depth .
Unfortunately the uncertainties are large and the analysis of the background does not allow to reject the presence of calibration effects so we can go no further on this issue with the available data. Further observations of the source at higher spectral resolution are required.
If we interpret this feature as a cyclotron resonant scattering feature this would identify the source unambiguously as a neutron star with a magnetic field of the order of G, taking into account the gravitational redshift. As a matter of fact we need a strong magnetic field if the material is to be funneled to the small pole caps.
The Alfvén radius is inversely proportional to the accretion luminosity and directly proportional to the magnetic field ( where , Frank et al. 2002). 4U220654 presents a combination of low luminosity and thus, presumably, low accretion ratio, and (possibly) a strong magnetic field. This radius could then be rather large and help to truncate the accretion disk (if any) very far from the compact object.
The lack of the inner accretion disk in the system can explain several observational facts:
-
•
the lack of a fluorescence iron line which would originate in the cool parts of an irradiated disk
-
•
the system presents no radio emission down to 0.04 mJy (Ribó et al. priv. comm.). Radio emission would be due to radio jets whose formation is strongly hampered without the inner disk
-
•
the lack of outbursts over the years: without an inner disk there is no large reservoir of matter which could undergo large scale perturbations; instead the source accretes directly from the thin steady stellar wind.
If the system has a strong magnetic field, why do not we observe pulsations?. This could be explained by the very hot Compton Cloud ( keV) of this system that can wipe out the pulsations (Titarchuk et al. 2002). As a matter of fact, we see the radiation fully comptonized while the source of soft photons (presumably the hot spot) is completely obscured. Then it is not strange that we miss the pulsations in this system. This leaves open the question, however, why the compton cloud si so hot in this system and why we do not observe pulsations in other similar systems. Of course, other possibility is that the rotational axis and the magnetic axis might not be offset (or very little offset). Further observations will be necessary to asses this issues.
4 Conclusions
-
1.
The spectrum of 4U220654 can be well described by comptonization models. These models show soft radiation with temperatures – keV comptonized by a hot plasma at 50 keV. This comptonization produces a hard tail visible up to, at least, 100 keV.
-
2.
Application of the BMC Comptonization model to the data shows that the soft radiation is completely comptonized. Namely the observer does not see the direct blackbody radiation (presumably) from NS surface.
-
3.
The temperature of the seed photons, along with the low luminosity point to a small emission area ( km radius) and contradicts the presence of an accretion disk.
-
4.
The lack of a fluorescence iron line, the lack of radio emission and the lack of outbursts throughout the years also argue against the presence of an accretion disk in this system.
-
5.
Points 3 and 4 put stringent restrictions on the origin of the seed photons which must be emitted from a hot spot on a NS surface.
-
6.
The X-ray lightcurve shows no evidence of any coherent pulsations at any explored energy range (0.5–60 keV). It presents the erratic flaring characteristic of accretion from the wind of a massive companion. A possible explanation for the lack of pulsations is that these are wiped out by the very hot Compton cloud.
-
7.
Finally, an absorption dip around 29 keV is present which, if interpreted as a CRSF, would identify the system unambiguously as a NS binary. Unfortunately, the significance is very low and it is not possible to rule out the possibility of calibration effects with the available data. Further observations are required to definitely asses this important issue.
Acknowledgements.
BeppoSAX is a joint Italian-Dutch project. This research has been supported by research grants ESP2001-4541-PE, ESP2002-04124-C03-03 of the Ministerio de Ciencia y Tecnología. JMT acknowledges the hospitality of the High Energy Astrophysics Group in Tübingen, Germany, under the grant Acción Integrada Hispano Alemana HA2000-0034, during which part of this work was written. IN is researcher from the Ramón y Cajal programme of the Ministerio de Ciencia y Tecnología. This research has made use of the HEASARC data base at the NASA Goddard Space Flight Center.References
- (1) Anders E., Grevesse N., 1989, Geochimica et Cosmochimica Acta 53, 197
- (2) Arnaud K.A. 1996, in Astronomical Data Analysis Software ans Systems V, ASP Conf. Ser., 101, 17
- (3) Bildsten L. et al. 1997, ApJS 113, 367
- (4) Boella G., Chiappetti L., Conti G., et al., 1997, A&AS 122, 327
- (5) Bohlin R.C., Savage B.D., Drake J.F. 1978, ApJ 224, 132
- (6) Borozdin K., Revnivtsev M., Trudolyubov S. et al., 1999, ApJ 517, 367
- Bradt et al. (1993) Bradt, H. V., Rothschild, R. E., & Swank, J. H. 1993, A&AS, 37, 355
- (8) Chakrabarti, S.K. & Titarchuk, L. 1995, ApJ, 455, 623
- (9) Cooke B.A., Fabian A., Pringle J.E., 1978, Nature 273, 645
- (10) Corbet R.H.D., Peele A.G. 2001, ApJ 562, 936 (CP01)
- (11) De Jager et al. 1998 A&AS
- (12) Frank J., King A., Raine D., 2002, Accretion Power in Astrophysics, Cambridge University Press
- (13) Frontera F., Costa E., Dal Fiume D., et al., 1997, A&AS 122, 371
- (14) Giacconi R. et al. 1972, ApJ 178, 281
- (15) Hua X., Titarchuk L. 1995, ApJ 449, 188
- (16) In’t Zand, J. et al. 1999, A&A 345, 100
- Jahoda et al. (1996) Jahoda, K., Swank, J. H., Giles, A. B., et al. 1996, in EUV, X-ray, and Gamma-Ray Instrumentation for Astronomy VII, Proc. SPIE, ed. O. H. Siegmund & M. A. Gummin, Vol. 2808, SPIE, 59–70
- Kreykenbohm et al. (1999) Kreykenbohm, I., Kretschmar, P., Wilms, J., et al. 1999, A&A, 341, 141
- Kreykenbohm et al. (2002) Kreykenbohm, I., Coburn, W., Wilms, J., et al. 2002, A&A, 395, 129
- Leahy et al. (1983) Leahy, D. A., Darbo, W., Elsner, R. F., et al. 1983, ApJ, 266, 160
- (21) Lewin W.H.G., van Paradijs, J. van den Heuvel E. 1995, X-ray Binaries, Cambridge University Press
- Levine et al. (1996) Levine, A. M., Bradt, H., Cui, W., et al. 1996, ApJ, 469, L33
- Makishima et al. (1999) Makishima, K., Mihara, T., Nagase, F., & Tanaka, Y. 1999, ApJ, 525, 978
- (24) Mihara T. 1995, PhD Thesis, Dep. of Physics, University of Tokyo
- (25) Morrison D., McCammon D., 1983, ApJ 270, 119
- (26) Negueruela I., Reig P., 2001, A&A 371, 1056 (NR01)
- (27) Parmar A.N., Martin D.D.E., Bavdaz M., et al., 1997, A&AS 122, 309
- (28) Pollock A.M.T., 1987, ApJ 320, 283
- Rothschild et al. (1998) Rothschild, R. E., Blanco, P. R., Gruber, D. E., et al. 1998, ApJ, 496, 538
- (30) Ryter C., Cesarsky C.J., Audouze J 1975, ApJ 198, 103
- (31) Saraswat P., Apparao K.M.V., 1992, ApJ 401, 678
- (32) Shrader C.R., Titarchuk L. 1998, ApJ 499, L31
- Stark (1997) Stark. 1997, PCABackEst Information Homepage, http://ww2.lafayette.edu/~starkm/pca/pcabackest.html
- (34) Steiner J.E. et al. 1984, ApJ 280, 688
- (35) Sunyaev, R.A. & Titarchuk, L. 1980, A&A, 86, 121 (ST80)
- (36) Thaller M.L., Gies D. et al. 2001, ApJ 554, 1070
- (37) Titarchuk L. 1994, ApJ 434, 570
- (38) Titarchuk L., Mastichiadis A., Kylafis N.D. 1997, ApJ 487, 834
- (39) Titarchuk L., Shrader C.R., 2002, ApJ 567, 1057
- (40) Titarchuk, L., Cui, W. & Wood, K. 2002, ApJ, 576, L49.
- (41) Titarchuk, L. & Fiorito, R. 2004, ApJ, submitted
- (42) Zel’dovich, Y.B. & Shakura, N.I. 1969, Sov. Astron. 13, 175