Revealing the X-ray emission processes of old rotation-powered pulsars:
XMM-Newton Observations of PSR B0950+08,
PSR B0823+26 and PSR J2043+2740
Abstract
We have completed part of a program to study the X-ray emission properties of old rotation-powered pulsars with XMM-Newton in order to probe and identify the origin of their X-radiation. The X-ray emission from these old pulsars is largely dominated by non-thermal processes. None of the observed spectra required adding a thermal component consisting of either a hot polar cap or surface cooling emission to model the data. The X-ray spectrum of PSR B0950+08 is best described by a single power law of photon-index . Taking optical data from the VLT FORS1 into account a broken power law model with the break point keV and the photon-index and for and , respectively, is found to describe the pulsar’s broadband spectrum from the optical to the X-ray band. Three- temperature upper limits for possible contributions from a heated polar cap or the whole neutron star surface are K and K, respectively. We also find that the X-ray emission from PSR B0950+08 is pulsed with two peaks per rotation period. The phase separation between the two X-ray peaks is (maximum to maximum) which is similar to the pulse peak separation observed in the radio band at 1.4 GHz. The main radio peak and the trailing X-ray peak are almost phase aligned. The fraction of X-ray pulsed photons is . A phase-resolved spectral analysis confirms the non-thermal nature of the pulsed emission and finds no spectral variations as a function of pulse phase. Detailed pulse profile simulations using polar gap, outer gap and the two-pole caustic model constrain the pulsar’s emission geometry to be that of an almost orthogonal rotator, for which the two-pole caustic model can reproduce the observed doubly peaked X-ray pulse profile. The spectral emission properties observed for PSR B0823+26 are similar to those of PSR B0950+08. Its energy spectrum is very well described by a single power law with photon-index . Three- temperature upper limits for thermal contributions from a hot polar cap or from the entire neutron star surface are K and K, respectively. There is evidence for pulsed X-ray emission at the confidence level with a pulsed fraction of . For PSR J2043+2740 which is located outside the boundary of the Cygnus-Loop, we report the first detection of X-ray emission. A power law spectrum, or a combination of a thermal and a power law spectrum all yield acceptable descriptions of its X-ray spectrum. No X-ray pulses are detected from PSR J2043+2740 and the sensitivity is low - the pulsed fraction upper limit is assuming a sinusoidal pulse profile.
1 INTRODUCTION
In the past decade, many advances have been made in the study of rotation powered pulsars thanks to X- and -ray observations with a series of high energy astrophysical space missions (for reviews see e.g. Becker & Trümper 1997; Becker & Pavlov 2001; and Kanbach 2001). However, many outstanding scientific issues still remain to be resolved. Understanding the high energy emission processes of old rotation-powered pulsars is one of them.
Although one could use the instruments aboard ROSAT, BeppoSAX and ASCA to disentangle the thermal and non-thermal contributions of the young and cooling neutron stars, the sensitivity of these instruments was not sufficient to study the emission properties of the old field pulsars.
Old rotation-powered field pulsars are of particular interest for the study of particle acceleration and high energy radiation processes on the neutron star surface and in the neutron star magnetosphere. This is because their ages are intermediate between that of the young cooling neutron stars, whose surface may produce copious thermal X-ray photons, and those very old millisecond pulsars, in which non-thermal magnetospheric X-ray production mechanisms are believed to dominate (see e.g. Becker & Trümper 1999, Becker et al. 2003, Webb et al. 2004). The old field pulsars aid in answering questions such as ”How do the emission properties of the younger pulsars like Geminga, PSR 0656+14 and PSR 1055-52 change as they age from to years”? Will the thermal emission simply fade away due to cooling with increasing age or will the star be kept hot (at about K) over millions of years due to energy dissipation by processes such as internal frictional heating ( erg/s) and crust cracking, as proposed by Alpar et al. (1984; 1998) and Ruderman (1998) or by vortex creeping and pinning models (Shibazaki & Lamb 1989; Hirano and Shibazaki, 1997)? What happens to the non-thermal, hard-tail emission seen in the X-ray spectra of the middle aged field pulsars? Will this emission be the dominant source or will this component also decay with time and will only thermal emission from the hot and heated polar-caps remain?
Establishing whether thermal polar-cap emission is present, or not, is of importance in confronting and comparing data with the many magnetospheric emission models which predict hot polar caps (e.g. Arons & Scharlemann 1979; Sturner & Dermer 1995, Zhang & Harding 2000; Harding & Muslimov 2001; 2002; 2003). The heated polar cap is a consequence of pair-creation by the gap discharge, after which a significant amount of highly energetic charged particles is expected to stream back to the neutron star, heating the surface to a few million degrees. Furthermore, many magnetospheric emission models require hot-polar caps in order to lessen the work-function of electrons and positrons in the surface down to eV and thus make it possible to pull out enough electrons for the vacuum gap discharge/break-down (cf. Michel 1991). These models fail if there are no hot-spots. On the other side, Sturner & Dermer (1995) propose that high energy gamma-ray photons are created in pulsar magnetospheres by inverse Compton scattering of relativistic electrons and thermal photons. If this model is correct, the absence of hot polar-caps (i.e. the missing bath of thermal photons) would imply that old – but close-by and still powerful – pulsars are not -ray emitters, in agreement with the current observations.
There are further questions that involve the old pulsar’s energy output. The observed luminosity is but a small fraction of the total energy available due to the rotation of the star. Where is the bulk of the pulsar’s spin-down power going to? Are there pulsar-wind nebulae around these systems not previously detected due to the sensitivity limitations imposed by previous satellites?
Up to now, only three old, non-recycled, pulsars have been detected and all the detections were close to the sensitivity limits of the instruments, thus strongly limiting the ability to explore the physical emission processes at work in these neutron stars. The detected pulsars are PSR B1929+10 (Helfand 1983; Yancopoulos, Hamilton & Helfand 1994), B0950+08 (Seward & Wang 1988; Manning & Willmore 1994; Saito 1998) and B0823+26 (Sun et al. 1993). All have a spin-down age of years; magnetic fields of about G; a close distance of kpc and a very small absorption column of (see e.g. Hobbs et al. 2003). Spectral and temporal information was only available for the brightest of these, PSR 1929+10. Its X-ray pulse profile is very broad with a single pulse stretching across the entire phase cycle. The fraction of pulsed photons is (Yancopoulos, Hamilton & Helfand 1994). Its X-ray spectrum, observed with ROSAT, could be equally well fit with a power law (photon-index ) and a black-body spectrum (thermal polar-cap emission, K, m), leaving open the real nature of its emission (Becker & Trümper 1997). Further evidence for a non-thermal nature of the pulsar’s X-ray emission was found by Saito (1998) based on ASCA data and more recently by Wozna et al. (2003) in a joint analysis of archival ROSAT and ASCA data. Both, PSR 1929+10 and PSR B0950+08 are detected at optical wavebands (Pavlov et al. 1996; Zharikov et al. 2002; Mignani et al. 2003).
Making use of the large collection area, as well as the excellent timing, spatial and energy resolution provided by XMM-Newton, the three pulsars PSR B0950+08, PSR B0823+26 and PSR J2043+2740 which all belong to the sub-class of old rotation-driven field pulsars, were observed as part of the guaranteed time and AO1 guest observer program. We list the radio properties of these pulsars in Table 1 and make the comments that follow.
Based on its spin-down age, PSR B0950+08 is the oldest field pulsar among the more than 50 rotation-driven pulsars detected in X-rays (see e.g. Table 3 of Becker & Aschenbach 2002 for a recent list of X-ray detected rotation-powered pulsars). The pulsar’s radio dispersion measure is among the smallest of all known radio pulsars and the dispersion-measure-based distance is is in good agreement with the pc distance deduced from a parallax measurement (Brisken et al. 2002). The low column density implies that it should be feasible to detect soft (below 0.5 keV) X-ray emission from PSR B0950+08.
X-rays from PSR B0950+08 were first detected by Maning & Willmore (1994) in a ROSAT PSPC observation ( source counts). These authors suggested that the emission either came from a K hot polar cap of m or arose from synchrotron or curvature radiation with a power law spectrum of photon-index . Interpreting the soft X-ray emission entirely as arising from the neutron star’s surface, Becker (1994) computed a temperature upper limit of K assuming a 1.4 M⊙ neutron star with a medium stiff equation of state.
PSR B0823+26 has an inferred magnetic field strength that is the highest among the X-ray-detected old field pulsars. X-ray emission from PSR B0823+26 was first discovered using ROSAT (Sun et al. 1993). The ROSAT PSPC count rates were cts/s and cts/s for the keV) and keV) bands, respectively. The small number of detected source counts did not allow one to identify the emission process but the data were in agreement with the hypothesis that the X-rays were emitted from a K hot thermal polar cap of size m. If the soft X-rays were assumed to arise entirely from the neutron star’s surface, a temperature upper limit is K assuming a 1.4 M⊙ neutron star with a medium stiff equation of state (Becker 1994).
PSR J2043+2740 (Thorsett et al. 1994; Camilo & Nice 1995; Ray et al. 1996) is another important representative of the group of old, but non-recycled, pulsars. Its rotation period is the shortest among the old rotation-powered field pulsars. Compared to PSR B0950+08 and PSR B0823+26, its spin-down energy is two orders of magnitude higher whereas its inferred magnetic field strength is similar to that computed for PSR B0950+08. The pulsar’s spin-down age makes it intermediate between the older pulsars PSR B0950+08 & PSR B0823+26 and the cooling neutron stars, which all have a spin-down age of some hundred thousand years (see Table 3 of Becker & Aschenbach 2002). Its radio dispersion-measure inferred distance suggest a medium to low neutral hydrogen column density. The moderate column density is an advantage in searching for X-ray emission from this pulsar, which has never been previously observed by any high energy mission and was not known to emit X-rays. PSR J2043+2740 is located about outside the boundary of the Cygnus-Loop supernova remnant but an association would require that the pulsar’s true age is rather different compared with its spin-down age and that it was born with a very high velocity.
In §2 we describe the XMM-Newton observations of PSR B0950+08, PSR B0823+26 and PSR J2043+2740 and provide the details of the data processing and data filtering. The results of the spectral and timing analysis are given in §3 - §5. We provide a summary and concluding discussion in §6.
2 XMM-NEWTON OBSERVATIONS AND DATA REDUCTION
PSR B0950+08 was observed with XMM-Newton on May , 2002 (XMM revolution 442) for a total on-source time of 101 168 s. The MOS1 camera was operated in imaging (PrimeFullWindow) and timing (FastUncompressed) mode for 53.2 ksec and 27.8 ksec, respectively. The MOS2 camera was used in imaging mode exclusively for 83.7 ksec. The EPIC-PN exposure time was 82.9 ksec. The EPIC-PN camera was set to operate in small-window mode to provide imaging, spectral and timing information with a temporal resolution of 5.67 ms. The higher temporal resolution of the EPIC-PN is achieved at the cost of a 30% higher detector dead time and a reduced field of view of arcmin (see e.g. Becker & Aschenbach 2002 for a summary of XMM instrument modes suitable for pulsar studies). The medium filter was used for the EPIC-PN and the MOS1/2 in all exposures of PSR B0950+08.
PSR B0823+26 was observed on April 26, 2002 (XMM revolution 436) for a total on-source time of ksec. The instrument configuration was similar to that used for observing PSR B0950+08. The observation of PSR J2043+2740 was performed on November , 2002 (XMM revolution 541) for a total on-source time of 17 ksec. For these observations the MOS1/2 cameras were both operated in imaging mode and the EPIC-PN camera was setup to work in small-window mode with the thin filter. We found that this setup guaranteed a much more efficient use of the XMM-EPIC detectors as opposed to swapping the MOS1 from imaging to timing mode during the observations. A summary of exposure times and instrument modes used for each of the observation is given in Table 2.
XMM-Newton data have been seen to show timing discontinuities in the photon arrival times with positive and negative jumps of the order of one to several seconds (Becker & Aschenbach 2002; Kirsch et al. 2003). Inspecting the log-files from our processing of raw data we found that the EPIC-PN data of PSR B0950+08 exhibited clock discontinuities showing three positive jumps of 1s randomly distributed over the observation. We found no evidence for clock discontinuities in the PSR B0823+26 and PSR J2043+2740 data. We therefore used the SAS development track software (xmmsas_20040212_2158-dt) which corresponds to the beta-release of XMM-SAS Version 6.0 for the analysis of the EPIC-PN data and which detects and corrects most timing discontinuities during data processing. In addition, known timing offsets due to ground station and space craft clock propagation delays are corrected by this software. The MOS1/2 data of PSR B0950+08, PSR B0823+26 and PSR J2043+2740 were analyzed using XMM-SAS Version 5.4.1.
Data screening for times of high background was done by inspecting the lightcurves of the MOS1/2 and PN data at energies above 10 keV. Strong X-ray emission from soft proton flares are seen in the observations of PSR B0950+08 and PSR B0823+26. Creating the lightcurves with bins of 100s, we rejected those bins where the MOS1/2 lightcurves had more than 140 cts/bin. For EPIC-PN data we rejected times with more than 13 cts/bin. The observation of PSR J2043+2740 was not affected by times of high background so that we could use all MOS1/2 data, but we still rejected data with more than 13 cts/bin for the EPIC-PN data analysis.
For PSR B0950+08 the data screening reduced the effective exposure time for the imaging modes of MOS1 and MOS2 to 19.8 ksec and 65.7 ksec, respectively. For the EPIC-PN data the effective exposure time was reduced to 48.9 ksec. The fast timing mode data of MOS1 in which, for the sake of a higher temporal resolution, all events from the central MOS1-CCD are collapsed into a 1D-image, were not considered as these data are superseded in quality by the EPIC-PN small-window data. For PSR B0823+26 and PSR J2043+2740 the effective exposure times for the MOS1/2-CCDs are 65.6 ksec and 33 ksec, respectively. The larger dead time, as well as the applied filter criteria, reduced the effective exposure time for the EPIC-PN observations of PSR B0950+08 and PSR J2043+2740 to 33.9 ksec and 10.8 ksec, respectively.
For the spectral analysis based on the MOS1/2 data we used only those events with a detection pattern between (i.e. single, double and triple events) and the flag parameter set to less than or equal to 1. The latter criterion excludes events which are located near to a hot pixel, or to a bright CCD column, or which are near to the edge of the CCD. For the EPIC-PN timing and spectral analyzes, we used only single and double events, i.e. those which have a pattern parameter of less than, or equal to, 4 and a flag parameter equal to zero. The energy range of the MOS1/2 and EPIC-PN CCDs was restricted to keV. The accuracy of the detector response matrix towards softer energies does not support the inclusion of photons below 0.3 keV.
Because of the low counting rates, the RGS data were found to be of limited use and was ignored for the purpose of this paper. PSR B0950+08 has an optical counterpart at (Zharikov et al. 2002). This is, however, orders of magnitudes fainter than the limiting sensitivity of the optical monitor (OM) aboard XMM-Newton. Similar optical fluxes are expected for PSR B0823+26 and PSR J2043+2740 so that we also do not report on the analysis and processing of the OM-data.
3 PSR B0950+08
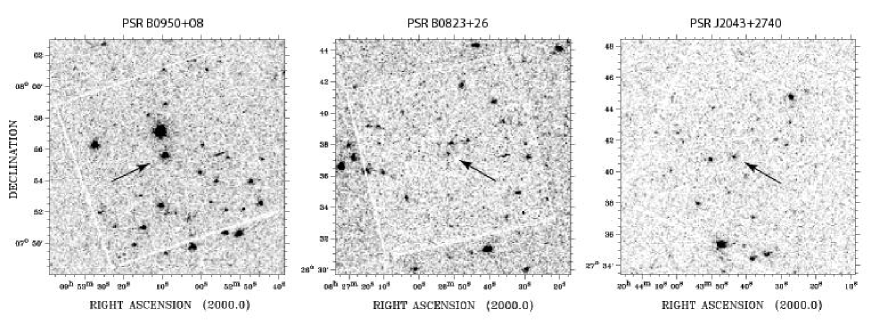
The X-ray counterpart of PSR B0950+08 is detected with high significance in both the MOS1/2 and EPIC-PN data. The counting rates are cts/s (MOS1/2) and cts/s (EPIC-PN) within the keV band. The maximum-likelihood source-detection did not yield any evidence for a spatial extent of the pulsar’s counterpart of larger than 15 arcsec, corresponding to the HEW (Half Energy Width) of the instruments’ point spread function. An image of the pulsar field based on the merged MOS1/2 data is given in Figure 1.
3.1 Spectral Analysis
The pulsar’s energy spectrum was extracted from the MOS1/2 data by selecting all events detected in a circle of radius 50 arcsec centered on the pulsar position. Using the XMM-Newton/EPIC-MOS model point spread function, 90% of all the events from PSR B0950+08 are within this region. The presence of the X-ray source RX J095310.4+075712 located arcmin near to the pulsar (cf. Figure 1) precluded the extraction of the background spectrum from an annulus surrounding the pulsar. We therefore extracted the background spectrum from a source free region of 60 arcsec radius near to the pulsar at RA(2000) , DEC .
For the EPIC-PN data we used an extraction radius of 33 arcsec radius, centered on the pulsar. This selection region includes 85% of the point source flux. As the aim point is relatively close to the edge of the PN-CCD #4, we extracted the background spectrum from a source free region about one arc-minute east of the pulsar at RA(2000) , DEC . Although out-of-time events are small in the PN-timing mode, they prevent one from extracting background spectra from a region located below the source and along the CCD read-out direction.
In total, the extracted spectra include 1458 EPIC-PN source counts and 707 EPIC-MOS1/2 source counts. The spectral data were dynamically binned so as to have at least 25 counts per bin. Model spectra were then simultaneously fit to both the EPIC-PN and MOS1/2 data.
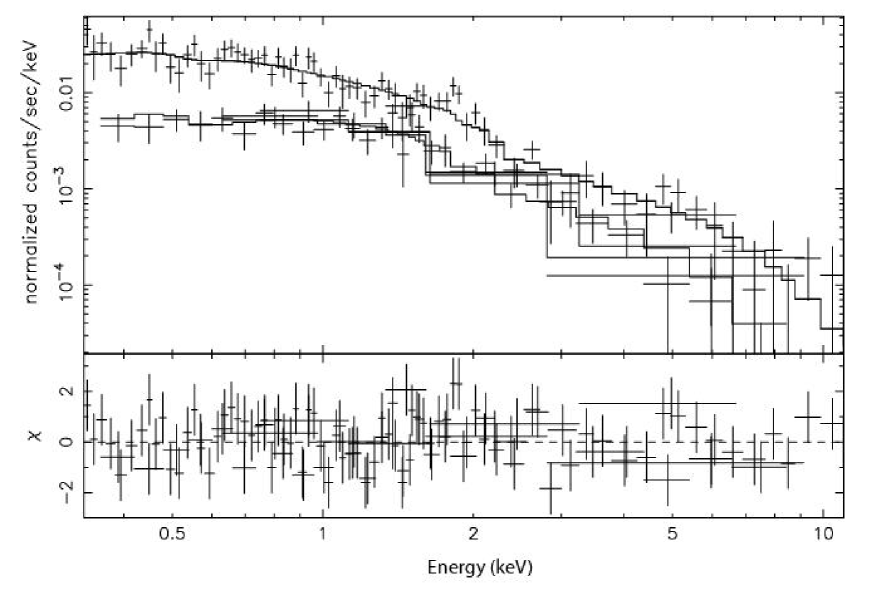
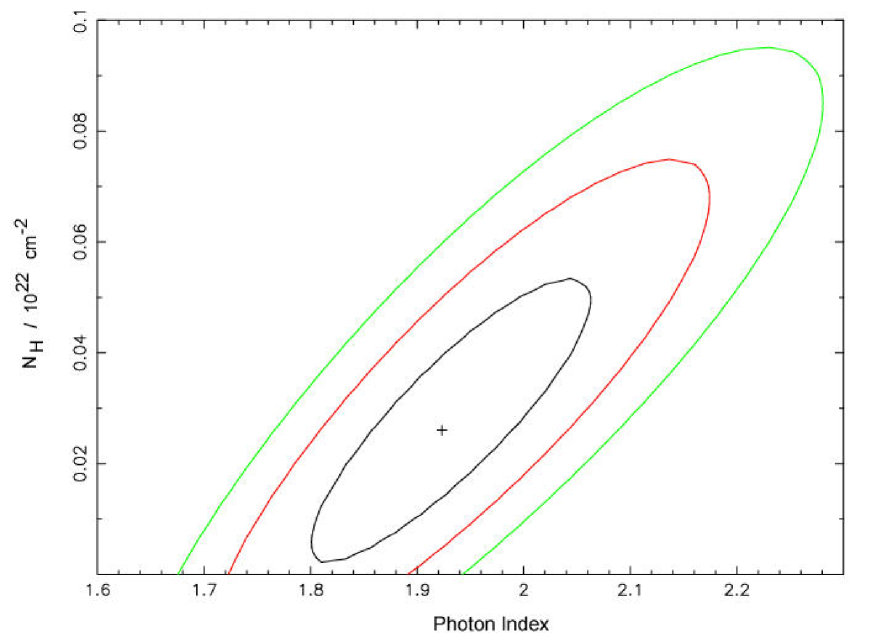
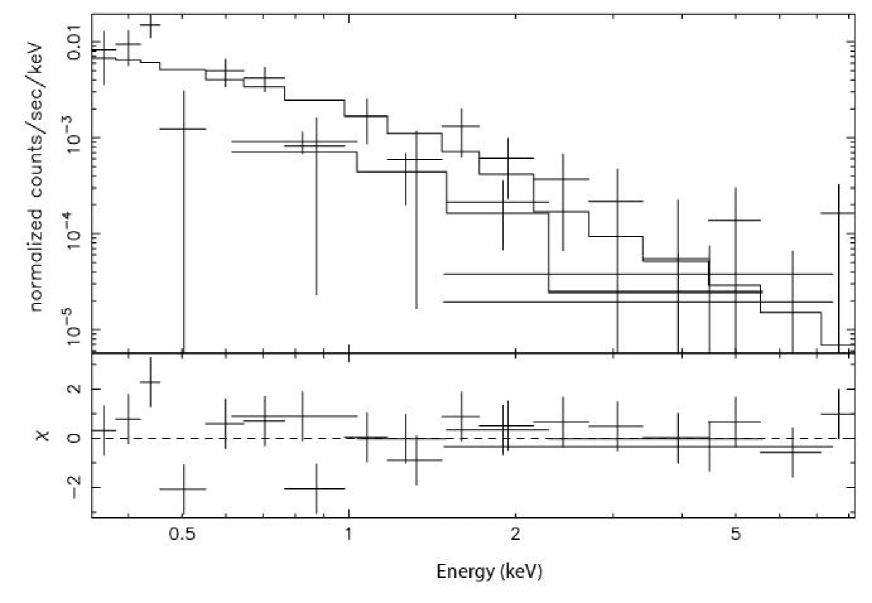
Amongst the single component spectral models, a power law model was found to give the statistically best representation (=97.5 for 112 dof) of the observed energy spectrum. A single blackbody (=280 for 112 dof) or a composite spectral model consisting of two blackbody components (=279 for 110 dof) did not give acceptable fits. The best-fit power law spectrum and residuals are shown in Figure 2. Contour plots showing the relationship between the photon index and the column absorption for various confidence levels are shown in Figure 3.
The power law model yields a column absorption of , a photon-index and a normalization of photons cm-2 s-1 keV-1 at keV. The errors represent the confidence range computed for two parameters of interest. The column density is in fair agreement with the neutral hydrogen column density deduced from the radio dispersion measure. For the unabsorbed energy flux we measured in the keV band, yielding an X-ray luminosity of . For the ROSAT energy band, keV, we measured the flux to be , yielding an X-ray luminosity of . These luminosities imply a rotational energy to X-ray energy conversion factor of within keV and if transformed to the ROSAT band.
Energy spectra of cooling neutron stars like Geminga (Caraveo et al. 2004), PSR 0656+14 (Greiveldinger et al 1996; Kennea, Becker & Cordova 2004) and PSR 1055-52 (Becker & Aschenbach 2002) are found to be adequately represented by spectral models consisting of three different components. Two blackbody components representing the surface cooling and hot polar cap emission and a non-thermal component dominating the energy range beyond keV.
Clearly, our analysis of the spectral data from PSR B0950+08 does not require all three components. We therefore tried fitting the data with a composite model consisting of a blackbody and a power law. The blackbody spectral component then represents either thermal emission from a heated polar cap or residual cooling emission from the whole neutron star surface whichever is more dominant.
Leaving free all fit parameters resulted in a model spectrum in which the power law parameters were similar to those found in the single component power law fit. The thermal component had a temperature of K and a normalization of . For the pulsar located at a distance of pc, this corresponds to an emission radius of m which is unphysically small to be acceptable.
For comparison, defining the size of the presumed polar cap as the foot points of the neutron star’s dipolar magnetic field, the radius of the polar cap area is given by with being the neutron star radius, c the velocity of light and P the pulsar rotation period (see e.g. Michel 1991). For PSR B0950+08 with a rotation period of 253 ms this yields a polar cap radius of m, i.e. more than hundred times the value obtained in the spectral fit.
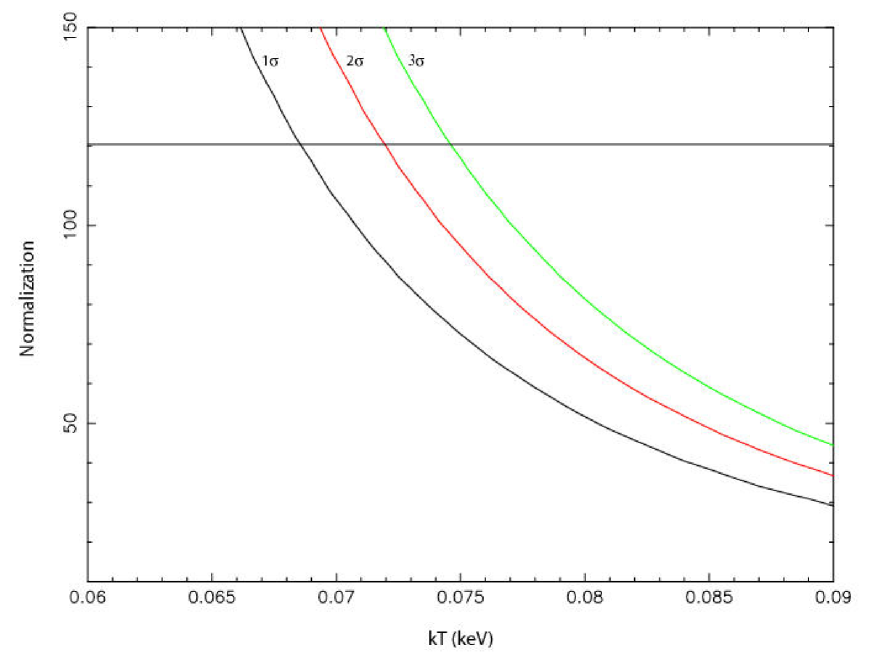
As the thermal spectral component contributes mostly below keV, the fitted column absorption is found to be a steep function of the blackbody emitting area (normalization) and temperature. To determine polar cap and surface temperature upper limits which are in agreement with the observed energy spectrum and column absorption we fixed the absorption of the composite model to the upper bound set by the confidence range deduced in the single power law fit. We then computed the confidence ranges of the blackbody normalization and temperature by leaving all other parameters free. The resulting contours, computed for two parameters of interest, are shown in Figure 4. For a polar cap size of radius 287 m we can set a polar cap temperature upper limit of K assuming a contribution from one polar cap only. For the thermal contribution coming from two polar caps the temperature upper limit is K. If we allow the thermal emission to be emitted from the whole neutron star surface of 10 km radius we find a surface temperature upper limit of K.
3.1.1 Multi-wavelength Spectrum
The results of a UBVRI photometry of PSR B0950+08, using the FORS1 at the VLT UT1, were recently reported by Zharikov et al. (2003). The authors measured the pulsar’s optical magnitude in the different spectral bands to be B, V, and (Johnson-Cousins system). A spectral fit to these data revealed a non-thermal spectrum with a photon-index of , albeit with large residuals (Zharikov et al. 2003). In order to investigate the pulsar’s broadband spectrum we adopted the optical magnitudes from Zharikov et al. (2003) and converted them to a monochromatic photon flux in the respective energy bands. Extrapolating the power law spectrum which describes the XMM-Newton data to the optical bands yields a photon flux which exceeds the measured one by more than an order of magnitude. This suggest that the broadband spectrum, if entirely non-thermal, has to break somewhere before or in the soft channels of the X-ray spectrum. We employ a broken power law model to parameterize the break between the optical and X-ray data. This model yields an acceptable description of both data sets (= 117 for 115 dof) with the break point fitted at . The photon-index for and is found to be and , respectively, with a normalization of photons cm-2 s-1 keV-1 at 1 keV. The column absorption is fitted to be . The errors represent the confidence range computed for two parameters of interest.
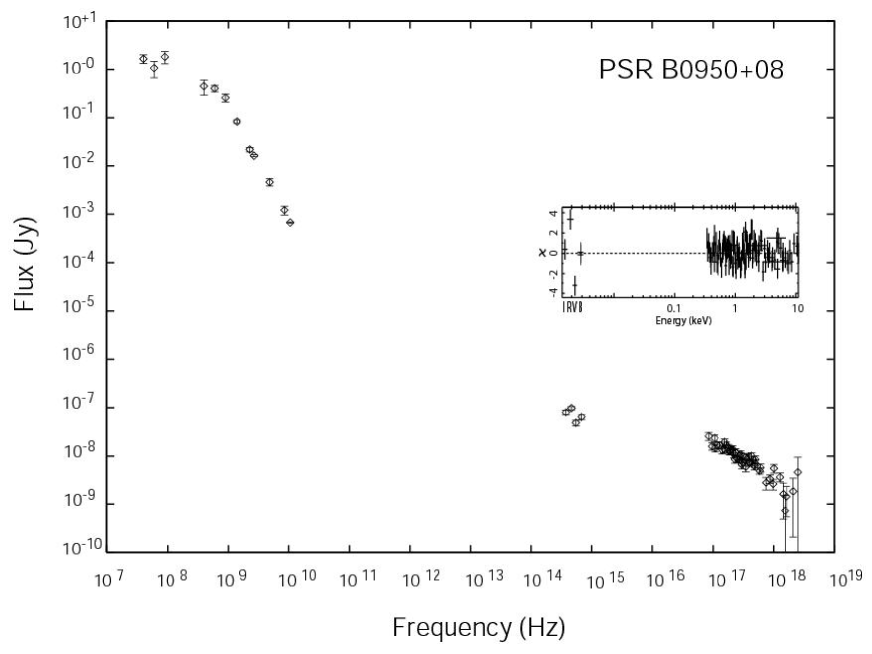
In order to construct a broadband spectrum combining all spectral information available from PSR B0950+08 we adopted the radio spectrum from Malofeev et al. (1994) and plotted it in Figure 5 together with the optical and X-ray spectral data from the VLT and XMM-Newton. The inset depicts the errors from fitting the broken power law model to the optical and X-ray data. The residuals for the fit to the optical data from the R- and V-filters are of the order of as found from the single power law fit by Zharikov et al. (2003). The radio spectrum is not steep () up to 2 GHz but then steepens to . The flux in the radio part of the spectrum, which is supposed to be due to coherent radiation, is several orders of magnitude greater than the extrapolated optical or X-ray fluxes.
3.2 Timing Analysis
We used the EPIC-PN small-window mode data for the timing analysis. The temporal resolution of 5.67ms, available in this mode, is more than sufficient to resolve the 253 ms period from PSR B0950+08. Events were selected from a circle of 25 arcsec radius centered on the pulsar. This extraction region contains 80% of the point source flux. For the barycenter correction we applied the standard procedures for XMM-Newton data using barycen-1.17 and the JPL DE200 Earth ephemeris to convert photon arrival times from the spacecraft to the solar system barycenter (SSB) and the barycentric dynamical time (TDB). The pulsar’s radio position, RA(2000) , DEC , was used for the barycenter correction.
PSR B0950+08 is regularly monitored in the radio band using the Max-Planck 100m radio telescope in Effelsberg. In addition, pulsar ephemerides from the Princeton radio pulsar database111The Princeton radio pulsar database is available from ftp://pulsar.princeton.edu/gro/psrbin.dat were used for the analysis. The pulsar’s spin-parameters and are therefore known with high precision and can be extrapolated with sufficient accuracy to the mean epoch of the XMM-Newton observation: MJD=52403.2576249456 (TDB@SSB). PSR B0950+08 is not known to show timing irregularities (glitches) so that we can fold the photon arrival times using the extrapolated rotation frequency and frequency time derivative.
The statistical significance of the pulsations was computed using the -test with harmonics in combination with the H-Test to determine the optimal number of harmonics (De Jager 1987; Buccheri & De Jager 1989). The optimal number of phase bins for the representation of the pulse profile was computed by taking into account the signal’s Fourier power and the optimal number of harmonics deduced from the H-Test (see Becker & Trümper 1999).
Within the keV energy band, 1730 events were available for the timing analysis of which is estimated to be background. The -test gave 52.96 with 3 harmonics. According to the H-Test, the probability of measuring this quantity by chance is thus establishing PSR B0950+08 firmly as an X-ray pulsar.
By restricting the timing analysis to the keV and keV energy bands, respectively, we found that most of the power of the pulsed emission is coming at energies below 2.0 keV. The number of counts available in this bands are 1328 and 378, respectively, with a 12% and 40% background contribution. Within the keV band the -test gave 50.83 for n=3 harmonics (corresponding to chance occurrence) whereas in the keV band we found for n=2 harmonics (corresponding to chance occurrence).
We computed the fraction of pulsed events by using a bootstrap method (Swanepoel, de Beer & Loots 1996; Becker & Trümper 1999). For the energy range keV we find . The fraction of pulsed events in the keV and keV energy bands are and , respectively.
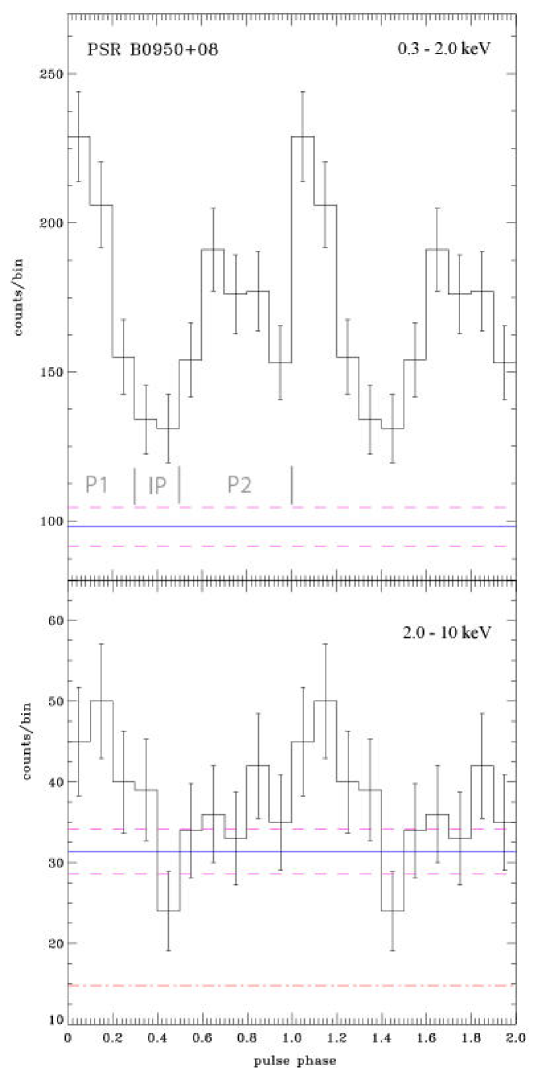
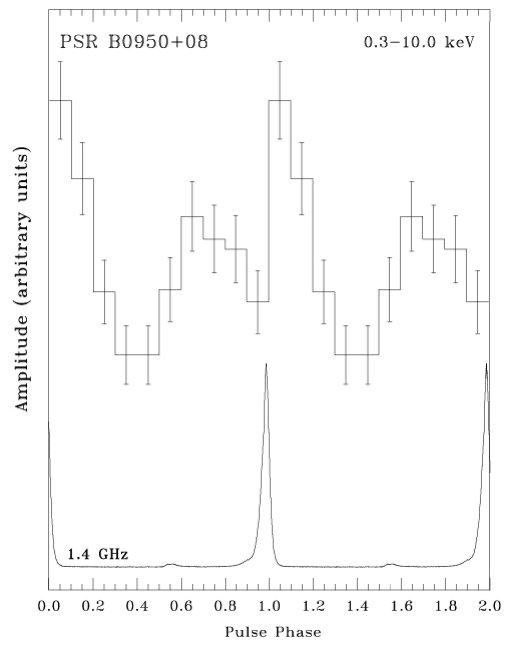
Figure 6 depicts the X-ray pulse profile of PSR B0950+08 for the keV and keV energy bands. As indicated by the higher harmonic content and easily seen in the figure, the pulse shape is not sinusoidal but shows two pulse peaks with a separation of (maximum to maximum) between the peaks. The X-ray pulse profile compared with the radio lightcurve, taken at 1.4 GHz with the Effelsberg radio telescope, is shown in Figure 7. The radio pulse profile shows a similar doubly peaked structure as observed in X-rays, although the interpulse component is much less intense than the main pulse. The phase separation between the two radio peaks is . The similarity of the phase and spacing of the radio and X-ray pulses suggests that the pulsed emission at radio and X-ray wavelengths originates from the same location in the magnetosphere. Computing the absolute phase of the main radio pulse peak using observations with Effelsberg made between revealed that the main radio peak leads the trailing X-ray peak by in phase, depending on if we take the maximum or the center of mass of the peaks as fiducial point (see Figure 7). The phase of the main radio peak at the epoch of the XMM observation is
We note that in order to check the accuracy of the XMM-Newton clock against UTC we analyzed archival Crab-pulsar data taken in March 2002 and October 2003. The phase difference between the arrival of the Crab pulsar’s main radio pulse and the X-ray pulse was fitted to be s and s in the March 2002 and October 2003 data, respectively. Assuming that the Crab pulsar X-ray pulse is phase aligned with the radio pulse the XMM-Newton clock accuracy is better than 1/80 phase bin in the X-ray pulse profile of PSR B0950+08 shown in Figure 6.
3.3 Phase resolved spectral analysis
In order to investigate some possible spectral variations as a function of pulse phase we have performed a phase resolved spectral analysis.
Two approaches are common in this analysis, differing only by the definition of what events are taken for the background subtraction with the sky-and-instrument background selected from a source free region near to the pulsar and events from an apparent off-pulse region in the pulse profile as the usual choices. The later approach, however, suffers from a conceptional problem in that it needs a clear proof that the off-pulse events are indeed not part of the pulsed emission but caused by a different radiation mechanism. This information, however, is usually not available so that defining the interpulse region as off-pulse emission is not physically motivated. The Crab pulsar might be a good example to make this clear. Its off-pulse emission was usually taken as background emission in phase resolved spectral analysis but only recently it was found with Chandra that the pulsar is ”on” throughout its pulse phase (Tennant et al. 2001; Weisskopf et al. 2004), invalidating the apparent off-pulse region as being DC background emission. Simulating pulse profiles makes clear that any apparent off-pulse region as well as DC level and pulsed fraction depend strongly on the viewing geometry under which a pulsar is observed (cf. §6 and Figure 13) and that these parameters are not inherent parameters which might be used to unambiguously characterize the emission process.
We have selected and labeled pulsar events according to Figure 6, defining the phase region as peak one (P1), as the interpulse region (IP) and as peak two (P2) and corrected for the sky and instrument background using the same data as were used for the phase averaged spectral analysis discussed in § 3.1. Before subtracting background the number of events were 641 counts in P1, 961 counts in P2, and 277 counts in the interpulse phase range. All spectral data were dynamically binned so as to have at least 25 counts per spectral bin. The spectra from P1, P2 and IP were then fit to model spectra.
The phase resolved spectra for P1, P2 and IP support the non-thermal character of the pulsar emission. Single blackbody spectra gave large residuals beyond keV with unphysically small normalizations (emitting areas). In contrast, fitting a power law spectrum yields acceptable descriptions of the emission ( for 22 dof; for 34 dof; for 8 dof) in the full keV energy range with no significant spectral variations as function of pulse phase. For the power law index of P1, P2 and IP we found , and , respectively. The corresponding confidence ranges of the column density are , and , respectively, which makes the phase-resolved spectra fully in agreement with the results found in the analysis of the phase averaged spectrum. Thus, within the statistical uncertainties, there is no evidence for spectral variation as function of pulse phase.
4 PSR B0823+26
Although PSR B0823+26 was observed by XMM-Newton with an integration time only about a factor of two less than PSR B0950+08, the number of detected photons was down by more than a factor of eight. We measured an EPIC-PN source count rate of counts/s ( keV). For the MOS1/2 detectors, the average rate was counts/s. The source extent of arcsec (HEW) is in agreement with the point spread function for an on-axis point source. An image of the pulsar field based on the merged MOS1/2 data is given in Figure 1.
4.1 Spectral Analysis
For PSR B0823+26 we used a similar approach as described for PSR B0950+08. To extract the pulsar spectrum from the EPIC-PN and MOS1/2 data, we selected all events within a circle of 33 arcsec centered on the pulsar. For the MOS1/2 data, the background spectrum was extracted from an annulus of 60 arcsec radius at RA(2000) , DEC . For the EPIC-PN data, we selected the background spectrum from a source free region one arc-minute east of the pulsar at RA(2000) , DEC . In total, the extracted spectra included 121 source counts from the EPIC-PN and 70 source counts from the EPIC-MOS1/2. The data were binned to achieve at least 20 counts per bin.
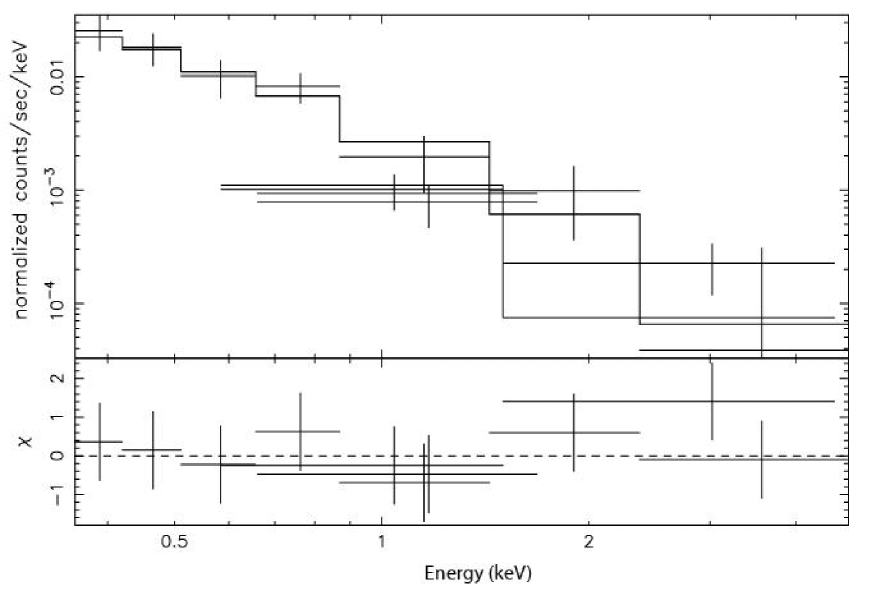
Among the various spectral models which were tested, we found that a single blackbody model provided the worst description of the data ( for 19 dof). Including a second blackbody did not provide a significant improvement ( for 17 dof). A single power law with photon-index was found to give the best description ( for 19 dof). The power law model yields a column absorption of and a normalization of photons cm-2 s-1 keV-1 at keV. The errors are the confidence range computed for two parameters of interest. The best-fit power law spectrum and residuals are shown in Figure 8.
In the keV band, the power law model yields an unabsorbed energy flux of . For a pulsar distance of 340 pc, this corresponds to an X-ray luminosity of . For the ROSAT energy band we measured the flux to be , yielding an X-ray luminosity of . These luminosities imply a rotational energy to X-ray energy conversion factor of and if transformed to the keV ROSAT band.
To test the possibility of some thermal contribution from the whole neutron star surface, or part of it, we again fitted the data with a composite model consisting of a thermal blackbody and a power law. As for PSR B0950+08, leaving free all fit parameters resulted in a good fitting spectral model ( for 17 dof) in which the photon-index and power law normalization were found to be similar to the values obtained in the single component fit but with a blackbody emitting area of about one centimeter radius. For comparison, using the same formula as given in §3.1 the polar cap size of PSR B0823+26 is computed to be m. The small blackbody normalization obtained from the fits is a direct consequence of the fact that the power law model already provides an acceptable description of the observed energy spectrum.
We therefore computed upper limits for the polar cap and surface temperature using the same approach as for PSR B0950+08. For a polar cap of radius m we find a temperature upper limit of K. If we allow the thermal emission to come from two polar caps of this size we compute K for each of them. Assuming a thermal contribution, not from a heated polar cap, but from the entire neutron star surface of 10 km radius yields K.
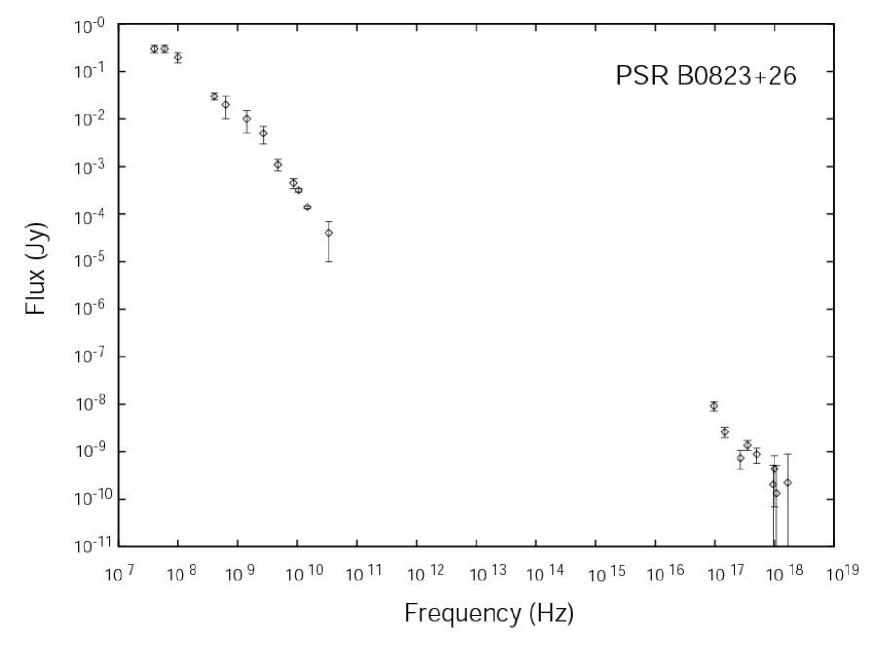
PSR B0823+26 belongs to the small minority of known pulsars that are visible at high radio frequencies (). A radio spectrum was measured by Malofeev et al. (1994). In order to construct a wideband spectrum using all spectral information available from PSR B0823+26 we converted the X-ray photon counts to flux units and combined them in Figure 9 with the radio fluxes. The radio spectrum has a spectral index of up to the break frequency of 4 GHz where the spectrum steepens slightly to . The origin of this high frequency emission is still unknown, but seems to be more closely linked to the driving process of radio emission as all high frequency emitters show an abnormally strong, most likely intrinsic, intensity modulation at high frequencies. In the case of PSR B0823+26 the slopes of radio and X-ray spectra are similar, but the flux in the X-ray part amounts more than times of the extrapolated radio spectrum.
4.2 Timing Analysis
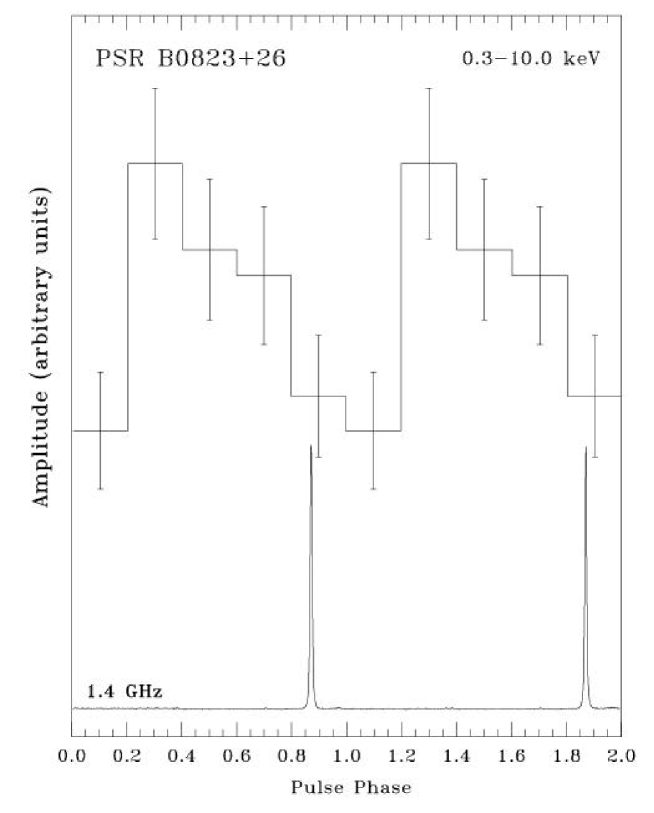
For the timing analysis we selected all events detected in the EPIC-PN within a circle of 25 arcsec centered on the pulsar. This yielded 304 events of which are background. PSR B0823+26 is not observed to show timing irregularities (glitches) and this allows us to simply epoch-fold the photon arrival times using pulsar ephemeris from the Princeton Pulsar Catalog as well as from Effelsberg radio data of PSR B0950+08 which we extrapolated to the mean epoch MJD=52391.0168077238 (TDB@SSB) of the XMM-Newton observation. The H-test indicated the highest probability for harmonic. The test statistic is distributed, in the absence of a signal, as with degrees of freedom. Thus the test statistic implies a probability of chance occurrence of , i.e. evidence that the observed signal is real, and not simply due to statistical fluctuations. The corresponding pulse profile is shown in Figure 10. The pulsed fraction is with the large error reflecting the low significance of the observed modulation.
To compute the absolute phase of the main radio pulse at the epoch of the XMM observation we used data taken with Effelsberg between . From this data we found the phase of the radio peak at (see Figure 10).
5 PSR J2043+2740
The 96 ms pulsar PSR J2043+2740 was detected in the keV energy band at a level of statistical significance, establishing it as X-ray bright and making it one of the rare old, but non-recycled, rotation-powered pulsars detected in X-rays. An image is given in Figure 1. The source extent of arcsec (HEW) is consistent with that expected for an on-axis point source. The EPIC-PN source count rate is counts/s in the keV band. The MOS1/2 count rate is counts/s.
5.1 Spectral Analysis
For PSR J2043+2740 we applied the same approach as described for PSR B0950+08 and PSR B0823+26 in sections 3 and 4. From the MOS1/2 data the background spectrum was selected from an annulus of 34 and 70 arcsec inner and outer radius, respectively, centered on the pulsar position. In the EPIC-PN we extracted the background spectrum from a source free region of 33 arcsec radius, centered at RA(2000) , DEC . The extracted spectra include 92 source counts from the EPIC-PN and 40 source counts from the EPIC-MOS1/2. The data were binned so that there were at least 20 counts per bin. Amongst the tested models, a power law with photon-index yields a better description of the observed energy spectrum than a single blackbody model does, albeit the errors of the fitted parameters are large in both cases as shown in Table 3. The observed energy spectrum fitted with an absorbed power law model is shown in Figure 11.
The quality of the power law model is sufficient to describe the observed energy spectrum. To deduce upper limits for a thermal contribution we again fit a composite model consisting of a power law and blackbody. The polar cap size inferred for a 96ms pulsar is m. Using the same fitting techniques as for the other two pulsars we computed a upper limit for the polar cap temperature of K, and of K if the thermal emission is coming from two polar caps of the same size which are contributing at the same time. If the thermal contribution is coming from the whole neutron star surface of 10 km radius we found a surface temperature upper limit of K. A summary of the spectral fitting is given in Table 3.
As with PSR B0950+08 and PSR B0823+26 we estimate the unabsorbed energy flux for the pure non-thermal model. In the keV band this yields and for the ROSAT band we compute . Assuming a distance of 1.8 kpc, the corresponding luminosities are and , respectively. These luminosities imply a rotational to X-ray energy conversion factor of for the keV energy range, or if converted to the ROSAT band.
5.2 Timing Analysis
196 events from the EPIC-PN, of which we estimate are from the background, were used for timing analysis. We folded the barycenter-corrected photon arrival times to the pulsar ephemeris which we extrapolated from the ephemeris listed in the ATNF Pulsar Catalogue (Hobbs et al. 2003) to the mean epoch of the XMM-Newton observation: MJD=52600.0643265238 (TDB@SSB). The H-test indicated the highest probability for 1 harmonic. The test statistic thus yields a probability of chance occurrence of . The observed modulation is therefore not considered as evidence for pulsations. We computed a pulsed fraction upper limit of assuming a sinusoidal pulse profile.
6 DISCUSSION & SUMMARY
We have investigated the X-ray emission properties of three old, but non-recycled, rotation-powered pulsars in order to probe and identify the origin of their X-radiation. These pulsars, being intermediate in age between the young cooling neutron stars and the old recycled millisecond pulsars, are of special interest as they provide important information for understanding the X-ray emission properties of rotation-powered pulsars as a class. The selected targets provide a valuable snapshot at ages years (PSR J2043+2740), yrs (PSR B0823+26) and yrs (PSR B0950+08) and allows one to add to the current picture of pulsar X-ray emission properties beyond the younger (spin-down ages between years) class of cooling neutron stars.
For PSR B0950+08, which is the oldest among the three pulsars investigated, any hint of emission from the cooling stellar surface has faded to below what might be detected in the XMM-Newton observation. The surface temperature upper limit of K is well above temperatures predicted by current models of neutron star thermal evolution even if strong frictional heating of superfluid -neutrons in the outer neutron star crust is considered (Umeda et al. 1993; Yakovlev et al. 2002). The same is true for PSR B0823+26 where K and for PSR J2043+2740 for which K. However, standard neutron star cooling models neglect the influence of a strong magnetic field on the neutron star’s thermal evolution. As the heat transport in neutron stars is mainly due to electrons the presence of a magnetic field is supposed to reduce the thermal conductivity perpendicular to the magnetic field direction. The consequences are an anisotropic temperature distribution on the neutron star surface (Geppert, Küker & Page 2004) and a reduced cooling rate so that magnetic cooling curves may deviate significantly from the zero-field case after years (Tsuruta 1998). The surface temperature upper limits of the old, non-recycled, pulsars, even if they are above what standard cooling models predict, may still provide interesting constraints for those thermal evolution models which take the neutron star’s magnetic field into account.
As far as emission from a thermal polar cap is concerned, it is very interesting that there is no clear evidence for the presence of this component in any of the energy spectra. Yet, emission from a heated polar cap is present in the spectra from both the younger cooling neutron stars and the older, recycled, millisecond pulsars (cf. Becker & Pavlov 2001) as long as the neutron star is active as a pulsar. Harding & Muslimov (2001; 2002) predicted in the framework of their revised space-charge-limited flow model that polar cap heating, as a fraction of the spin-down luminosity, increases with pulsar age and should be most efficient for pulsars of spin-down age yrs, if they are in fact producing pairs from curvature radiation photons. According to these models, however, B0950+08 and B0823+26 cannot produce pairs from curvature radiation (CR) of primary electrons since they both lie below the CR pair death line in the - diagram of radio pulsars (i.e. the primary electrons cannot accelerate to the energies required to produce CR pairs). Both of these pulsars can however produce pairs from inverse Compton scattered (ICS) photons, which provide much lower PC heating than do CR-produced positrons resulting in predicted luminosities of for B0950+08 and for B0823+26. Both of these values are well below the luminosities that we have observed for these sources, and also below the upper limits for emission from a heated polar cap which are for B0950+08 and for B0823+26. The results are thus consistent with a non-thermal, not a polar cap heating, origin for the emission from these two pulsars. J0243+2740 lies well above the CR pair death line of Harding & Muslimov (2002), and thus is expected to have a much higher level of polar cap heating from CR produced positrons with a luminosity predicted to be . This value is near but below our observed luminosity of , implying that a significant part of the observed luminosity could come from polar cap heating, depending on how directly we are viewing the polar cap. Thus the luminosities detected from all three pulsars are consistent with the predicted level of polar cap heating.
The geometry of PSR B0950+08 and PSR B0823+26 has been investigated recently by fitting the classical rotating vector model to high-quality polarization data taken with Arecibo Observatory at 1.4 GHz (Everett & Weissberg 2001). These authors favor the interpretation that both pulsars are almost orthogonal rotators, but Narayan & Vivekanand (1982), Lyne & Manchester (1988), Blaskiewicz, Cordes & Wassermann (1991), Rankin (1993a; 1993b) and von Hoensbroech & Xilouris (1997) in previous observations came to the conclusion that the emission geometry of PSR B0950+08 is that of an almost aligned rotator. Figure 12 shows the geometry of the two scenarios for PSR B0950+08 with inclination and impact angles taken from Everett & Weissberg (2001) and references therein.
Although rotating vector model fits are easily perturbed by systematic effects in polarized position angles and reported uncertainties often underestimated the actual errors, we find that the double peaked X-ray pulse profile of PSR B0950+08 with the peak separation strongly supports the nearly orthogonal rotator. In the aligned rotator geometry, with an inclination angle of and impact angle of (see Figure 12a), the polar cap model (Ruderman & Sutherland 1975; Daugherty & Harding 1982) predicts a single-peaked profile. Double peaked profiles (as those in Daugherty & Harding 1996, and Dyks & Rudak 2002) can be observed only when our line of sight crosses the polar gap. This would require the gap to be located at least 15 stellar radii above the surface, or the surface conal beam would have to be 4 times wider than the polar cap beam. Moreover, an improbably fine tuning of model parameters would be required to reproduce the large peak separation.
In the outer magnetosphere scenarios such as the outer gap model (Cheng, Ho & Ruderman 1986; Romani & Yadigaroglu 1995; Cheng, Ruderman & Zhang 2000) or the two-pole caustic model (Dyks & Rudak 2003), the non-thermal X-rays are emitted in a fan beam. For the nearly aligned geometry, however, the outer gap model predicts no high-energy radiation (see top panel in Figure 6 in Cheng, Ruderman & Zhang 2000) whereas the two-pole caustic model predicts single-peaked lightcurves (see Figure 2b in Dyks & Rudak (2003).
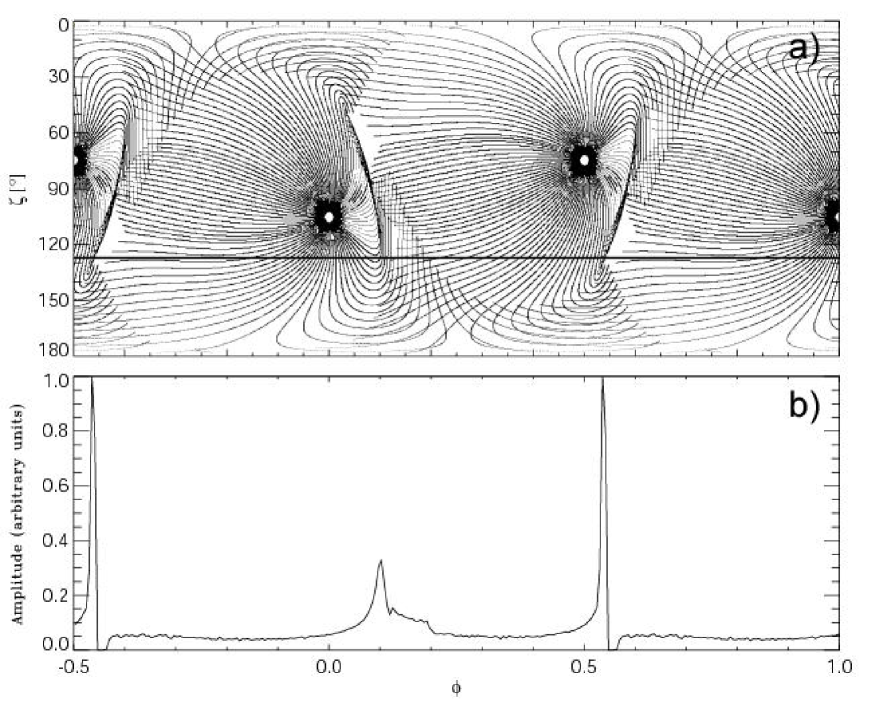
Both the outer gap and two-pole caustic models can reproduce the observed profile in the nearly orthogonal scenario. Figure 13 presents the radiation pattern (top) and the pulse profile (bottom) calculated for the two-pole caustic model with the dipole inclination and and the viewing angle , as derived by Everett & Weisberg (2000). Each peak arises due to the caustic effects on the trailing side of the open field line region associated with each magnetic pole (see Figure 13a). The modeled peak separation () is in good agreement with the observed one (). The relative widths and heights of these two peaks also resemble the observed ones, however, they are more model-dependent than .
Our three-dimensional simulations show that for the parameters given above, the outer gap model also predicts a double-peaked profile, with which is marginally consistent with the data. The outer gap model can more closely reproduce the large peak separation for viewing angles closer to the rotational equator (). However, according to outer gap models, only younger pulsars can sustain a gap in their magnetospheres and produce non-thermal high-energy emission. B0950+08, B0823+26 and J0243+2740 all lie below the original outer gap death lines for production of high-energy emission (Chen & Ruderman 1993), indicating that they do not produce high-energy emission from outer gaps. More recently, the outer gap death lines have been revised to include pulsar inclination and thermal emission from cooling and heated polar caps (Zhang et al. 2004). All three pulsars lie above at least one of the revised outer gap death lines computed by Zhang et al. (2004), so that outer gap emission may not be ruled out.
Neither the two-pole caustic nor the outer gap model can explain the relative locations of the X-ray and radio peaks. Both models predict that the main (i.e., the strongest) radio peak should precede the leading X-ray peak in phase roughly by . This is the phase at which our line of sight approaches most closely one of the magnetic poles (Figure 13a). The standard polar cap model in the nearly orthogonal geometry cannot explain the X-ray lightcurve. Because the closest approach to a magnetic pole occurs near the leading peak, the model predicts that this peak should be stronger and more spiky than the trailing peak.
In the case of PSR B0823+26 multiple emission components are seen in the radio pulse profile while the statistics of the available XMM-Newton data is not sufficient to better resolve the X-ray pulse profile than to a single broad peak.
Non-thermal X-radiation processes implied by the outer magnetosphere interpretation are in agreement with the non-thermal spectra which dominate the emission from all three pulsars. This is most evident in the energy spectrum of PSR B0950+08 but appears to be the case for both PSR B0823+26 and PSR J2043+2740 as well. However, the predicted level of polar cap heating for PSR J2043+2740 implies that a significant part of its emission may be thermal.
The optical emission from PSR B0950+08 has been recently observed with the VLT FORS1 (Zharikov et al. 2003). Fitting the optical data simultaneously with the X-ray spectrum suggests a broadband spectrum which can be described by a broken power law, strongly suggesting that the radiation from PSR B0950+08 is dominated by non-thermal emission from the optical to the X-ray band. Even more, taking PSR B0950+08, PSR B0823+26 and PSR J2043+2740 as representative would imply that the X-ray emission from old, non-recycled, rotation-driven pulsars is dominated by non-thermal radiation as has been concluded by Becker & Trümper (1997) based on their tight soft-X-ray luminosity vs. spin-down energy conversion fits of ROSAT detected rotation-powered pulsars. The emission properties observed from PSR B1929+10 (cf. §1) are not in disagreement with this conclusion. XMM-Newton observations of this pulsar, which have taken place in November 2003 and April 2004, are expected to further constrain this conclusion.
References
- (1) Alpar M.A., et al., 1984, ApJ 278, 791
- (2) Alpar M.A., 1998, AdSpR 21, 159
- (3) Arons, J., Scharlemann, E.T., 1979, ApJ, 231, 854
- (4) Becker, W., Swartz, D.A., Pavlov, G.G., Elsner, R.F., Grindlay, J., Mignani, R., Tenant, A.F., Backer, D., Pulone, L., Testa, V., Weisskopf, M.C., 2003, ApJ, 594, 798
- (5) Becker, W., Aschenbach, B., 2002, in Proceedings of the WE-Heraeus Seminar on Neutron Stars, Pulsars and Supernova remnants, Eds. W.Becker, H.Lesch & J.Trümper, MPE-Report 278, 64, (available from astro-ph/0208466)
- (6) Becker, W., Pavlov, G.G., 2001, in The Century of Space Science, Eds. J.Bleeker, J.Geiss & M.Huber, Kluwer Academic Publishers, p721 (available from astro-ph/0208356).
- (7) Becker, W. & Trümper, J. 1999, A&A, 341, 803
- (8) Becker, W., Trümper, J., 1997, A&A, 326, 682
- (9) Becker, W., 1994, PhD Thesis, Ludwig-Maximilians-University of Munich,
- (10) Blaskiewicz, M., Cordes, J.M., Wasserman, I., 1991, ApJ, 370, 643
- (11) Brisken, W.F., Benson, J.M., Goss,W.M., Thorsett, S.E., 2002, ApJ, 571, 906
- (12) Buccheri R., De Jager O.C., in Timing Neutron Stars, Eds. H.Ögelman, E.P.J. van den Heuvel, p95, Kluwer Academic Publishers, 1989
- (13) Caraveo, P., de Luca, A., et al., 2004, submitted to Science
- (14) Camilo, F., Nice, D.J., 1995, ApJ, 445, 756.
- (15) Chen, K. & Ruderman, M. A., 1993, ApJ, 402, 264.
- (16) Cheng, K. S., Ho, C., & Ruderman, M. 1986, ApJ, 300, 500
- (17) Cheng, K. S., Ruderman, M. A., & Zhang, L. 2000, ApJ, 537, 964 (CRZ2000)
- (18) Cordes, J.M., Lazio, T.J.W., 2002, astro-ph/0207156
- (19) Craft, H.D., Lovelace, R.V.E., Sutton, J.M., 1968. IAU Circ. No. 2100
- (20) Daugherty, J.K., & Harding, A.K. 1982, ApJ, 252, 337
- (21) Daugherty, J.K., & Harding, A.K. 1996, ApJ, 458, 278
- (22) De Jager O.C., 1987, thesis, Potchefstromm University for Christian Higher Education, South Africa
- (23) Dyks, J., & Rudak, B. 2002, A&A, 393, 511
- (24) Dyks, J., & Rudak, B. 2003, ApJ, 598, 1201 (DR2003)
- (25) Everett, J.E., Weisberg, J.M., 2001, ApJ, 553, 341
- (26) Geppert, U., Küker, M., Page, D., 2004, submitted to A&A, astro-ph/0403441
- (27) Greiveldinger, C., Camerini, U., Fry, W., et al. 1996, ApJ, 465, L35
- (28) Harding, A.K., Muslimov, A.G., 2003, in the proceedings of Pulsars, AXPs and SGRs Observed by BeppoSAX and Other Observatories, astro-ph/0304121
- (29) Harding, A.K., Muslimov, A.G.,2001, ApJ, 556, 1001
- (30) Harding, A.K., Muslimov, A.G.,2002, ApJ, 568, 862
- (31) Helfand, D.J., 1983, in Supernova Remnants and Their X-ray Emission, Eds. J.Danziger and P.Gorenstein, Proceedings of the IAU Symposium No. 101, p471
- (32) Hirano S., Shibazaki N., 1997, ApJ 491, 286
- (33) Hobbs, G., Manchester, R., Teoh, A., Hobbs, M., 2003, To appear in Young Neutron Stars and Their Environments, (IAU Symposium 218, ASP Conference Proceedings), Eds. F. Camilo and B. M. Gaensler, astro-ph/0309219
- (34) Kanbach, G., 2001, in The Universe in Gamma Rays, Eds. Volker Schönfelder, Springer Verlag (Astronomy and Astrophysics Library), p127-158
- (35) Kennea, J.A., Becker, W., Cordova, F.A., 2004, submitted to ApJ
- (36) Kirsch, M., Becker, W., Benlloch-Garcia, S., Jansen, F.A., Kendziorra, E., Kuster, M., Lammers, U., Pollock, A.M.T., Possanzini, F., Serperll, E., Talavera, A., 2003, Proceedings of the 48th Annual SPIE Meeting, 3-8 August 2003 in San Diego, CA USA, in press
- (37) Lyne, A.G., Manchester, R.N., 1988, MNRAS, 234, 477
- (38) Malofeev, V.M., Gil, J.A., Jessner, A., Malov, I.F., Seiradakis, J.H., Sieber, W., Wielebinski, R., 1994, Astron. Astrophys., 285, 201
- (39) Manning, R., Willmore, P., 1994, MNRAS, 266, 635
- (40) Michel, F.C., 1991, Theory of Neutron Star Magnetospheres, University of Chicago Press, Chicago, IL
- (41) Mignani, R.P., De Luca, A., Caraveo, P.A., Becker, W., 2003, ApJ, 580, L147
- (42) Narayan, R., Vivekanand, M., 1982, a&A, 113, L3
- (43) Pavlov, G.G., Stringfield, G.S., Cordova, F.A., 1996, ApJ, 467, 370
- (44) Rankin, J.M., 1993a, ApJ, 405, 285
- (45) Rankin, J.M., 1993b, ApJS, 85, 145
- (46) Ray, P.S., Thorsett, S.E., Jenet, F.A., van Kerkwijk, M.H., Kulkarni, S.R., Prince, T.A., Sandhu, J.S., Nice, D.J., 1996. ApJ, 470, 1103
- (47) Romani, R. W. & Yadigaroglu, I.-A., 1995, ApJ, 438, 314
- (48) Ruderman R., 1998, in The many faces of neutron stars, Ed. by R. Buccheri, J. van Paradijs, and M. A. Alpar. Dordrecht, Boston. Kluwer Academic Publishers, p.77
- (49) Ruderman, M. A., & Sutherland, P. G. 1975, ApJ, 196, 51
- (50) Seward, F.D., Wang, Z.R., 1988, ApJ, 332, 199
- (51) Saito, Y., 1998, PhD Thesis, ISAS Research Note 643
- (52) Shibazaki, N., Lamb, F.K., 1989, ApJ, 346, 808
- (53) Sturner, S.J., Dermer, C.D., 1995, in Advances in Space Research, (ISSN 0273-1177), Vol.15, No.5, p.577
- (54) Sun, X., Trümper, J., Dennerl, K., Becker, W., 1993, IAU circ. 5895
- (55) Swanepoel J.W.H., de Beer C.F., Loots H., 1996, ApJ, 467, 261
- (56) Tennant, A.F., Becker, W., Juda, M., Elsner, R.F., Kolodziejczak, J.J., Murray, S.S., O’Dell, S.L., Paerels, F., Swartz, D.A., Shibazaki, N., Weisskopf, M.C., 2001, ApJ, 554L, 173
- (57) Thorsett, S.E., Ray, P.S., Kulkarni, S.R., Prince, T.A., 1994, IAU Circ. 6012
- (58) Tsuruta S., 1998, Physics Reports, 292, 1
- (59) Umeda, H., Shibazaki, N., Nomoto, K., Tsuruta, S., 1993, ApJ, 408, 186
- (60) von Hoensbroech, A., Xilouris, K.M., 1997, A&A, 324, 981
- (61) Webb, N.A., Olive, J.-F., Barret, D., Kramer, M., Cognard, I., Loehmer,O., 2004, accepted for publication in A&A, as tro-ph/0402102
- (62) Weisskopf, M.C., O’Dell, S.L., Paerels, F., Elsner, R.F., Becker, W., Tennant, A.F., Swartz, D.A., 2004, ApJ, 601, 1050
- (63) Wozna, A., Kuiper, L., Hermsen, W., 2003, in Pulsars, AXPs and SGRs observed with BeppoSAX and Other Observatories, Eds. G.Cusumano, E.Massaro and T.Mineo, p.37
- (64) Yakovlev, D.G., Gnedin, O.Y., Kaminker , A.D., Potekhin, A.Y., 2002, in Proceedings of the WE-Heraeus Seminar on Neutron Stars, Pulsars and Supernova remnants, Eds. W.Becker, H.Lesch & J/Trümper, MPE-Report 278, 287
- (65) Yancopoulos, S., Hamilton, T.T., Helfand, D.J., 1994, ApJ, 429, 832
- (66) Zhang, B., Harding, A.K., 2000, ApJ, 532, 1150
- (67) Zhang, L., Chang, K. S., Z. J. Jiang & Leung, P. 2004, ApJ, 604, 317.
- (68) Zharikov, S., Mennickent, R., Shibanov, Yu., Koptsevich, A., Tovmassian, G., Komarova, V., 2003, in Pulsars, AXPs and SGRs observed with BeppoSAX and Other Observatories, Eds. G.Cusumano, E.Massaro and T.Mineo, p71
- (69) Zharikov, S.V., Shibanov, Yu.A., Koptsevich, A.B., Kawai, N., Urata, Y., Komarova, V.N., Sokolov, V.V., Shibata, S., Shibazaki, N., 2002, A&A, 394, 633
| PSR B0950+08 | PSR B0823+26 | PSR J2043+2740 | |
|---|---|---|---|
| Period (ms) | 253 | 530 | 96 |
| Spin-down age (yr/) | 17.37 | 4.89 | 1.2 |
| Spin-down energy () | 5.62 | 4.57 | 562 |
| Inferred Magnetic Field () | 2.45 | 9.77 | 3.54 |
| Dispersion Measure () | 2.97 | 19.47 | 21 |
| Distancea (pc) | 255 | 340 | 1130 |
| ( | c | c | |
| () | 9.6 | 60 | 65 |
Note. —
a Dispersion-measure inferred distance (Cordes and Lazio 2002).
b Brisken et al. (2002).
c Computed using and the electron density model NE2001 of Cordes & Lazio (2002).
| Detector | Mode | Filter | Start time | Duration | eff. Exp. |
|---|---|---|---|---|---|
| (UTC) | ksec | ksec | |||
| PSR B0950+08 | |||||
| EMOS1 | PrimeFullWindow | Medium | 2002-05-08T18:13:31 | 13.9 | 8.8 |
| EMOS1 | FastUncompressed | Medium | 2002-05-08T22:14:31 | 27.5 | |
| EMOS1 | PrimeFullWindow | Medium | 2002-05-09T06:06:25 | 13.9 | 11.0 |
| EMOS1 | FastUncompressed | Medium | 2002-05-09T10:07:26 | 25.7 | |
| EMOS2 | PrimeFullWindow | Medium | 2002-05-08T18:13:32 | 83.7 | 65.7 |
| EPN | PrimeSmallWindow | Medium | 2002-05-08T18:29:20 | 82.9 | 48.9 |
| PSR B0823+26 | |||||
| EMOS1 | PrimeFullWindow | Medium | 2002-04-26T17:43:18 | 18.5 | 17.9 |
| EMOS1 | FastUncompressed | Medium | 2002-04-26T23:00:11 | 31.3 | |
| EMOS2 | PrimeFullWindow | Medium | 2002-04-26T17:43:16 | 50.7 | 47.7 |
| EPN | PrimeSmallWindow | Medium | 2002-04-26T17:59:03 | 49.9 | 33.9 |
| PSR J2043+27 | |||||
| EMOS1 | PrimeFullWindow | Medium | 2002-11-21T23:21:42 | 16.7 | 16.5 |
| EMOS2 | PrimeFullWindow | Medium | 2002-11-21T23:21:48 | 16.7 | 16.5 |
| EPN | PrimeSmallWindow | Thin | 2002-11-21T23:26:20 | 16.5 | 10.8 |
| modela | / b | Radiusc | |||
|---|---|---|---|---|---|
| km | |||||
| bb | 1.12 | 7 | |||
| bb | 1.37 | 8 | 10 | ||
| pl | 0.53 | 7 | |||
| pl+bb | 0.67 | 7 | 0.065 | 0.467 | |
| pl+bb | 0.49 | 7 | 0.065 | 10 |
Note. — a bb = blackbody; pl = power law;
b The entry in this column depends on the spectral model — it is the power law photon index or the temperature in keV
c For models for which we fixed the radius of the emitting area we assumed a pulsar distance of 1.8 kpc.