Submillimetre observations of quasars
Abstract
We report on submillimetre (submm) observations of three high redshift quasars (6) made using the SCUBA camera on the James Clerk Maxwell Telescope (JCMT). Only one of the sample was detected ( significance) at 850 – SDSS J11485251 (). It was also detected at 450 ( significance), one of the few quasars at for which this has been the case. In combination with existing millimetric data, the 850m and 450m detections allow us to place limits on the temperature of the submm-emitting dust. The dust temperature is of no trivial importance given the high redshift of the source, since a cold temperature would signify a large mass of dust to be synthesized in the little time available (as an extreme upper limit in only 0.9Gyr since ). We find, however, that the combined millimetre and submm data for the source cannot simply be characterised using the single-temperature greybody fit that has been used at lower redshifts. We discuss the results of the observing and modelling, and speculate as to the origin of the deviations.
keywords:
quasars:general-galaxies:high-redshift-submillimetre-dust1 Introduction
A number of independent lines of investigation over the last 10 years have placed submillimetre (submm) observations of high-redshift quasars into the spotlight. Observations have unveiled a population of extremely luminous submm sources lying at high redshift, believed to be the dust-obscured, star-forming ancestors of massive elliptical galaxies. Contemporaneously, it was realised that a tight correlation exists between the stellar velocity dispersion of galactic spheroids, and the mass of their central, supermassive black hole (Gebhardt et al. 2000). Taken together, these indicate that luminous active galactic nuclei (AGN) at high redshift— the build-up phase of a supermassive black hole — are prime sites at which to search for the dust-enshrouded star-burst phase through which, according to the new galaxy-formation paradigm, their massive spheroids necessarily must pass.
The high, sustained luminosity of quasars across the electro-magnetic spectrum, allows them to be studied over a wide range of both redshift and observing wavelength. Early observations of z4.5 quasars by McMahon et al. (1994), and Isaak et al. (1994) established that some high redshift quasars were prodigious far infrared emitters with and estimated masses of cool dust of .
The discovery of quasars at (Fan et al. 2003) now makes it possible to compile homogeneous, well-defined samples over a significant span of the lifetime of the cosmos, from recent times to the threshold of reionization. Follow-up is simplified by the accurately-known optical positions and the spectroscopic redshifts of the host galaxies, which can readily be determined to the precision required to pinpoint emission lines from molecular gas— a key indicator of the conditions required for star formation.
Recent SCUBA studies of the submm emission from high redshift (), radio-quiet quasars have been reported by McMahon et al. (1999), Isaak et al. (2002) and Priddey et al. (2003b), along with a sample at lower redshift (z2) by Priddey et al. (2003a). A considerable fraction of the targets have been shown to be luminous submm sources. Interestingly, this fraction appears to have no significant dependence upon redshift. Similar conclusions have been drawn from observations at millimetre (mm) wavelengths (eg. Omont et al. (2001), Carilli et al. (2001)).
2 Observations
2.1 The Sample
Our source-list comprised three of the quasars identified by the Sloan Digital Sky Survey team, and reported in Fan et al. (2003). Source parameters are given in Table 1. Observations of the other two quasars known (as of January, 2003) to be at , SDSS J10300534 () and SDSS J1306+0356 (), have been reported in Priddey et al. (2003b).
2.2 Observations and Data Analysis
Sources were observed using SCUBA (Holland et al. 1999) on the JCMT 111The James Clerk Maxwell Telescope is operated by the Joint Astronomy Centre in Hilo, on behalf of the parent organisations of the Particle Physics and Astronomy Research Council in the UK, the National Research Council of Canada and the Netherlands Organisation for Scientific Research on the nights of 2003 January 31 and February 01 (UT). Simultaneous observations were made at 850 and 450m using photometry mode (placing the source on the central bolometers H7, C14 of the two arrays respectively) with a 60 arcsec azimuth chop at 7.8Hz. Data were taken in groups of 40 samples, with observations repeated until mJy was achieved. Telescope pointing was checked hourly, and found to be better than 3 arcsec. Mars and Uranus, along with IRC10216, were used as primary and secondary calibrators respectively. The derived, mean, flux conversion factors were 213Jy/V (850) and Jy/V (450), with a variation of seen over the course of the observing period. The sky opacity was measured using sky-dips and the recently commissioned water vapour radiometer that measures the direct line-of-sight atmospheric extinction.
Observing conditions on both nights were moderately good, with and (zenith atmospheric transmission at between 79 – 90% and 72 – 76% ) respectively. Data were reduced using both the semi-automated ORAC-DR pipeline data reduction package (Jenness & Economou 1999) and a custom reduction procedure based on a series of routines taken from the SURF reduction package (Jenness & Lightfoot 1998a,b). In each case, the final flux represents the weighted (by the individual rms) average taken of all data for a particular source/filter combination.
The initial analysis of the SDSS J11485251 dataset revealed considerable variation between both the flux and rms of the individual 40-sample data groups. One explanation of this discrepancy was revealed upon the subsequent publication of a MAMBO-2 image of SDSS J11485251 by Bertoldi et al. (2003). It seemed feasible that our fixed, azimuth chop had placed the off-source position over a second, millimetre-bright source in the quasar field during the latter stages of our observation. In order to eliminate this possibility, we therefore obtained subsequent SCUBA photometry on SDSS J11485251, in UK service time during the nights of 2003 July 9th, 10th and 12th. This time, a specified chop throw, and position angle fixed relative to RA–Dec, were chosen to avoid the potential contaminant sources. The atmospheric extinction during the observing period was low (with ) and the sky stable. Guided by these new, more reliable and consistent observations, we reanalysed the initial datasets, testing alternative explanations for their disagreement.
3 Results and Discussion
The measured flux densities of the three sources are tabulated in Table 1, along with the observational parameters of the three sources. For comparison, the mm fluxes, taken from Bertoldi et al. (2003), have also been included. In all cases the numbers in brackets are the rms values.


Bottom panel: A plot of the Priddey & McMahon (2001) SED superposed onto the observed mm and submm data fluxes for SDSS J11485251 (filled squares) and BR B12020725 (open circles), redshifted to the quasar rest frame. The observed fluxes have been normalised to the 850 values appropriate to the individual sources.
| Source | Redshift | RA | Dec | Number of | |||||
|---|---|---|---|---|---|---|---|---|---|
| (J2000) | (J2000) | (mJy) | integrations | (mJy) | (mJy) | ||||
| (1) | (2) | (3) | (4) | (5) | (6) | (7) | (8) | (9) | |
| SDSS J10484637 | 6.23 | 28.15 | 10 48 45.05 | 46 37 18.3 | 3.0(0.4) | 120 | 2.3(2.2) | 7.6(11.7) | |
| SDSS J11485251 | 6.43 | 28.42 | 11 48 16.64 | 52 51 50.3 | 5.0(0.6) | 600 | 7.8(0.7) | 24.7(7.4) | |
| SDSS J16304012 | 6.05 | 26.71 | 16 03 33.90 | 40 12 09.6 | 280 | 2.7(1.9) | 15.4(9.6) |
Positions and optical magnitudes have been taken from Fan et al. (2003);
1.2mm MAMBO-2 data have been taken from Bertoldi et al. (2003)
| Source | / | / | ||||||||
|---|---|---|---|---|---|---|---|---|---|---|
| (Gyr) | (M⊙) | (M⊙/yr) | (1013L⊙) | (M⊙) | (M⊙/yr) | |||||
| (1) | (2) | (3) | (4) | (5) | (6) | (7) | (8) | (9) | (10) | (11) |
| SDSS J10484637 | 6.23 | 28.15 | 0.94 | 6.0 | 130 | |||||
| SDSS J11485251 | 6.43 | 28.42 | 0.90 | 5.3 | 60 | 1.1 | 7.7 | 170 | ||
| SDSS J16304012 | 6.05 | 26.71 | 0.97 | 1.6 | 35 | |||||
| Mean quasar | 6.24 | 27.76 | 2.13 | 1.65 | 0.94 | 4.2 | 90 |
Tabulated in Table 2 are the derived 850/1.2mm and 450/850 flux ratios for the sample where sufficient data exist. The superscripts and subscripts in columns 4 and 5 give the upper and lower values of the flux ratios. Also listed are the equivalent numbers for the fiducial single-temperature SED model of a quasar at the mean redshift of the sample, , based on a fit to a sample of quasars by Priddey & McMahon (2001).
3.1 Individual Sources
SDSS J16304012 (z=6.05) Not detected in either the
850 or 450 filters; also undetected at 1.2mm.
SDSS J10484637 (z=6.23) Detected at neither
850 nor 450. Based on the detection at 1.2mm
(Bertoldi et al. 2003), the SCUBA 850 limit is deep enough
that we should have been able to detect the source with a
significance were its emission at 1.2mm to be characteristic of a
greybody at . Our non-detection thus suggests that the dust
in this object is colder than K.
SDSS J11485251 (z=6.43) The most optically luminous of the
three sources, detected at both 850
and 450 with fluxes of mJy and mJy
respectively – one of very few quasars at where this has been achieved.
The observed fluxes are not consistent with a
Priddey & McMahon (2001) single-temperature SED as can be seen
in Figure 1. This can be seen more clearly in Figure 2 a–c, where the
850/1.2mm and 450/850 ratios have been
plotted as a function of
redshift, both for the single-temperature model (locus) and for a
selection of high-z quasars, including those observed in this sample.
The observed flux ratios are discrepant at the level,
however are well within the limits.
3.2 Observed Fluxes
The three sources observed show quite different submm properties, in spite of their similar absolute B-band () magnitudes (column [3] in Table 2), and so inferred blackhole/bulge masses (see column [10] in Table 2). This is not surprising as, to date, it has not been possible to establish a correlation between the optical luminosity of a quasar and the submm emission from its quasar host galaxy using samples of radio-quiet, optically loud quasars at and (Isaak et al. 2002; Priddey et al. 2003). What is striking, however, are the detections at both 850 and 450 of SDSS11485251.
It is not possible to fit the two fluxes reported here and the 1.2mm flux with a single-temperature SED parameterised by , and (see Figure 1: solid line). A better fit can be achieved, with a much hotter characteristic dust temperature , and (Figure 1: dotted line), or using a two-component model with a cool component characterised by and a hotter component with . However, we stress that there are insufficient data points to constrain such a two-component model. If, in the first instance, we assume that the underlying SED is indeed best characterised by a single-temperature, then there are a number of different factors that need to be explored to establish the origin of the anomalous flux ratios, which can be broadly grouped into those that result in an anomalously high millimetre flux, and those that may result in systematically low submm fluxes. However, it is clear that observations with a higher signal-to-noise are urgently needed in order to better constrain the model fitting. Furthermore, the high photometric precision of ALMA, of order a few percent, will be crucial for future analyses of this type.
3.2.1 A high 1.2mm flux:
If we assume that the observed 850 flux is correct, then there are a number of observational and physical reasons why the observed 1.2mm and 450 fluxes might deviate from values expected for a single-temperature SED model:
Relative calibration: Calibration at mm and long-submm wavelengths is relatively straightforward, particularly under periods of high and stable atmospheric transmission. A comparison of calibrators common to JCMT and IRAM by Lisenfeld and collaborators suggests that the calibrator fluxes measured at 850 and 1.2mm are consistent with thermal SED profiles. We have included calibration errors of 10 – 15% in our plotted rms estimates. Accurate calibration at 450, however, is far more difficult with small, temporal variations in atmospheric extinction, (), contributing significantly to the final, overall flux. We estimate that the combined random and systematic error in the individual flux measurements to be about 30%. We have included calibration errors in the error-bars plotted in Figure 1, calculated by taking the square root of the sum of the squares of the different error components.
Synchrotron contamination: Synchrotron emission can contribute significantly to the observed mm fluxes of radio-loud quasars, with boosting from either the synchrotron tail in the quasar itself, or from a source in its neighbourhood. VLA observations at 43GHz by Bertoldi et al. (2003) place a mJy on radio emission from the quasar at 43GHz. This strongly suggests that the 1.2mm emission is thermal rather than non-thermal given the positive spectral shape. A search of the NVSS (Condon et al. 1998) and FIRST (Becker et al. 1995) radio catalogues did not reveal any radio sources within a 30 arcsec radius of the optical position of the quasar. The FIRST survey has a 0.138mJy/beam rms at the quasar position (1.4GHz), which places a upper limit to the synchrotron contamination of the 1.2mm flux by radio sources in the quasar field of mJy, based on the worse case of a flat-spectrum radio source.
Lensing: Gravitational lensing can boost observed flux measurements considerably (eg. F102144724 (Broadhurst & Lehar 1995), APM 082795255 (Irwin et al. 1998; Ibata et al. 1999). In general, however, the magnification is achromatic. Thus, all (sub)mm fluxes would be scaled by the same factor unless the physical extent of the regions emitting at the different wavelengths were quite different – for example, if the mm flux () traced a cooler and, most importantly, highly extended region whilst the shorter wavelength emission traced much more compact emission. It is not possible to establish this, however, without the high spatial resolution achievable using mm interferometers.
Spectral line contamination: Line contamination of submm continuum fluxes observed in local galaxies is widely recognised. Observations by Zhu et al. (2003) have shown that the CO(3–2) rotational line can contribute as much as 70% to the 850 continuum flux. At the CO(3–2) () line is redshifted to 6.46mm (46.4GHz), well outside the 1.2mm and 850 filter passbands. Under good observing conditions, the 1.2mm filter has an effective pass-band of around GHz, which at includes the forbidden, rest-frame far-infrared (FIR) transition of (=157.74m). Significant flux boosting by this line is, however, unlikely: observations with ISO have shown that the line-to-FIR ratio in local starbursts and ULIRGs (Luhman et al. 1998, 2003) is a factor of ten or more lower than that seen in normal galaxies (0.1–1%: (Stacey et al. 1991)). If we assume an equivalent filter width of the MAMBO-2 camera at 1.2mm of around 80GHz, then the line peak would need to be over 500mJy to account for the excess emission at 1.2mm(1.3mJy) above that expected for a single-temperature SED fit. This would be equivalent to a line contribution to the FIR luminosity of about 1%. A search by Isaak et al. (1994) for the redshifted emission line in the optically-luminous, radio-quiet quasar BR B12020725 at placed a upper limit of x on the line contribution to the FIR luminosity (equivalent to a upper limit to the line of mJy, and to the line-to-continuum ratio of just over 1 in a line-width of ) in this, the most submm-bright of the quasars. Thus, whilst an intriguing possibility, it is unlikely that contamination by is responsible for the high 1.2mm flux.
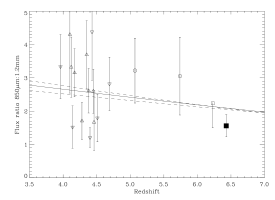
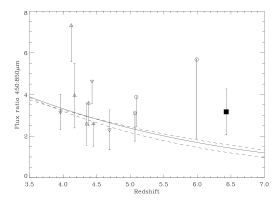
Middle panel: Ratio of as a function of redshift
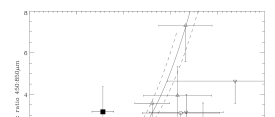
Lower panel: Ratio of vs.
In each case the solid and dashed lines represent the locus of the ratios calculated from the Priddey&McMahon SED and deviations therefrom respectively; the upright triangles represent data taken from Isaak et al., (in prep.); the inverted triangles data taken from Omont et al. (1996); McMahon et al. (1999); Omont et al. (2001); Carilli et al. (2001); Isaak et al. (2002); Bertoldi et al. (2003), the open circles data taken from Priddey et al. 2003b and the filled square the detection reported in this paper. The error bars are values. The anomalous observed fluxes can best be seen in the lower panel, where the ratio of the ratios deviates by between 1 and 3 from the single-temperature SED fit.
3.2.2 A low 850 flux:
If, in contrast, we assume that the 1.2mm flux is correct, then the
observed submm fluxes at 850 and 450 are a factor of 1.4
and 0.7 lower than one would expect from a single-temperature,
SED fit. The 850 detection flux is at
and as such is, at first glance, almost below
the single temperature fit derived from the 1.2mm flux. The
statistical significance of the difference however, ranges between
where is the flux estimated from the observed 1.2mm flux when one factors in the uncertainties in the 1.2mm flux and the error
bars in the SED fit itself. The statistical significance of the
difference between the observed and predicted 450 flux is much
less, as the detection itself is only at .
Interestingly, the discrepancy between the
observed 450 flux and that derived from the 1.2mm flux (scale
factor of 3.3 from Figures 2a–c) is smaller.
Thus, the observations of SDSS11485251 suggest that the dust emission is not well characterised by a single-temperature SED fit. One cannot, however, attach high significance to this statement because of the relatively low value of the signal-to-noise at 450 in particular. Bearing this in mind there is very tentative evidence that alludes to a change in the properties of the high-z quasar hosts with redshift. There is a considerable spread in the flux ratios and a more detailed analysis of the SEDs requires not only very high signal-to-noise data in the 450 filter, but also data taken at even shorter wavelengths that match more closely the peak and predicted turnover of the rest-frame SED. We defer a more detailed discussion of the SEDs of high-z quasars, as well as tentative trends with redshift to Isaak et al. (in prep.)
3.3 Inferred properties
SDSS11485251 is unique for two reasons: first, on account of its redshift; second, because it is detected not only at 1.2mm and 850m, but, uncommonly for a high-redshift quasar, also at 450m. The consequence of assuming a low —as suggested by the 1.2mm–850m flux ratio—is a prohibitively large dust mass. This burdens us with explaining how so much dust synthesis could have taken place without the formation redshift being unacceptably high. If, in contract, is high—as suggested by the 450–850m ratio—there is no problem accounting for the dust mass, which is small as a result. This is, however, at the cost of a large FIR luminosity. Indeed, if the dust really is this hot, then the far infrared luminosity approaches the blue luminosity of the quasar, which would suggest that reprocessed AGN emission is not the dominant mechanism heating the dust.
Notwithstanding the uncertainty in dust temperature, Table 2 lists the properties all the targets would have if they were “average” quasars, i.e. possessing the =40K and =2 fit by Priddey & McMahon (2001). The cosmological parameters =0.3, =0.7, =65km/s/Mpc are assumed. is the difference in lookback time between redshift and redshift . As in Priddey et al. (2003b) we adopt a dust opacity of =30cm2g is thus the mass of dust. (min) is the absolute minimum sustained star formation rate needed to synthesise within the available time. and are the black hole mass and accretion rate calculated from the absolute magnitude () assuming Eddington accretion (eg. Isaak et al. (2002)). We have, however, shown that observed submm emission from SDSS11485251 is not consistent with the Priddey et al. (2001) fit. In Figure 1 we have considered instead a selection of alternative SEDs: the “hot” model (=180K, =0) has (, )=(1.11014L⊙, 0.3108M⊙), whilst the two-component model illustrated has (, )=(2.91014L⊙, 3.3108M⊙). The “mean” SED, on the other hand, gives (, )=(0.11014L⊙, 5.3108M⊙).
4 Conclusions
The rest-frame FIR spectral energy distribution is key to determining the thermal origin of the observed submm emission from high-redshift quasars. The observations presented here suggest that the host galaxies of quasars out to redshifts of are actively undergoing star formation. Multi-wavelength observations spanning the mm and submm are crucial to providing constraints on the dust mass, far-infrared luminosity and inferred star formation rate, thus further exploring the role of star formation in high-redshift quasar host galaxies.
Acknowledgments
We would like to thank staff at JCMT and JAC for their support during observing, along with the referee who responded extremely promptly and with helpful suggestions.
References
- [1] Becker R.H., White R.L., Helfand D.J., 1995, ApJ, 450, 559
- [2] Bertoldi F., Carilli C.L., Cox P., Fan X., Strauss M.A., Beelen A., Omont A., Zylka R., 2003, A&A, 406, L55
- [3] Broadhurst T., Lehar J., 1995, ApJ, 450, L41
- [4] Carilli C.L. et al., 2001, ApJ, 555, 625
- [5] Condon J.J., Cotton W.D., Greisen E.W., Yin Q.F., Perley R.A., Taylor G.B., Broderick J.J., 1998, AJ, 115, 1693
- [6] Fan X. et al., 2003, AJ, 125, 1649
- [7] Gebhardt K. et al., 2000, ApJ, 539, L13
- [8] Holland W.S. et al., 1999, MNRAS, 303, 659
- [9] Ibata R.A., Lewis G.F., Irwin M.J., Lehar J., Totten E.J., 1999, AJ, 118, 1922
- [10] Irwin M.J., Ibata R.A., Lewis G.F., Totten E.J., 1998, ApJ, 505, 529
- [11] Isaak K.G., McMahon R.G., Hills R.E., Withington S., 1994, MNRAS, 269, L28
- [12] Isaak K.G., Priddey R.S., McMahon R.G., Omont A., Cox P., Peroux C., Sharp R., 2002, MNRAS, 329, 149
- [13] Jenness T., Lightfoot J., 1998a, in ASP Conf. Ser. 145: Astronomical Data Analysis Software and Systems VII
- [14] Jenness T., Lightfoot J., 1998b, in Starlink User Note 216
- [15] Jenness T., Economou F., 1999, in ASP Conf. Ser. 172: Astronomical Data Analysis Software and Systems VIII The SCUBA Data Reduction Pipeline: ORAC-DR at the JCMT
- [16] Luhman M.L., Satyapal S., Fischer J., Wolfire M.G., Cox P., Lord S.D., Smith H.A., Stacey G.J., Unger S.J., 1998, ApJ, 504, L11
- [17] Luhman M.L., Satyaoal S., Fischer J., Wolfire M.G., Strum E., Dudley C.C., Lutz D., Genzel R., 2003, ApJ, 594, 758
- [18] McMahon R.G., Omont A., Bergeron J., Kreysa E., Haslam C.G.T., 1994, MNRAS, 267, L9
- [19] McMahon R.G., Priddey R.S., Omont A., Snellen I., Withington S., 1999, MNRAS 309, L1
- [20] Omont A., McMahon R.G., Cox P., Kreysa E., Bergeron J., Pajot F., Storrie-Lombardi L.J., 1996, A&A, 315, 1
- [21] Omont A., Cox P., Bertoldi F., McMahon R.G., Carilli C., Isaak K.G., 2001, A&A, 374, 371
- [22] Priddey R.S. & McMahon R.G., 2001, MNRAS, 324, L17
- [23] Priddey R.S., Isaak K.G., McMahon R.G., Omont A., 2003a, MNRAS, 339, 1183
- [24] Priddey R.S., Isaak K.G., McMahon R.G., Robson E.I., Pearson C.P., 2003b, MNRAS, 344, L74
- [25] Stacey G.J., Geis N., Genzel R., Lugten J.B., Poglitsch A., Sternberg A., Townes C.H., 1991, ApJ, 373, 423
- [26] Zhu M., Seaquist E.R., Kuno N., 2003, ApJ, 588, 243