M. Ohno, Y. Fukazawa, and N. IyomotoHard X-Ray Emission from Mrk 1210 \Received2003/12/8\Accepted2004/03/12
and
galaxies: active — galaxies: nuclei — galaxies: Seyfert — X-rays: galaxies
Reflection Component in the Hard X-Ray Emission from the Seyfert 2 Galaxy Mrk 1210
Abstract
The Seyfert 2 galaxy Mrk 1210 was found to exhibit a flat hard X-ray component by ASCA, although ASCA could not distinguish whether it is an absorbed direct component or a reflected one. We then observed Mrk 1210 with BeppoSAX, and found that the X-ray spectral properties are quite different from those of ASCA, as have been confirmed with XMM-Newton; the flux is significantly higher than that in the ASCA observation, and a clear absorption cut-off appears below 5 keV. A bright hard X-ray emission is detected up to 100 keV. The reflection component is necessary to describe the BeppoSAX PDS spectrum, and represents the ASCA hard component very well. Therefore, the hard component in the ASCA spectrum is a reflected one, whose intensity is almost constant over 6 years. This indicates that a dramatic spectral variability is attributed to a large change of the absorption column density by a factor of , rather than the variability of the nuclear emission. The change in the absorption-column density means that the torus is not homogeneous, but has a blobby structure with a typical blob size of 0.001 pc.
1 Introduction
Seyfert galaxies are classified into type 1 and 2, according to whether they have broad emission lines in their optical/UV spectra or not. However, the detection of polarized broad lines in the optical spectra of the type-2 Seyfert galaxy ([Antonucci, Miller 1985]) demonstrated the presence of broad emission-line regions even in Seyfert 2 galaxies. These results support the “Unified model of AGN” that type 1 and type 2 Seyfert galaxies are essentially the same, and the differences can be explained by the presence or absence of optically and geometrically thick molecular torus in our line of sight.
Mrk 1210 is one of the nearby Seyfert 2 galaxies at a redshift of 0.0135, and is well-known as a strong H2O maser emitter. An X-ray study of Mrk 1210 was first performed with ASCA in 1995, and it has been found to exhibit a complex spectral feature. The spectrum consists of two components: a soft component and a flat hard component, with a neutral Fe-K line ([Awaki et al. 2000]). However, poor photon statistics and a lack of information above 10 keV prevented them from constraining the spectral shape in detail. Awaki et al (2000) suggested two possibilities for the origin of the hard component. One possibility is that the hard component is a heavily absorbed direct nuclear emission. In that case, the absorption column density and absorption-corrected X-ray luminosity are cm-2 and erg s-1, respectively. The other is that the nuclear emission is completely obscured in the ASCA band, and they detected only the scattered light, where the intrinsic X-ray luminosity is estimated to be erg s-1. Awaki et al. (2000) also claimed that the latter case is preferred, based on the correlation between FIR and X-ray for other Compton-thick Seyfert 2 galaxies.
Mrk 1210 is a valuable object for X-ray studies, since we can obtain important information of on the nuclear region, combining the X-ray data with the maser data. However, as described above, previous X-ray observations were not sufficient due to the limited energy band. In order to constrain the spectral shape unambiguously, we performed an X-ray observation with BeppoSAX by utilizing its wide energy band up to 100 keV ([Boella et al. 1997]).
By accident, XMM-Newton observed Mrk 1210 on just the same day as our BeppoSAX observation. The result has been reported by Guainazzi et al. (2002); the spectral shape is dramatically different between the ASCA and XMM-Newton observations. The flux of the hard component in the XMM-Newton observation is about 5-times as luminous as that of the ASCA, and an absorption cut-off is clearly detected around 4 keV. Following these properties, Guainazzi et al. (2002) called this object “the Phoenix galaxy”, and suggested that this nucleus made a transition from the reflection-dominated quiescence to the X-ray luminous state. Such phenomena were also reported for NGC 6300 ([Guainazzi 2002]) and NGC 2992 ([Gilli et al. 2000]). However, the alternative scenario of a large change of the absorption column density by a factor of cannot be ruled out. A variability of the absorption column density of Seyfert 2 galaxies has been reported by Risaliti, Elvis, and Nicastro. (2002), mainly for Compton-thin objects. One possible example for Compton-thick objects is M 51; the BeppoSAX detected a strongly absorbed nuclear emission above 10 keV ([Fukazawa et al. 2001]), while an unabsorbed nuclear emission was observed with Ginga ([Makishima et al. 1990]). In this case, a dramatic change in the absorption from cm-2 to cm-2 is required.
In the case of Mrk 1210, both the ASCA and XMM-Newton observations were limited to the keV band. The key spectral feature to extract possible evidence of variability of nuclear emission is a reflection component. Although the response of the reflector is smeared with a time scale of several years, any sign of very high amplitude of the nuclear variability would be seen in the reflection component. In order to investigate the possibility of an absorption change for Mrk 1210, we here reported the results of the BeppoSAX observation.
2 Observation and Data Reduction
We observed Mrk 1210 with BeppoSAX on 2001 May 5 (PI; N. Iyomoto). The exposure time is 31.6 ks for the Low-Energy Concentrator/Spectrometer (LECS, [Parmar et al. 1997]), 95 ks for the Medium Energy Concentrator/Spectormeter 2 & 3 (MECS2+3, [Boella et al. 1997]), and 41 ks for the Phoswich Detection System (PDS, [Frontera et al. 1997]). One bright point source associated with the nuclear region was detected in the LECS and MECS X-ray image. We accumulated the LECS and MECS data within 5’ radius centered on the nucleus to construct the spectra. On the other hand, we made use of the background-subtracted spectrum prepared by BeppoSAX Science Data Center (SDC) for the PDS. We applied the response file in 1998 November for the MECS and in 1999 December for the LECS, both of which are supplied by SDC. For background subtraction, we also used the standard blank sky data of 1997 May for the MECS and 1999 November for the LECS, and we integrated the background spectrum from the same region as the on-source spectrum for each detector. We rebinned the spectra to contain more than 20 counts in each bin to apply the method for a spectral fitting.
3 Results
3.1 Spectral Analysis
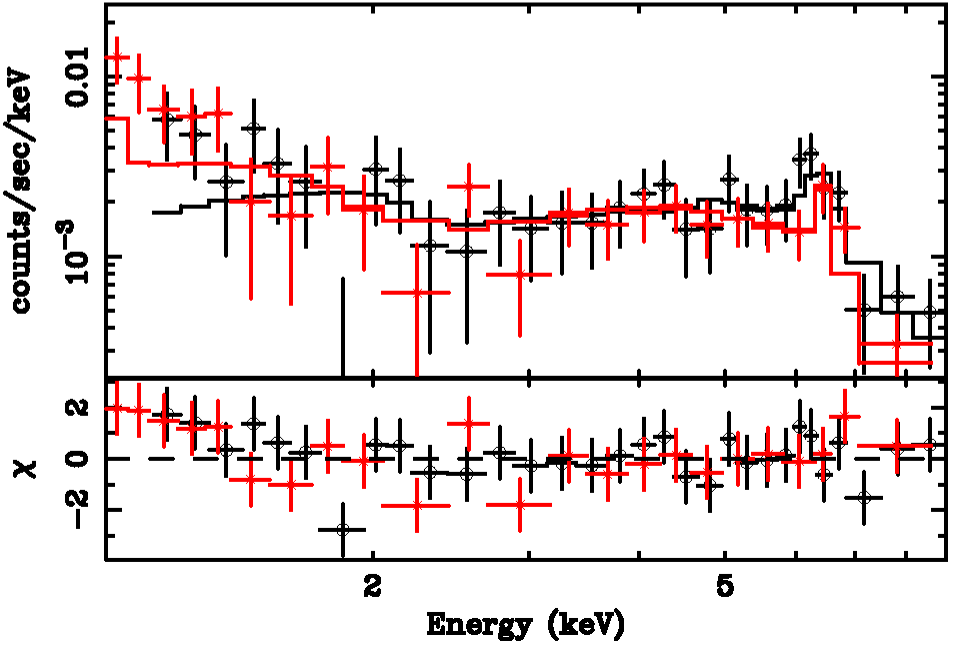
The spectra of the LECS, MECS2+3, and PDS detectors are shown in figure 1. The spectral shape is quite different from that of ASCA, and two components are clearly seen; a heavily absorbed bright continuum in the hard band and a faint soft component. Such a heavily absorbed hard component was not clearly detected with ASCA, and it is so luminous that it can be detected with the PDS up to 100 keV. We also detect a Fe-K line structure around 6.4 keV. The flux and line structures around 1 keV are in good agreement with the ASCA and XMM-Newton results.
We then performed a spectral fitting by employing an absorbed power-law model to express the heavily absorbed hard continuum. We also added another power-law component with the same photon index as mentioned above to express the soft component, following Guainazzi et al. (2002), who claimed that the soft component is a reflection by warm material, based on the center energy of the Si-K line. Since the BeppoSAX data could not resolve the Si-K line, we included only the line at 0.93 keV. The parameters of the soft component are fixed to those obtained by XMM-Newton, since the soft component is too faint to determine them. We also included a Gaussian model to represent the Fe-K line, and a Galactic absorption of cm-2 ([Dickey, Lockman 1990]). Table 1 shows the obtained best-fit parameters. The photon index of the power-law became 1.61, and the hard component suffered heavy absorption of cm-2. The Fe-K line is significant with an equivalent width of 108 eV, and energy of the Fe-K line center is consistent with that of the neutral iron in the rest frame of Mrk 1210. The PDS spectrum is well-fitted by the power-law model with the same parameters as the LECS or MECS2+3. The observed 2–10 keV X-ray flux and absorption-corrected X-ray luminosity became erg s-1 cm-2 and erg s-1, respectively. We here assumed the Hubble constant being km s-1 Mpc-1 to calculate the X-ray luminosity. The observed flux is higher by a factor than that of the ASCA data. These results are in good agreement with those of the XMM-Newton observation ([Guainazzi et al. 2002]).
Next, we tried to constrain the reflection component, which has often been detected for Seyfert 2 galaxies (e.g. [Guainazzi 2002]). In figure 1, we see some hint of a convex spectral feature around 30–50 keV in the residual. Furthermore, the photon index of 1.61 is relatively small compared with other Seyfert 2 galaxies, indicating an additional hard component. Then, we estimated a Compton reflection component by including the PEXRAV model ([Magdzarz, Zdziarski 1995]) in the XSPEC ver 11.2.0. We assumed the solar abundance for the reflector, and 30 degrees for the inclination angle. Since the high-energy cut-off cannot be constrained well, we fixed it to 10 MeV. Thus, the results are summarized in table 1. The reflection component is significantly required to explain the convex structure at around 30–50 keV, as shown in figure 1. The power-law photon index becomes 1.86, typical values of Seyfert galaxies. The equivalent width of the Fe-K line against the reflection component is eV, similar to that of the ASCA observation.
We are interested in whether the ASCA hard component is represented by only a reflection component. We compared the above best-fit model with the ASCA data, by excluding the absorbed bright power-law component. As shown in figure 2, the model is in good agreement with the ASCA data with a reduced of 52/43. Thus, the flat hard component observed with ASCA is likely to be a reflection component, indicating that the reflection flux did not vary between the ASCA and BeppoSAX observations in a time interval of 6 years. In addition, we tried to include a bright power-law component of the same normalization with BeppoSAX, but strongly absorbed with cm-2. This model also represents the ASCA spectra with the same value as before, including the strongly absorbed component, claiming that we cannot completely distinguish whether the direct nuclear emission was blocked or intrinsically very faint below 10 keV in the ASCA observation.
3.2 Timing Analysis
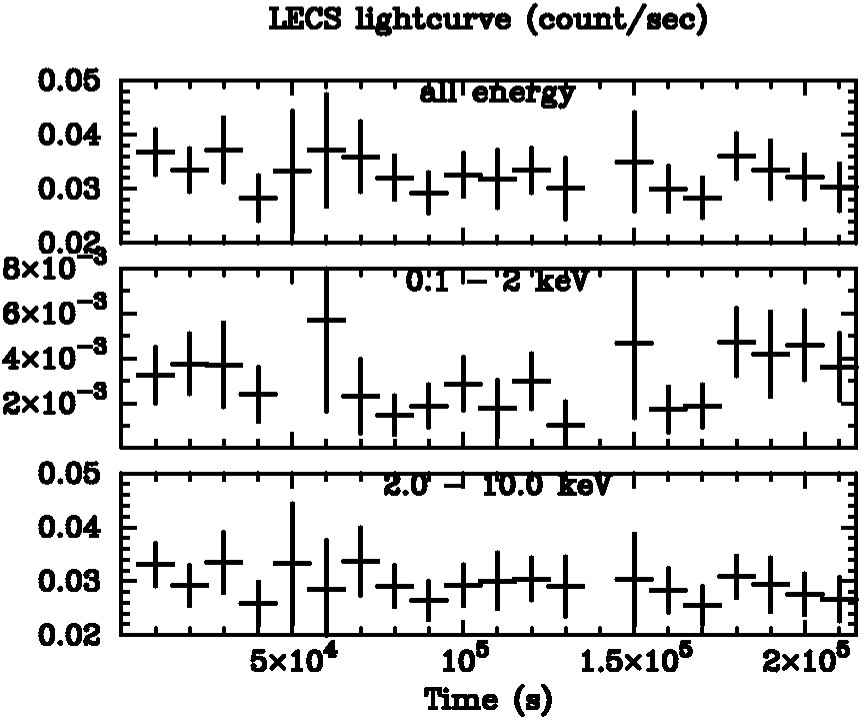
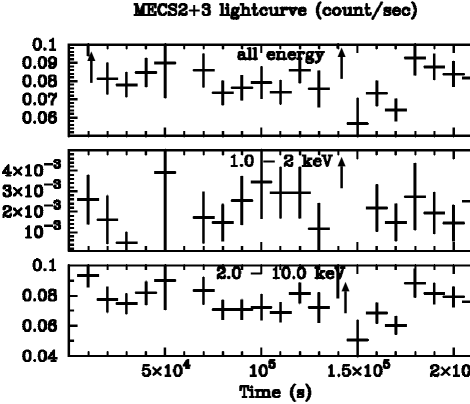
Figure 3 shows X-ray lightcurves of the LECS and MECS2+3, where the time bin width is 10000 s. Unfortunately, there is data loss around 60000 s and 150000 s in both LECS and MECS2+3 lightcurves. When we did not include the periods at 52400 s - 68500 s and 138000 s - 154000 s, the reduced for assuming the constant flux becomes 1.57 in the 2–10 keV band. Such a reduced implies variability in the MECS lightcurves around the time of 160000 s. On the other hand, we found no variability in the MECS soft band and the LECS lightcurves. Therefore, the time variability is possibly caused by only the hard component, although the variability is not so significant. Since the hard component is a direct nuclear emission, as described before, the possible variability in the MECS data implies a change of nuclear activity on a time scale of 10000 s. Such a sub-day time variability of the Seyfert 2 nucleus is also found in a similar object, NGC 6300 ([Guainazzi 2002]). Since the XMM-Newton observation was performed at only the first 10000 sec of the BeppoSAX observation, we cannot confirm the consistency.
| Model | P-L | Absorption | Fe-K line | Refl Comp | ||
| E.W. | /d.o.f. | |||||
| 1 | 1.61 | 1.83 | 6.39 | 291/210 | ||
| 2 | 1.86 | 2.04 | 6.39 | 1.86 | 265/208 | |
| Errors are at 3 level. | ||||||
| model 1; power-law + absorbed power-law, model 2; power-law + absorbed power-law + reflection(PEXRAV). | ||||||
| : photon index of the power-law model. | ||||||
| : absorption column density (). | ||||||
| : line center energy (keV). | ||||||
| : line equivalent width (eV) against the powerlaw component or the reflection component for the model 1 or 2 , respectively. | ||||||
| : scaling factor of reflection (R = 1 for isotropic source above disc). | ||||||


4 Discussion
4.1 Long-Term Variability of Spectral Shape
In our BeppoSAX observation of Mrk 1210, we clearly detected the absorbed direct emission from the nucleus in the hard X-ray band up to 100 keV. The spectral shape and flux are found to be quite different from those of the ASCA data, and consistent with those of the XMM-Newton data below 10 keV. Thanks to the PDS data, our observation was able to find that the reflection component is required significantly. This reflection component reproduces the ASCA spectra very well. Based on these results, we discuss the time variability of Mrk 1210 between the ASCA and BeppoSAX/Newton observation.
We here consider three possibilities. The first is that the hard component in the ASCA data is heavily absorbed nuclear emission, as suggested by Awaki et al. (2000). In this case, the absorption column density is found to be almost the same as cm-2 between the two observations. Then, the absorption-corrected X-ray luminosity in the 2 –10 keV becomes erg s-1 in the BeppoSAX observation, which is higher by a factor of 6 than that in the ASCA observation. Therefore, it is required that the large spectral difference between ASCA and BeppoSAX is due to the luminosity change of the nucleus. There are few Seyfert 2 galaxies that exhibit such a large change of the X-ray luminosity; for example, Mrk 3 is a famous one ([Iwasawa et al. 1994]). However, we think that a luminosity change is not likely, because the ASCA spectra can be modeled well with the reflection component derived from the BeppoSAX data, and thus indicates a constant flux from the nucleus.
The second possibility is that the hard component of the ASCA data is an echo, in other words, a reflection of the nuclear emission, which itself was very faint in the ASCA observation, as claimed by Guainazzi et al. (2002), in analogy with NGC 4051 ([Guainazzi et al. 1998]) and NGC 6300 ([Guainazzi 2002]), whose nuclear emission certainly disappeared even above 10 keV. However, we cannot accept it straightforwardly since the ASCA data did not confirm the flux above 10 keV. This case is similar to the first possibility in assuming that the flux of nuclear emission varied dramatically. The flux of the reflection component should also have followed that of the nuclear direct emission with a time delay of several years. If the nuclear emission in the ASCA observation was very different from that in the BeppoSAX observation, the reflection component was thought to also be different. However, our result shows that the flux of reflection component is almost the same between ASCA and BeppoSAX. Therefore, we consider this not to be preferable.
Accordingly, we suggest the third possibility that the hard component of the ASCA data is a reflection of the nuclear emission, which itself is intrinsically bright, but completely obscured below 10 keV. This is indicated by the correlation between the X-ray and far-infrared luminosity for Seyfert 2 galaxies ([Awaki et al. 2000]), and the intrinsic X-ray luminosity is predicted to be erg s-1, which is almost the same as the absorption-corrected luminosity obtained by BeppoSAX. This possibility gives rise to that a large absorption column density of cm-2 blocked the direct emission in the ASCA observation, and that the absorption decreased down to cm-2 in the BeppoSAX observation. Risaliti, Elvis, and Nicastro. (2002) reported that many Seyfert 2 galaxies have shown a change of absorption column density, but few objects have exhibited such a large change by an order of magnitude as Mrk 1210. M 51 is one of such rare cases ([Fukazawa et al. 2001]).
In summary, the differences in the spectra of Mrk 1210 between ASCA and BeppoSAX is likely to be due to the dramatic variability of either the X-ray luminosity of the nuclear emission or the absorption column density of the molecular torus on a time scale of 6 years. As above, we claim that the latter is preferable, although we cannot rule out the former because of the limitation of the ASCA energy band. Therefore, we need observations with an instrument that has a wider energy band up to a few hundreds keV, such as Integral or Astro-E2 HXD. In any case, it can be said that Mrk 1210 is a very important object to investigate the nuclear structure of Seyfert 2 galaxies, since it is a rare Seyfert 2 galaxy that shows a large variability.
4.2 Molecular Torus
Considering the BeppoSAX results, we can impose some constrains on the geometry of the molecular torus around the nucleus of Mrk 1210. First of all, we estimate how distant the molecular torus exists from the nucleus, based on the maser results. Mrk 1210 is known to associate a bright H2O maser emission. Let us assume roughly that the maser emission originates at the most inner radius of the molecular torus. The maser was observed at 4214 km s-1 against a systemic velocity of 4046 km s-1 of the Mrk 1210 galaxy ([Braatz, Henkel 1994]), and thus the maser-emission region rotates at a velocity of 168 km s-1. The mass of the central blackhole is assumed to be , based on the optical bulge luminosity of , a mass-to-luminosity ratio of , and a typical blackhole-to-bulge mass ratio of 0.002 (Kormendy, Richstone 1995). Considering the Keplarian motion around the nuclear blackhole, it is estimated that the molecular torus exists at less than 1 pc from the nucleus. This is consistent with the value estimated for other Seyfert 2 galaxies ([Risaliti et al. 2000]), and thus the overall dimension of torus is on the order of 1 pc.
Taking this constraint into account, we examine the two possibilities described in subsection 4.1. In the case of the variability of the X-ray luminosity, the absorption column density of the torus has not changed in 6 years. Therefore, we can say that the size of the molecular torus is more than 2 pc, or the molecular torus is homogeneous. While in the other case, we can constrain the size of the molecular torus to be less than 0.001 pc, considering the rotation velocity of the torus and the variability time scale. Since the latter case is, we think, preferable, it is suggested that the torus is not homogeneous, but like a blob structure.
The authors thank Dr. H. Awaki for a careful reading of the manuscript and many helpful comments. The authors are also grateful to the BeppoSAX team for their help in the spacecraft operation, calibration, and data analysis.
References
- [Antonucci, Miller 1985] Antonucci, R. R. J., & Miller, J. S. 1985, ApJ, 297, 621
- [Awaki et al. 2000] Awaki, H., Ueno, S., Taniguchi, Y., Weaver, K. A. 2000, ApJ, 542, 175
- [Boella et al. 1997] Boella, G., et al. 1997, A&AS, 122, 327
- [Braatz, Henkel 1994] Braatz, J. A., Wilson, A. S., & Henkel, C. 1994, ApJ, 437, 99
- [Dickey, Lockman 1990] Dickey, J., M., & Lockman, F., J. 1990, ARA&A, 28, 215
- [Frontera et al. 1997] Frontera, F., Costa, E., Dal Fiume, D., Feroci, M., Nicastro, L., Orlandini, M., Palazzi, E., & Zavattini, G. 1997, A&AS, 122, 357
- [Fukazawa et al. 2001] Fukazawa, Y., Iyomoto, N., Kubota, A., Matsumoto, Y., and Makishima, K. 2001, A&A, 374, 73
- [Gilli et al. 2000] Gilli, R., Maiolino, R., Marconi, A., Risaliti, G., Dadina, M., Weaver, K. A., & Colbert, E. J. M. 2000, A&A, 355, 485
- [Guainazzi et al. 1998] Guainazzi, M., et al. 1998, MNRAS, 301, L1
- [Guainazzi 2002] Guainazzi, M. 2002, MNRAS, 329, L13
- [Guainazzi et al. 2002] Guainazzi, M., Matt, G., Fiore, F., & Perola, G. C. 2002, A&A, 388, 787
- [Iwasawa et al. 1994] Iwasawa, K., Yaqoob, T., Awaki, H., Ogasaka, Y. 1994, PASJ, 46, L167
- [Kormendy, Richstrone 1995] Kormendy, J., & Richstone, G. 1995, ARA&A, 33, 581
- [Magdzarz, Zdziarski 1995] Magdziarz, P., & Zdziarski, A. A. 1995, MNRAS, 273, 837
- [Makishima et al. 1990] Makishima, K., Ohashi, T., Kondo, H., Palumbo, G. G. C., & Trinchieri, G. ApJ, 1990, 365, 159
- [Parmar et al. 1997] Parmar, A. N., et al. 1997, A&AS, 122, 309
- [Risaliti et al. 2000] Risaliti, G., Maiolino, R., & Bassani, L. 2000, A&A, 356, 33
- [Risaliti et al. 2002] Risaliti, G., Elvis, M., & Nicastro, F. 2002, ApJ, 571, 234