Supernova light curve models for the bump in the Optical Counterpart of X-Ray Flash 030723
Abstract
XRF 030723 is the first X-ray flash (XRF) to show in its optical light curve (LC) a bump that has been interpreted as the signature of a supernova (SN). After subtracting the afterglow component from the observed optical LC of the XRF counterpart, the properties of the putative SN are constrained by means of synthetic LCs of core-collapse SNe. For the redshift range – 1, all possible models require a rather small mass of synthesized 56Ni, i.e., (56Ni) 0.01 – 0.3 . The models used to describe the energetic SNe Ic associated with gamma-ray bursts (SNe 1998bw and 2003dh) are too massive for the observed LC. If the relation between ejected 56Ni mass and total ejecta mass established from models of various Type Ic SNe also holds for the putative SN in XRF 030723, the ejecta mass is constrained to be 1 – 3 and the kinetic energy erg. This corresponds to a progenitor with . The SN therefore appears to have properties intermediate between a normal SN Ic like SN 1994I and a more energetic object like SN 2002ap.
1 INTRODUCTION
X-ray flashes (XRFs) are intense transient bursts of X-rays, similar to gamma-ray bursts (GRBs) but characterized by a stronger X-ray than -ray fluence (Heise et al., 2001). It has been speculated that XRFs are indeed linked to GRBs. Various scenarios have been proposed: XRFs may be GRBs viewed sufficiently off-axis (Yamazaki et al. 2003), or more massive explosions than those that make GRBs, leading to a smaller Lorenz factor for the jet (Dermer, Chiang, & Mitman 2000). However, the real nature of the observed difference between GRBs and XRFs is not yet known.
Both GRBs and XRFs are extragalactic sources. A number of GRBs have now been localized, and they are all cosmological. Interestingly, the three nearest long GRBs ever localized are all associated with spectroscopically confirmed supernovae (SNe). Although the case of GRB 980425/SN 1998bw (Galama et al., 1998) was controversial, that of GRB 030329/SN 2003dh is established beyond doubt (e.g., Matheson et al. 2003. GRB 031203 at also appears to have hosted a SN possibly similar to SN 1998bw (e.g., Thomsen et al. 2004).
All these SNe are of Type Ic (SNe Ic), and display very high-velocity ejecta. SNe Ic are thought to originate from the collapse of the cores of massive stars that have lost both their H and He envelopes, exploding as C+O stars (e.g., Nomoto et al. 1994). SNe 1998bw and 2003dh have been successfully modelled as highly energetic explosions (the spherical kinetic energy is times that of a normal SN: Iwamoto et al. 1998; Mazzali et al. 2003), ejecting 10 of material and synthesizing 0.5 of 56Ni, much more than in normal core-collapse SNe. The aspherical models require lower energy, but still times higher than a normal SN (Höflich et al., 1999; Maeda et al., 2003). These SNe Ic and others, not known to be associated with GRBs but showing the spectroscopic signatures of a high explosion energy erg), have been called hypernovae. Both the kinetic energy and the mass of 56Ni of SNe Ic may positively correlate with progenitor mass (Nomoto et al., 2003).
On the other hand, only a few XRFs have been accurately localized (to less than a few arcmin) thus far, and only one of these is known to be at low redshift: XRF 020903 at (Soderberg et al., 2003). In the case of XRF 030723, only upper and lower redshift limits could be determined, because the host galaxy could not be observed (Fynbo et al., 2004). The lower limit, , follows from the non-detection of the host, while the upper limit, , was derived from the lack of Ly absorption down to 4000 .
Fynbo et al. (2004) obtained optical photometry and spectroscopy of XRF 030723. The -band light curve (LC) of the XRF counterpart showed a ‘bump’, which may be the signature of a SN component. Other interpretations are possible (e.g., a two-jet model Huang et al. 2004), but Fynbo et al. (2004) claimed that they could rule them out based on the SED evolution. Interpreting the bump as a SN sets further limits on the redshift (). Fynbo et al. (2004) compared the bump with the LCs of different SNe Ic, concluding that the best match was given by the rest-frame -band LC of SN 1994I, at a redshift . SN 1994I was a normally-energetic SN Ic, with low-mass ejecta (Nomoto et al., 1994; Iwamoto et al., 1994). However, the featureless spectrum of the bump obtained by Fynbo et al. (2004) makes them favour a broad-lined, highly energetic SN, like SN 1998bw or SN 2002ap.
In this paper, we model the observed LC using different SN Ic models, both normally- and hyper-energetic, and explore various redshifts to determine the possible range of the parameters of the SN associated with XRF 030723.
2 Light Curve Models
Assuming that the SN in XRF 030723 is of Type Ic, by analogy with the cases of GRB-associated SNe, we computed synthetic bolometric LCs of exploded C+O star models. We used an LTE radiation hydrodynamical code and a gray -ray transfer code (Iwamoto et al., 2000). The electron-scattering opacity was calculated from the solution of the Saha equation, while the line opacity was fixed at 0.03 , the value that was used to model SN 1998bw (Nakamura et al., 2001). The total opacity is – 0.1 (compared to the range 0.05 – 0.15 for SN 1994I: Iwamoto et al. 1994). The accurate line opacity is unknown, if it is bigger, the timescale of LC peak becomes longer.
We started from four different C+O star explosion models: CO21, a normal SN Ic model developed for SN 1994I (Iwamoto et al., 1994); CO100, an energetic model developed for SN 1997ef (Mazzali, Iwamoto, & Nomoto, 2000); CO100/4, a scaled-down version of CO100 developed for SN 2002ap (Mazzali et al., 2002); and CO138, a model for the very energetic SN 1998bw (Nakamura et al., 2001). The model parameters, i.e. ejected mass , kinetic energy , and progenitor main-sequence mass are summarized in Table 1.
Given the uncertain redshift, we considered three values: , 0.6, and 0.8. The observed -band roughly corresponds to the rest-frame -band if , the -band if , and the -band if . Because of time-dilation, the observed LC corresponds to narrower rest-frame LCs for increasing redshifts. On the other hand, in SNe Ic the LC peak is narrower for bluer bands. Coincidentally, these two effects roughly cancel out.
We scaled the masses of the above C+O models, conserving their explosion energies, and calculated synthetic LCs to find which scalings yield the best-fit models. Since the code computes bolometric LCs, the monochromatic LCs were estimated using bolometric corrections (BCs). As spectral and color information about the possible SN is very limited, we used the BCs of known SNe Ic as templates. These were calibrated in time with respect to the LC peak to match the apparently fast evolution of the SN. We used the BC template appropriate for the parameters of each model. For low-mass, low-energy models, we used the BCs of SN 1994I (assuming ; Richmond et al. 1996; B. Schmidt & R. Kirshner 1994, private communication). In other cases, the model parameters indicated energetic explosions, and then we adopted the BCs of a suitable hypernova and recalculated the model LC. In order to match the observed flux, we modified the mass of 56Ni synthesized for different redshifts and models. 56Ni powers the SN LC through the decay chain 56Ni 56Co 56Fe.
Model parameters affect the synthetic LC. The timescale of the LC peak, , is determined by the combination of photon diffusion and ejecta expansion and depends on and as (Arnett, 1982), where represents the effect of the density structure and 56Ni distribution and is the model-dependent average opacity.
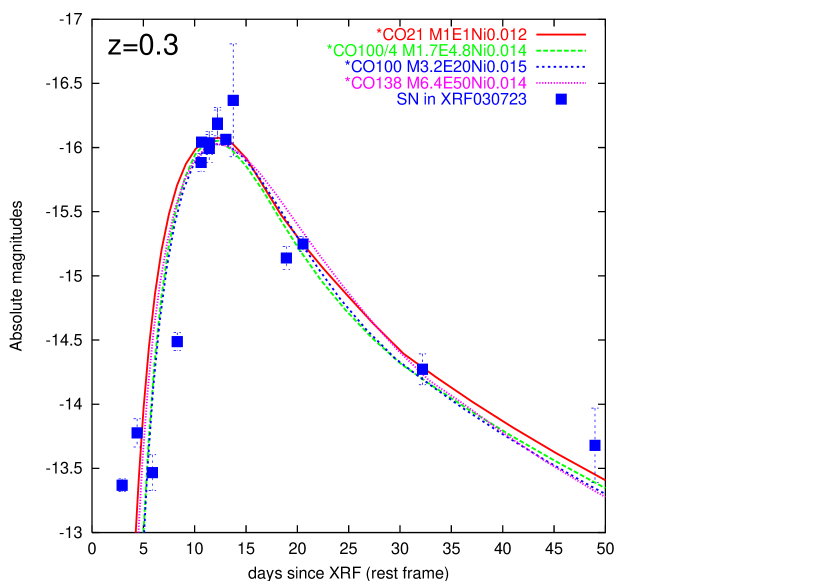
The parameters of our best-fit models are listed in Table 2, as are the template BCs used, and the computed synthetic LCs are compared to the observed LC in Figures 1, 2, and 3 for the three redshifts. The observed LC was derived from the Fynbo et al. (2004) R-band photometry by subtracting the Beuermann extrapolation of the power-law component of the afterglow. As expected, for every value of (i.e., for every model) there is a value of the ejected mass for which the synthetic LC reproduces the observations. Had we been able to model the spectra, we could have uniquely constrained the value of the kinetic energy. However, the spectral information is limited. Fynbo et al. (2004) discussed that the SED of the bump is consistent with that of a SN similar to SN 1998bw, and that the only, low signal-to-noise spectrum is better consistent with a broad-lined SN like SN 1998bw or SN 2002ap than a narrow-lined one like SN 1994I. We discuss these points later.
Because the LC peak of the SN in XRF 030723 is intrinsically narrow, the only models that give satisfactory results without major modifications to their mass values are models CO21, which is scaled up somewhat, and CO100/4, which has to be scaled down (the top panel of Figure 4). All other models were originally developed for the high-mass HNe and must be scaled down in mass significantly to yield a narrow LC peak.
The delayed LC-rise of the SN in XRF 030723, compared with the hyper-energetic SNe 1998bw and 2002ap (e.g., Galama et al. 1998; Yoshii et al. 2003), cannot be reproduced by models with uniform 56Ni mixing. Instead, we had to assume that 56Ni is distributed only in the inner 10% of the ejected mass in our modelling. This increases the photon diffusion time, leading to a delayed onset of the LC. The total 56Ni mass is 0.012 – 0.015 if , 0.07 – 0.12 if , and 0.1 – 0.3 if . These estimates would change if we could take into account the unknown -corrections. For example, the -correction of SNe Ia between the observed - and rest-frame -bands, , at is (Kim, Goobar, & Perlmutter, 1996). If a similar value was applied here (SNe Ic show some overall spectral similarity to SNe Ia), the 56Ni mass for would decrease to 0.04 . In the case the relevant -correction for SNe Ia, , varies between and near the peak, which suggests that the 56Ni mass could decrease to 0.01 . The -correction for , , is possibly positive for SNe Ic because of the very small flux in the -band. This could make the 56Ni mass larger than 0.25 .
3 Discussion
All the models discussed above can reproduce the observed LC. Given the limited spectral information, it is unfortunately not easy to select among them. However, based on their properties, we can at least attempt to narrow down the range of possibilities.
In Figure 4, the basic parameters of the best-fit models are compared with the properties of four well-studied SNe Ic of various energies. The top panel is a plot of vs. for the various models and SNe. The bottom panel shows how varies depending on the assumed redshift, all other model properties being the same. Redshift affects both the estimated SN luminosity and the BCs adopted in the LC modelling. Based on this plot, we can select the models that are likely to be applicable to the SN in XRF 030723, assuming that it is a SN Ic. The models for the observed Type Ic SNe are also plotted.
First we discuss the low-redshift case (). In this case, the mass of 56Ni is very small () for all models. This value is much smaller than even in a normal SNe Ic like SN 1994I, suggesting that is a significant underestimate of the real redshift if the observed bump is in fact a SN. However, if XRF 030723 really occurred at , then strong fall-back and/or a low-energy SN must be invoked to explain such a small 56Ni mass. If fall-back is strong, much of the synthesized 56Ni may be captured by the compact remnant, like in some Type II SNe which eject very little 56Ni (e.g., SN 1997D, Turatto et al. 1998; Zampieri et al. 2003). The other possibility is that the explosion energy of the SN is too low to synthesize much 56Ni. The – relation of our best-fit models suggests that SNe with as low as, e.g., would have the correct LC and may be expected to synthesize little 56Ni as is required for . Such SNe must come from low-mass C+O stars, originating from main-sequence stars of .
Next we consider the high-redshift case (). This sets an upper limit for the ejected 56Ni mass at 0.3 . Combined with the tendency of actual SNe Ic to produce more 56Ni for increasing and , this in turn sets an upper limit to and . The ejecta mass of the SN in XRF 030723 is probably less than (i.e., ), and the kinetic energy less than erg. These values are smaller than in the GRB-associated SNe. It is very unlikely that the SN can be as massive as SNe 1998bw (Iwamoto et al., 1998) or 2003dh (Mazzali et al., 2003) for two reasons: first, the kinetic energy would be extremely high ( erg), and secondly, it would be strange for such a hyper-energetic explosion only to synthesize 0.2 of 56Ni.
If the redshift is 0.6, the required 56Ni mass is . Both the SN 1994I-like model ∗CO21 (, erg, (56Ni) ) and the SN 2002ap-like model ∗CO100/4 (, erg, (56Ni) ) are consistent with the observed relations between , , and (56Ni). If the redshift is slightly higher (e.g., ), a larger (56Ni) is required, and a more massive and energetic model (; – erg) is probably necessary. This makes the tentative SN more like SN 2002ap. Summarizing, our preferred estimates are for a redshift , consistent with the range favored by Fynbo et al. (2004), and SN properties between a normal SN and a low-energy, low-mass hypernova.
These results are consistent with the colors of the putative SN on August 6 and 19, i.e., 14 and 21 days after the XRF (Fynbo et al., 2004). We made a rough comparison between the XRF and the color evolution of other Type Ic SNe for the three redshifts, neglecting the unavailable K-corrections. The observed and on August 6 cannot be used to distinguish between the three redshifts and between SNe 1998bw, 2002ap, and 1994I. However, the non-detection on August 16, ( and ) seems to match SN 2002ap better because the flux is more depressed in SN 2002ap than in SNe 1994I or 1998bw. The detected on Aug 14, however, suggests , which is too big to be consistent with the photometry of SNe 1998bw, 2002ap, and 1994I (but see Fynbo et al. 2004). Finally, the observed on August 16 favors and a comparison with SNe 1994I and 2002ap. Support for an SN 2002ap-like object also comes from the apparently featureless spectrum of the bump (Fynbo et al., 2004). SN 2002ap has a broad-lined spectrum, much more similar to SN 1998bw than to SN 1994I.
This is the first case of an XRF probably associated with a SN (Watson et al., 2004). Interestingly, the properties of the SN appear to lie at the low end of the distribution of HN properties, or perhaps even to be similar to those of normal SNe Ic (Figure 4). This may be the consequence of an unfavorable orientation which prevented us from seeing the GRB and the most energetic part of the ejecta, but it also may indicate a real difference between XRFs and GRBs on the one hand and the accompanying SNe on the other. If the progenitor of the SN/XRF is really intermediate between those of SN 2002ap and 1994I, i.e., , a black hole may not be formed (e.g., if as in Fryer & Kalogera 2001), and the central engine may be a neutron star like in the “magnetar” model (Nakamura et al., 1998), instead of the black hole of the “collapsar” model for long GRBs (MacFadyen & Woosley, 1999). Accurate spectral information, which would have allowed us to constrain the properties of the SN much more tightly, is unfortunately not available. There is however one case where a normal, or possibly SN 2002ap-like SN Ic was claimed to be associated with a GRB (GRB 021211/SN 2002lt, Della Valle et al. 2003). Clearly, more data on the SN – GRB/XRF connection are necessary before we can understand the full extent of the relation between these phenomena.
References
- Arnett (1982) Arnett, W. D. 1982, ApJ, 253, 785
- Della Valle et al. (2003) Della Valle, M., et al. 2003, A&A, 406, L33
- Dermer, Chiang, & Mitman (2000) Dermer, C.D., Chiang, J., & Mitman, K.E. 2000, ApJ, 537, 785
- Fryer & Kalogera (2001) Fryer, C. L., & Kalogera, V. 2001, ApJ, 554, 548
- Fynbo et al. (2004) Fynbo, J. P. U., et al. 2004, ApJ, in press (astro-ph/0402240)
- Galama et al. (1998) Galama, T. J., et al. 1998, Nature, 395, 670
- Heise et al. (2001) Heise, J., in’t Zand, J., Kippen, R., & Woods, P. 2001, in GRBs in the Afterglow Era, 16
- Höflich et al. (1999) Höflich, P., et al. 1999, ApJ, 521, 179
- Huang et al. (2004) Huang, Y.F., et al. 2004, ApJ, 605, 300
- Iwamoto et al. (1994) Iwamoto, K., Nomoto, K., Höflich, P., Yamaoka, H., Kumagai, S., & Shigeyama, T. 1994, ApJ, 437, L115
- Iwamoto et al. (1998) Iwamoto, K., et al. 1998, Nature, 395, 672
- Iwamoto et al. (2000) Iwamoto, K., et al. 2000, ApJ, 534, 660
- Kim, Goobar, & Perlmutter (1996) Kim, A., Goobar, A., & Perlmutter, S. 1996, PASP, 108, 190
- MacFadyen & Woosley (1999) MacFadyen, A. I., & Woosley, S. E. 1999, ApJ, 524, 262
- Matheson et al. (2003) Matheson, T., et al. 2003, ApJ, 599, 394
- Maeda et al. (2003) Maeda, K., Mazzali, P.A., Deng, J., Nomoto, K., Yoshii, Y., Tomita, H., & Kobayashi, Y. 2003, ApJ, 593, 931
- Mazzali, Iwamoto, & Nomoto (2000) Mazzali, P.A., Iwamoto, K., & Nomoto, K. 2000, ApJ, 545, 407
- Mazzali et al. (2002) Mazzali, P. A., et al. 2002, ApJ, 572, L61
- Mazzali et al. (2003) Mazzali, P. A., et al. 2003, ApJ, 599, L95
- Nakamura et al. (1998) Nakamura, T. 1998, Prog. Theor. Phys., 100, 921
- Nakamura et al. (2001) Nakamura, T., Mazzali, P. A., Nomoto, K., Iwamoto, K. 2001, ApJ, 550, 991
- Nomoto et al. (1994) Nomoto, K., Yamaoka, H., Pols, O. R., van den Heuvel, E. P. J., Iwamoto, K., Kumagai, S., & Shigeyama, T. 1994, Nature, 371, 227
- Nomoto et al. (2003) Nomoto, K., Maeda, K, Mazzali, P. A., Umeda, H., Deng, J., & Iwamoto, K. 2004, in Stellar Collapse, ed. C. L. Fryer (Dordrecht: Kluwer), in press (astro-ph/0308136)
- Richmond et al. (1996) Richmond, M. W., et al. 1996, AJ, 111, 327
- Soderberg et al. (2003) Soderberg, A. M., et al. 2003, ApJ, submitted (astro-ph/0311050)
- Thomsen et al. (2004) Thomsen, B., et al. 2004, A&A, 419, L21
- Turatto et al. (1998) Turatto, M., et al. 1998, ApJ, 498, L129
- Watson et al. (2004) Watson, D., et al. 2004, ApJ, 605, L101
- Yamazaki et al. (2003) Yamazaki, R., Ioka, K., & Nakamura, T. 2003, ApJ, 593, 941
- Yoshii et al. (2003) Yoshii, Y., et al. 2003, ApJ, 592, 467
- Zampieri et al. (2003) Zampieri, L., et al. 2003, MNRAS, 338, 711
| Model | Supernova | |||
|---|---|---|---|---|
| ( ergs) | ||||
| CO21 | SN 1994I | 15 | 0.88 | 1 |
| CO100/4 | SN 2002ap | 20 – 25 | 2.4 | 4.8 |
| CO100 | SN 1997ef | 35 – 40 | 9.6 | 20 |
| CO138 | SN 1998bw | 40 | 11 | 50 |
| Model aaThe subscript ∗ is used to discriminate each modified model from the original model. | (56Ni)/ | Bolometric Correction | ||||
|---|---|---|---|---|---|---|
| ( ergs) | Template bbThe BCs for SNe 1998bw and 2002ap are scaled up in time by a factor of 1.5 and 1.2, respectively, with respect to the peak epoch. | |||||
| ∗CO21 | 1 | 1 | 0.012 | 0.07 | 0.10 | SN 1994I |
| ∗CO100/4 | 1.7 | 4.8 | 0.014 | 0.11 | 0.27 | SN 2002ap |
| ∗CO100 | 3.2 | 20 | 0.015 | 0.12 | 0.30 | SN 2002ap |
| ∗CO138 | 6.4 | 50 | 0.014 | 0.09 | 0.12 | SN 1998bw |