A Survey of Quasars in the Sloan Digital Sky Survey III: Discovery of Five Additional Quasars11affiliation: Based on observations obtained with the Sloan Digital Sky Survey, and with the Apache Point Observatory 3.5-meter telescope, which is owned and operated by the Astrophysical Research Consortium; and with the MMT Observatory, a joint facility of the University of Arizona and the Smithsonian Institution, with the Univeristy of Arizona 2.3-meter Bok Telescope, with the Kitt Peak National Observatory 4-meter Mayall Telescope, with the 6.5-meter Landon Clay Telescope at the Las Campanas Observatory, a collaboration between the Observatories of the Carnegie Institution of Washington, University of Arizona, Harvard University, University of Michigan, and Massachusetts Institute of Technology , and with the Hobby-Eberly Telescope, which is a joint project of the University of Texas at Austin, the Pennsylvania State University, Stanford University, Ludwig-Maximillians-Universität München, and Georg-August-Universität Göttingen.
Abstract
We present the discovery of five new quasars at , selected from the multicolor imaging data of the Sloan Digital Sky Survey (SDSS). Three of them, at redshifts 5.93, 6.07, and 6.22, were selected from 1700 deg2 of new SDSS Main Survey imaging in the Northern Galactic Cap. An additional quasar, at redshift 5.85, was discovered by coadding the data obtained in the Fall Equatorial Stripe in the SDSS Southern Survey Region. The fifth object, at redshift 5.80, is selected from a non-standard SDSS scan in the Southern Galactic Cap outside the Main Survey area. The spectrum of SDSS J162331.81+311200.5 () shows a complete Gunn-Peterson trough at , similar to the troughs detected in other three quasars known. We present a composite spectrum of the quasars discovered in the SDSS to date. The average emission line and continuum properties of quasars exhibit no significant evolution compared to those at low redshift. Using a complete sample of nine quasars, we find that the density of quasars with at is Mpc-3 (, and ), consistent with our previous estimates. The luminosity distribution of the sample is fit with a power law luminosity function , somewhat steeper than but consistent with our previous estimates.
1 Introduction
This paper is the third in a series presenting -dropout quasars selected from the multicolor imaging data of the Sloan Digital Sky Survey (SDSS; York et al. (2000), Stoughton et al. 2002, Abazajian et al. 2003, 2004). In Fan et al. (2000) and in the first two papers of this series (Fan et al. 2001c , Paper I, Fan et al. (2003), Paper II), we presented the discovery of seven luminous quasars at , selected from deg2 of SDSS imaging in the Northern Galactic Cap. In this paper, we describe the discovery of five quasars at , 5.85, 5.93, 6.07 and 6.22, respectively. The scientific objectives, photometric data reduction, target selection and follow-up observation procedures are described in detail in Paper I. Three of the new quasars were selected using the same color selection procedures described in Paper II, as outlined briefly in §2.1. One object was selected using the co-added catalog from multi-epoch imaging of the Fall Equatorial Stripe in the SDSS Southern Survey region. The co-addition procedures are described in §2.2. The final object was selected in a non-standard SDSS scan in the Southern Galactic Cap outside the main survey area. We present the spectroscopic follow-up observations of the -dropout candidates and the photometric and spectroscopic properties of the newly-discovered quasars in §3. Combining the quasars in this paper and those presented in Fan et al. (2002) and in Papers I and II, we construct the composite spectrum of quasars, and compare it with the average quasar spectrum at low redshift (§4). Finally, we update our estimate of the evolution of the high-redshift quasar luminosity function in §5.
Following the previous papers in this series, we use two cosmologies to present our results: (1) , and (-model); (2) , and (-model). Coincidentally, the luminosity and number densities measured under our -model are within 1% of those in the WMAP (Spergel et al. (2003)) cosmology with , and .
2 Candidate Selection and Identification
The Sloan Digital Sky Survey is using a dedicated 2.5m telescope and a large format CCD camera (Gunn et al. (1998)) at the Apache Point Observatory in New Mexico to obtain images in five broad bands (, , , and , centered at 3551, 4686, 6166, 7480 and 8932 Å, respectively; Fukugita et al. (1996)) of high Galactic latitude sky in the Northern Galactic Cap. About deg2 of sky have been imaged at the time of this writing (Mar 2004). The imaging data are processed by the astrometric pipeline (Pier et al. (2003)) and photometric pipeline (Lupton et al. (2001)), and are photometrically calibrated to a standard star network (Smith et al. (2002), see also Hogg et al. (2001)). In addition to the Main Survey, the SDSS also obtains multi-epoch imaging in deg2 along the Celestial Equator in the Southern Galactic Cap (the SDSS Southern Survey, York et al. 2000). At the time of this writing, the Southern Survey region has been imaged between 5 and 15 times, depending on the RA of the field. The multi-epoch data are used to study variable objects and are co-added to reach fainter limiting magnitudes. We will use imaging from both the Main Survey and the Southern Survey to search for quasar candidates.
2.1 Selection in the Main Survey Area
The SDSS quasar target selection pipeline (Richards et al. 2002) selects only quasar candidates at . The highest-redshift object discovered in the SDSS spectroscopic survey is at (Anderson et al. 2001). At higher redshift, quasars become -dropout objects; their selections require additional follow-up observations. Papers I and II present the results from a survey of -dropout candidates selected from deg2 of SDSS Main Survey imaging carried out in the Springs of 2000, 2001 and 2002. In Spring 2003, we searched for -dropout quasar candidates in 37 new SDSS imaging runs. These imaging data were taken between 10 October 2002 (Run 3358) and 29 April 2003 (Run 3919). We used the same criterion to decide which photometric runs to include in the -dropout survey as in Papers I and II: the band image quality, measured by the psfWidth parameter ( FWHM for a Gaussian profile) in the fourth column of the SDSS camera, should be better than 1.8′′. The median seeing in the and bands is for the entire survey area (Abazajian et al. (2003)). There is overlap between adjacent SDSS strips and stripes (York et al. 2000), meaning that these 37 new runs overlap somewhat with the area covered in Papers I and II. Taking these overlaps into account, we find that the total new area of the sky covered by these runs is 1708 deg2, bringing the combined sky coverage of Papers I, II and this paper to 4578 deg2.
We applied the same color selection criteria as in Paper II (see Figure 1 and 2 in Paper II) to the new SDSS imaging data to selection quasar candidates. A total of 80 -dropout candidates were selected in the main survey area. The photometric and spectroscopic follow-up observations were carried out over a number of nights between December 2002 and June 2003. Independent photometry was carried out using the Seaver Prototype Imaging camera (SPICAM) in the SDSS filter on the ARC 3.5m telescope at the Apache Point Observatory. photometry was carried out using the NICMOS imager on Steward Observatory’s 2.3m Bok Telescope at Kitt Peak, and using the GRIM II instrument (the near infrared GRIsm spectrometer and IMager), also on the ARC 3.5m. The spectroscopic follow-up observations were obtained using the Red-Channel Spectrograph on the MMT 6.5m telescope on Mt. Hopkins, the Double Imaging Spectrograph (DIS) on the ARC 3.5m, the Multi-Aperture Red Spectrograph (MARS) on the 4-m telescope on Kitt Peak, and the Low Resolution Spectrograph (LRS, Hill et al. (1998)) on the Hobby-Eberly Telescope.
2.2 Selection in the SDSS Southern Survey Region
The SDSS Main Survey imaging consists of single epoch observations with exposure times of 54.1 seconds. For the average seeing conditions (FWHM ), the 5- limiting magnitudes in the and bands are 22.5 and 20.5, respectively (Stoughton et al. 2002, Abazajian et al. (2003)). At this depth, the SDSS Main Survey only allows selection of -dropout candidates at , and therefore is only sensitive to the most luminous quasars at (). The multi-epoch imaging obtained in the SDSS Southern Survey area will eventually provide photometry magnitudes deeper than the main survey over 270 deg2, enabling selection of much fainter quasar candidates. By the end of 2003, the SDSS Southern Survey Region had been scanned 5 – 15 times, resulting in a dataset that goes more than one magnitude deeper than the Main Survey.
In Fall 2002, we used a preliminary co-added catalog of epoch imaging to select quasar candidates. The co-added catalog was generated by matching sources detected in more than one SDSS run within a radius of . The average flux is calculated from the SDSS asinh magnitudes (Lupton, Gunn & Szalay (1999)), weighted by the inverse of the flux variances. Note that when co-adding at the catalog level, an object is required to be detected in the individual runs. Therefore, while the co-addition improves the S/N of faint sources, allowing us to select candidates all the way down to the 6- detection limit, it does not allow measurement of objects fainter than the detection limit of single SDSS exposures. Therefore, we can only select candidates at . We searched for candidates from deg2 of co-added catalogs. The color selection criteria in the Southern Survey region are the same as those used in the Main survey area. A number of faint -dropout candidates were observed using Magellan II Clay Telescope and the Boller and Chivens (B&C) spectrograph on 16 Oct 2002. One quasar, SDSS J000552.34–000655.8111The naming convention for SDSS sources is SDSS JHHMMSS.SSDDMMSS.S, and the positions are expressed in J2000.0 coordinates. The astrometry is accurate to better than in each coordinate. (hereafter SDSS J0005–0006, ) was discovered at a redshift of 5.85.
2.3 Selection in the Constant-Longitude Scans
The SDSS has obtained some imaging data outside the survey boundary (York et al. 2000; Finkbeiner et al. 2004), including a few strips in the Southern Galactic Cap that extend to low Galactic latitude. We have also selected -dropout candidates in these runs. One new quasar, SDSS J000239.39+255034.8 (), was selected from Run 4152, a constant-longitude scan (at ), observed on 29 Sep 2003. The sample in these scans which go outside the main survey area is not yet complete, and so we do not include this object in our complete sample.
3 Discovery of Five New Quasars at
Among the 80 -dropout candidates candidates in the Main Survey area, 15 are false band only detections which are most likely cosmic rays; 55 are M or L dwarfs (mostly classified photometrically based on their red colors); and 7 are likely T dwarfs. Several objects still lack proper infrared spectroscopy, so the T dwarf classification is still preliminary. Three of the candidates are identified as quasars at : SDSS J141111.29+121737.4 (, SDSS J0002+2550 hereafter), SDSS J160254.18+422822.9 (, SDSS J1602+4228), and SDSS J162331.81+311200.5 (, SDSS J1623+3112). The discovery spectra of the first two objects were obtained using DIS on the ARC 3.5m in April 2003, and the discovery spectrum of the last object was obtained in June 2003 at MMT using the Red Channel spectrograph. We have subsequently obtained longer exposures of these three quasars using the Red Channel on MMT and MARS on the Kitt Peak 4-meter, with total exposure times of 2 – 4 hours each. These spectra are shown in Figure 2. As discussed above, SDSS J000552.34–000655.8 () was discovered in the deep imaging of the SDSS Southern Survey region. Figure 2 shows the discovery spectrum, a 40-min exposure obtained with the Clay telescope and B&C spectrograph in Oct 2002. The discovery spectrum of SDSS J000239.39+255034.8 (, §2.3) was obtained at the MMT using the Red Channel Spectrograph in Nov 2003. This one hour exposure is shown in Figure 2.
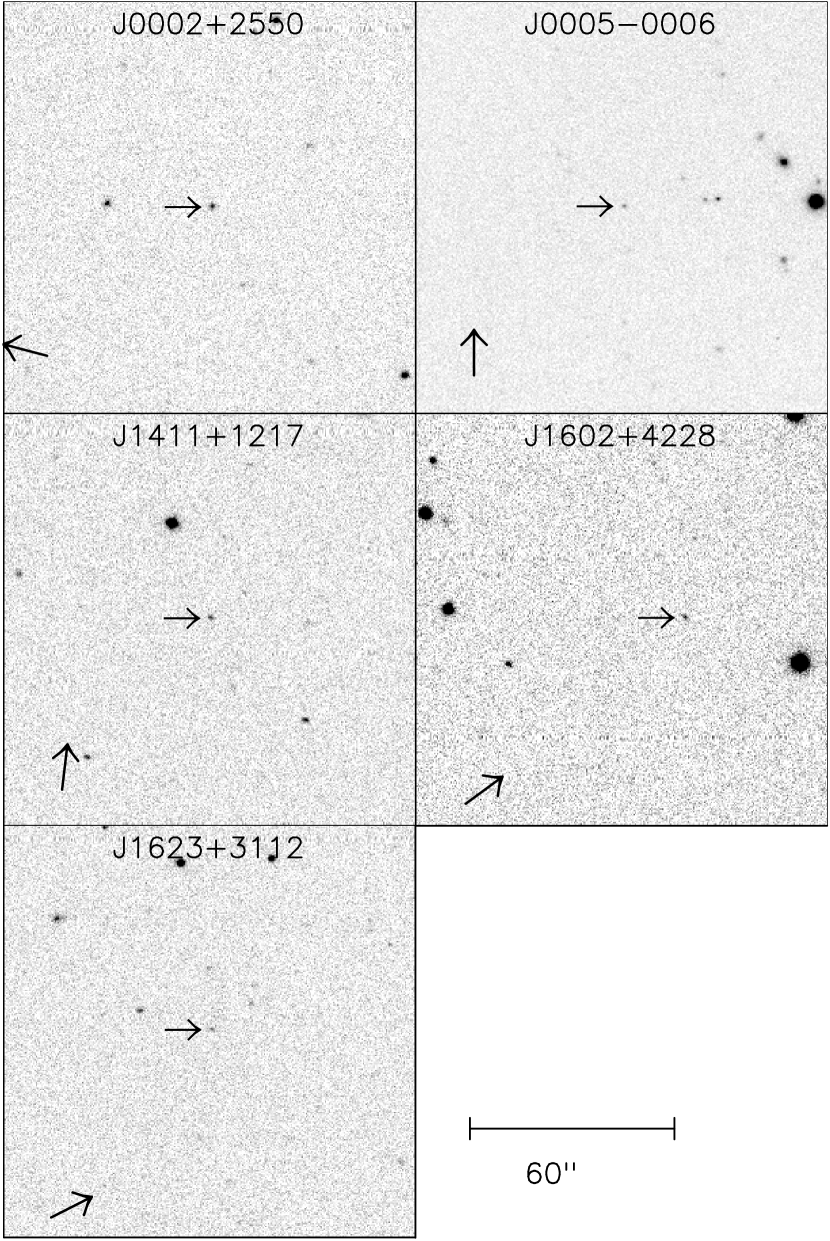
The finding charts of the five new quasars are presented in Figure 1. The spectra are flux-calibrated to match the observed band photometry. Table 1 presents the photometric properties of the new quasars, and Table 2 presents the measurements of their continuum properties. Following Papers I and II, the quantity is defined as the AB magnitude of the continuum at rest-frame 1280Å, after correcting for interstellar extinction using the map of Schlegel, Finkbeiner & Davis (1998). We extrapolate the continuum to rest-frame 1450Å, assuming a continuum shape , to calculate . None of the five quasars is detected in the FIRST (Becker, White & Helfand (1995)) or NVSS (Condon et al. (1998)) radio surveys. The discovery of these five new quasars brings the total of quasars known to twelve, all selected from SDSS imaging.
3.1 Notes on Individual Objects
SDSS J000239.39+255034.8 (). This object is selected in a non-standard SDSS scan in the Southern Galactic Cap. It is outside the main survey region, and the spectroscopic follow-up of this region for -dropout candidates is not yet complete. We therefore do not include it in the luminosity function calculations below.
SDSS J0002+2550 has and , but is undetected in 2MASS (Skrutskie et al. (1997)), indicating that and . If it were an L dwarf, it would have a color of 2.5 or redder, so we targeted this object as a high-redshift quasar candidate. SDSS J1044–0125 (, Fan et al. 2000) was selected in a similar manner.
At and (-model), SDSS J0002+2550 is very luminous. It is the second brightest quasar known at so far and provides an excellent target for high resolution spectroscopic follow-up observations. The redshift of SDSS J0002+2550 is determined by the locations of the peak of the Ly emission line and of the OI 1300Å emission line, and is accurate to 0.02. The quasar has a Ly+NV emission line rest-frame equivalent width of Å, comparable to that of most high-redshift quasars (Fan et al. 2001b).
SDSS J000552.34–000655.8 (). This object is selected in the SDSS Southern Survey region. At , it is the faintest quasar in our sample. Although the discovery spectrum (Figure 2) has low S/N, the strong Ly and NV emission lines and the strong Lyman break are clearly visible. The redshift is determined by the locations of the Ly and NV emission line peaks, and is accurate to 0.02. The emission lines in this quasar appear to be quite narrow: the Ly and NV emission are clearly separated. We estimate a FWHM of about 1500 – 2500 km s-1 for individual lines, with large uncertainties due to the low S/N.
SDSS J141111.29+121737.4 (). The redshift is determined by the locations of the OI 1300Å and NV 1240Å lines and is accurate to 0.02. The object has a moderately strong Ly+NV line (rest-frame equivalent width of Å). This object is detected in two overlapping SDSS runs with consistent photometry (Table 1).
SDSS J160254.18+422822.9 (). The redshift of this object is determined by the peaks of the Ly and NV 1240Å lines and is accurate to 0.02. A weak OI 1300Å line is also detected in the spectrum. The quasar spectrum shows a number of dark patches in the Ly and Ly forest, although the S/N of the current spectrum is not sufficient to determine whether there is a short Gunn-Peterson trough in the spectrum.
Due to its proximity on the sky to the high-redshift cluster candidate CL1603, SDSS J1602+4228 serendipitously lies in a 28 ks pointed observation (sequence rp800239) made with the ROSAT Position Sensitive Proportional Counter (PSPC). We do not find any significant X-ray detection of SDSS J1602+4228 in these data. The upper limit on its observed-frame, Galactic absorption-corrected, 0.5–2 keV flux is erg cm-2 s-1, adopting a power-law model with a photon index of and the Galactic column density of cm-2. Given the magnitude of SDSS J1602+4228, comparison with Figure 2 of Vignali et al. (2003) shows that the X-ray upper limit is consistent with X-ray observations of other quasars. The slope of a nominal power law between rest-frame 2500 Å and 2 keV is constrained to be .
SDSS J162331.81+311200.5 (). This is the highest redshift quasar presented in this paper, and is the third highest redshift quasar yet known. 222SDSS J104845.05+463718.3 was reported to have a redshift of 6.23 in Fan et al. (2003). Subsequent observations show that it is a Broad Absorption Line (BAL) quasar (Maiolino et al. 2004, Fan et al. in preparation) and the original redshift determination is biased; the best redshift estimate is based on new observations. This quasar has two striking features. First, it has an extremely strong Ly emission line. The total equivalent width of Ly+NV is Å in the rest-frame, without taking into account the strong absorption due to the Ly forest on the blue side of the Ly emission. For comparison, Fan et al. (2001b) measured the mean and standard deviation of the rest-frame Ly+NV equivalent width of Å, based on a sample of quasars at selected from the SDSS (see also Schneider, Schmidt & Gunn 1991 and §4). The line strength of this quasar is more than a factor of two larger than the average at high redshift. It is one of the strongest-lined quasars at yet known, and the strongest-lined quasar at .
Second, SDSS J1623+3112 has a complete Gunn-Peterson (1965) trough. Following Becker et al. (2001), Fan et al. (2002) and White et al. (2003), we define the transmitted flux ratio as:
| (1) |
where is the continuum level extrapolated from the red side of Ly emission. Using the spectrum presented in Figure 2, we find that at , the transmitted flux ratio , consistent with zero flux in the Gunn-Peterson trough region. We also detect a complete Ly Gunn-Peterson trough in this quasar. This is the fourth quasar with a complete Gunn-Peterson trough, after SDSS J1306+0524 (, Becker et al. 2002), SDSS J1148+5251 (, White et al. 2003) and SDSS J1048+4637 (, Fan et al. 2003).
In all quasars at , complete Gunn-Peterson troughs are detected, starting from , and extending to the highest redshift not affected by the quasar proximity effect. The detection of a complete Gunn-Peterson trough in SDSS J1623+3112 further confirms the rapid transition of the ionization state of the IGM at (e.g. Becker et al. 2001, Djorgovski et al. 2001, Fan et al. 2002, White et al. 2003; see also Songaila 2004 for a different interpretation). The S/N of the spectrum of SDSS J1623+3112 is considerably lower than that of the other three quasars, therefore the optical depth limit we are able to place is not yet very strong. In a subsequent paper, we will present a detailed analysis of the constraints on the evolution of IGM properties using the five new quasars presented in this paper.
4 Quasar Composite Spectrum at
The spectral energy distributions of luminous quasars show little evolution out to high redshift. There is growing evidence from emission line ratio measurements that quasar broad emission line regions have roughly solar or even higher metallicities at (e.g., Hamann & Ferland (1993), Dietrich et al. 2003a), similar to that in low redshift quasars. Dietrich et al. (2003b) found the FeII/MgII ratio to have roughly the same value in a sample of quasars as at lower redshift, suggesting that the metallicity of quasar emission line region remains high to even earlier epochs.
The sample of twelve quasars at from the SDSS provides the first opportunity to study the evolution of quasar spectral properties at , less than 1 Gyr after the Big Bang and only 700 million years from the first star formation in the Universe (Kogut et al. 2003, Spergel et al. 2003). Optical and infrared spectroscopy of some quasars already indicates a lack of evolution in the spectral properties of these luminous quasars: Pentericci et al. (2002) show that the CIV/NV ratio in two quasars are indicative of supersolar metallicity in these systems. Freudling et al. (2003) and Barth et al. (2003) detected strong FeII emission in the spectra of four SDSS quasars. In addition, the optical-to-X-ray flux ratios and X-ray continuum shapes show at most mild evolution from low redshift (e.g. Brandt et al. 2002, Vignali et al. 2003). These results, if confirmed with a larger sample, suggest that the accretion disk and photoionization structure of quasars reached maturity very early on and are probably insensitive to the host galaxy environment.
Figure 3 shows the composite of eleven of our twelve quasar spectra. We omit SDSS J0005-0006 due to its low S/N. To produce the composite, we simply redshift all the spectra to zero, scale the continuum level of each quasar based on its magnitude, and average all the scaled spectra with equal weighting. The composite covers rest-frame wavelengths from 1100Å to 1450Å. Also plotted in Figure 3 is the low-redshift SDSS quasar composite of Vanden Berk et al. (2001). The effective redshift of the low-redshift composite in this redshift range is . Blueward of Ly emission, the strong IGM absorption at almost completely removes the quasar flux. Redward of Ly emission, there is no detectable difference in the intrinsic UV spectral properties. The continuum shape is consistent with the power law measured by Vanden Berk et al. (2001). Clearly, spectral coverage in the near-IR is needed to put stronger constraints on the continuum shape. Pentericci et al. (2003) use IR photometry of a sample of quasars at to measure a continuum shape of , independent of redshift. The strengths of the emission lines at , including NV 1240Å, OI 1300Å, CII 1335Å, and SiIV+OIV 1400Å, are also comparable to those at low redshift. This composite does not go red enough to cover the CIV 1549Å line, so we cannot test whether the Baldwin (1977) effect exists at these redshift. The strength of the red wing of the Ly emission line shows no evolution from that at low redshift. The weaker Ly emission in the blue wing is due to the strong IGM absorption. The average FWHM of emission lines is km s-1, also consistent with the low-redshift average.
5 Luminosity Function of Quasars
In Papers I and II, we estimated the comoving density of quasars at using a sample of six quasars, covering a total area of 2870 deg2. We repeat the calculation here, including the additional three quasars in the complete sample; as explained above, SDSS 0002+2550 and SDSS J0005-0006 were not selected as part of the flux-limited complete sample and will not be included in the quasar luminosity function calculation. These nine quasars form a complete sample satisfying the selection criteria in Eq. (1) over a total area of 4578 deg2. Following Papers I and II, we calculate the selection function of quasars using a Monte-Carlo simulation of quasar colors, taking into account the distribution of quasar emission line and continuum properties, Ly absorption, the SDSS photometric errors and Galactic extinction. The selection function as a function of redshift and absolute magnitude is illustrated in Figure 7 of Paper II for the -model. The total spatial density of quasars at is derived using the method. We find that at the average redshift of , Mpc-3 for the model, and Mpc-3 for the -model. The results, which are consistent with those in Paper II with smaller error bars, are plotted in Figure 4, together with the measurements at lower redshifts from the 2dF survey (Boyle et al. (2000), Croom et al. 2004) at , from Schmidt et al. (1995) at and from Fan et al. (2001a) at . The comoving density of luminous quasars at is 30 times smaller than that at .
Following Paper II, we derive the bright-end slope from the luminosity distributions of the sample using a maximum likelihood estimate. Assuming a single-power law luminosity function:
| (2) |
we find that for the -model, . The best-fit bright-end slope is , with a 68% confidence range of [–2.5, –4.0] and a 95% confidence range of [–2.2, –4.2]. This slope is steeper than that measured in Paper II, where the best-fit value was –2.3 with a 68% range of [–1.6, –3.1]. The reason for this 1- change is that all three new quasars included in the sample have , close to the detection limit. Their inclusion, when correcting for the lower completeness at the faint end, drives the best-fit luminosity function to steeper slopes. For example, the average selection probability of quasars with the redshift and luminosity of SDSS J1623+3112 is of the order 10%; the strong Ly emission boosts the -band magnitude and makes the color bluer, making the selection of this object easier than an average quasar. The best-fit slope omitting SDSS J1623+3112 is –2.8. The slopes derived here and in Paper II differ only at the 1- level. The errors are large because of the small number of objects in the sample, especially at the faint end. This underlines the need for a large sample to put strong constraints on the quasar luminosity function at the highest redshift.
The slope of the quasar luminosity function has important implications. The total quantity of ionizing photons emitted by the high-redshift quasar population is determined by the quasar luminosity function. Fan et al. (2001) found that quasars are not likely to be the sources responsible for reionizing the universe, or keeping the universe ionized at high redshift, assuming a slope of . Interestingly, we are approaching this limit with the current analysis.
In a flux-limited sample, the lensing probability of the brightest observed objects is boosted by magnification bias (e.g. Turner et al. 1984). The theoretical prediction of the fraction of strongly-lensed quasars at high redshift could be be of order unity for a sufficiently steep luminosity function (e.g. Wyithe & Loeb 2002a, Comerford, Haiman & Schaye 2002). Fan et al. (2003) and Richards et al. (2004) used the lack of multiply-imaged quasars among the SDSS quasar sample to constrain the shape of the quasar luminosity function to be at the 3- level. The lensing fraction increases by a factor of by assuming a slope of rather than (Wyithe & Loeb 2002b). The quasar emissivity and lensing fraction also depends strongly on the faint-end quasar slope, which is currently completely unknown.
In this paper, we present the first quasar discovered in the faint quasar survey using co-added catalogs from the SDSS Southern Survey region. In Fall 2003, we also started to use co-added images of the SDSS Southern Survey from SDSS observations to select candidates. This overcomes the limitation of the co-added catalog which requires the object to be detected in a single exposure. We have generated a preliminary photometric catalog using the SExtractor software; the integration of the co-added imaging into the SDSS photometric pipeline is currently underway. Using the catalogs generated by co-added imaging, we were able to recover SDSS J000552.34–000655.8. The remaining candidate identification is still in progress and will be reported in the future. In the next few years, the faint quasars selected from the Southern Survey will be combined with the bright quasars in the Main Survey region to study the evolution of quasar population at down to much fainter luminosities to probe the evolution of faint quasars.
Funding for the creation and distribution of the SDSS Archive has been provided by the Alfred P. Sloan Foundation, the Participating Institutions, the National Aeronautics and Space Administration, the National Science Foundation, the U.S. Department of Energy, the Japanese Monbukagakusho, and the Max Planck Society. The SDSS Web site is http://www.sdss.org/. The SDSS is managed by the Astrophysical Research Consortium (ARC) for the Participating Institutions. The Participating Institutions are The University of Chicago, Fermilab, the Institute for Advanced Study, the Japan Participation Group, The Johns Hopkins University, Los Alamos National Laboratory, the Max-Planck-Institute for Astronomy (MPIA), the Max-Planck-Institute for Astrophysics (MPA), New Mexico State University, University of Pittsburgh, Princeton University, the United States Naval Observatory, and the University of Washington. We thank the staffs at Apache Point Observatory, the MMT, the Bok Telescope, Kitt Peak, the Hobby-Eberly Telescope, and Magellan for their expert help. We acknowledge support from NSF grant AST 03-07384, a Sloan Research Fellowship and the University of Arizona (X.F.), NSF grants AST 00-71091 and AST 03-07409 (M.A.S.) and NSF grants AST 99-00703 and AST 03-07582 (D. P. S.).
References
- Abazajian et al. (2003) Abazajian, K., et al. 2003, AJ, 126, 2081
- Abazajian et al. (2004) Abazajian, K., et al. 2004, AJ, in press (astro-ph/0403325)
- Anderson et al. (2001) Anderson, S. F., et al. 2001, AJ, 122, 503
- Baldwin (1977) Baldwin, J. A. 1977, ApJ, 214, 679
- Barth, Martini, Nelson, & Ho (2003) Barth, A. J., Martini, P., Nelson, C. H., & Ho, L. C. 2003, ApJ, 594, L95
- Becker, White & Helfand (1995) Becker, R. H., White, R. L., & Helfand, D. J. 1995, ApJ, 450, 559
- Becker et al. (2001) Becker, R. H. et al. 2001, AJ, 122, 2850
- Boyle et al. (2000) Boyle, B.J., Shanks, T., Croom, S. M., Smith, R . J., Miller, L., Loaring, B., & Heymans, C. 2000, MNRAS, 317, 1014
- Brandt et al. (2002) Brandt, W.N., et al. 2002, ApJ, 569, L5
- Comerford, Haiman & Schaye (2002) Comerford, J., Haiman, Z., & Schaye, J. 2002, ApJ, 580, 63
- Condon et al. (1998) Condon, J. J., Cotton, W. D., Greisen, E. W., Yin, Q. F., Perley, R. A., Taylor, G. B., & Broderick, J. J., 1998, AJ, 115, 1693
- Croom et al. (2003) Croom, S. M., Smith, R. J., Boyle, B. J., Shanks, T., Miller, L., Outram, P. J., & Loaring, N. S., 2004, MNRAS, in press (astro-ph/0403040)
- (13) Dietrich, M., Appenzeller, I., Hamann, F., Heidt, J. Jaeger, J., Vestergaard, M., & Wagner, S. J., 2003a, A&A, 398, 891
- (14) Dietrich, M., Hamann, F. Shields, J. C., Constantin, A., Heidt, J., Jaeger, M., Vestergaard, M., & Wagner, S. J., 2003b, ApJ, 722, 732
- Djorgovski et al. (2001) Djorgovski, S. G., Castro, S., Stern, D., & Mahabal, A. A. 2001, ApJ, 560, L5
- Fan et al. (2000) Fan, X. et al., 2000, AJ, 120, 1167
- (17) ——, 2001a, AJ, 121, 31
- (18) ——, 2001b, AJ, 121, 54
- (19) ——, 2001c, AJ, 122, 2833
- Fan et al. (2002) ——, 2002, AJ, 123, 1247
- Fan et al. (2003) ——, 2003, AJ, 125, 1649
- Finkbeiner et al. (2004) Finkbeiner, D. et al. 2004, AJ, submitted
- Freudling, Corbin & Korista (2003) Freudling, W., Corbin, M. R., & Korista, K. T. 2003, ApJ, 587, L67
- Fukugita et al. (1996) Fukugita, M., Ichikawa, T., Gunn, J.E., Doi, M., Shimasaku, K., & Schneider, D.P. 1996, AJ, 111, 1748
- Gunn & Peterson (1965) Gunn, J. E., & Peterson, B. A. 1965, ApJ, 142, 1633
- Gunn et al. (1998) Gunn, J.E., et al. 1998, AJ, 116, 3040
- Hamann & Ferland (1993) Hamann, F., & Ferland, G., 1993, ApJ, 418, 11
- Hill et al. (1998) Hill, G. J., et al. 1998, Proc. SPIE, 3355, 433
- Hogg et al. (2001) Hogg, D., et al. 2001, AJ, 122, 2129
- Kogut et al. (2003) Kogut, A. et al. 2003, ApJS, 148, 161
- Lupton, Gunn & Szalay (1999) Lupton, R.H., Gunn, J.E., & Szalay, A. 1999, AJ, 118, 1406
- Lupton et al. (2001) Lupton, R. H., Gunn, J. E., Ivezic, Z., Knapp, G. R., Kent, S. M., & Yasuda, N., 2001, ASP Conf. Ser. 238: Astronomical Data Analysis Software and Systems X, 10, 269
- Maiolino et al. (2004) Maiolino, R., Oliva, E., Ghinassi, F., Pedani, M. Mannucci, F., Mujica, R., & Juarez, Y., 2004, A&A, submitted (astro-ph/0312402)
- Pentericci et al. (2002) Pentericci, L., et al. 2002, AJ, 123, 2151
- Pentericci et al. (2003) Pentericci, L., et al. 2003, A&A, 409, 47
- Pier et al. (2003) Pier, J. et al. 2003, AJ, 125, 1559
- Richards et al. (2002) Richards, G. T., et al. 2002, AJ, 123, 2925
- Richards et al. (2003) Richards, G. T., et al. 2004, AJ, 127, 1305
- Schlegel, Finkbeiner & Davis (1998) Schlegel, D.J, Finkbeiner, D.P., & Davis, M. 1998, ApJ, 500, 525
- Spergel et al. (2003) Spergel, D. N. et al. 2003, ApJS, 148, 175
- Schmidt et al. (1995) Schmidt, M., Schneider, D. P., & Gunn, J.E., 1995, AJ, 110, 68 (SSG)
- Schneider, Schmidt & Gunn (1991) Schneider, D. P., Schmidt, M., & Gunn, J.E. 1991, AJ, 102, 837
- Skrutskie et al. (1997) Skrutskie, M. F., et al., 1997, The Impact of Large-Scale Near-IR Sky Surveys, ed. F. Garzón, N. Epchtein, A. Omont, B,. Burton, & P. Persei (Dordrecht: Kluwer), 25
- Smith et al. (2002) Smith, J., et al. 2002, AJ, 123, 2121
- Songaila (2004) Songaila, A., 2004, AJ, in press (astro-ph/0402347)
- Stoughton et al. (2002) Stoughton, C. et al. 2002, AJ, 123, 485
- Vignali et al. (2003) Vignali, C., Brandt, W.N., Schneider, D.P., Garmire, G.P., & Kaspi, S. 2003, ApJ, 125, 2876
- Turner, Ostriker, & Gott (1984) Turner, E. L., Ostriker, J. P., & Gott, R. 1984, ApJ, 284, 1
- Vanden Berk et al. (2001) Vanden Berk, D. E., et al. 2000, AJ, 122, 549
- White et al. (2003) White, R. L., Becker, R. H., Fan, X., & Strauss, M. A., 2003, AJ, 126, 1
- (51) Wyithe, J. S. B., & Loeb, A., 2002a, Nature, 417, 923
- Wyithe & Loeb (2002b) Wyithe, J. S. B., & Loeb, A., ApJ, 577, 57
- York et al. (2000) York, D. G., et al. 2000, AJ, 120, 1579
| object | redshift | SDSS run | |||
|---|---|---|---|---|---|
| J000239.39255034.8 | 5.80 0.02 | 21.47 0.11 | 18.99 0.05 | 4152 | |
| J000552.34000655.8 | 5.85 0.02 | 23.40 0.34 | 20.54 0.10 | 19.87 0.10 | multiple |
| J141111.29121737.4 | 5.93 0.02 | 23.43 0.37 | 19.63 0.07 | 18.95 0.05 | 3836 |
| 22.85 0.30 | 19.65 0.08 | 3996 | |||
| J160254.18422822.9 | 6.07 0.02 | 22.78 0.38 | 19.89 0.10 | 18.46 0.05 | 3705 |
| J162331.81311200.5 | 6.22 0.02 | 24.52 0.62 | 20.09 0.10 | 19.15 0.10 | 3918 |
| object | redshift | |||||
|---|---|---|---|---|---|---|
| (-model) | (-model) | (Galactic) | ||||
| J000239.39255034.8 | 5.80 | 19.09 | 19.02 | –27.40 | –27.66 | 0.037 |
| J000552.34000655.8 | 5.83 | 20.30 | 20.23 | –26.21 | –26.46 | 0.033 |
| J141111.29121737.4 | 5.93 | 20.04 | 19.97 | –26.49 | –26.75 | 0.025 |
| J160254.18422822.9 | 6.07 | 19.93 | 19.86 | –26.63 | –26.82 | 0.014 |
| J162331.81311200.5 | 6.22 | 20.20 | 20.13 | –26.40 | –26.67 | 0.022 |