The XMM-Newton/2dF survey - V. the radio properties of the X-ray population
Abstract
In this paper we cross-correlate the FIRST 1.4 GHz radio survey with a wide field () shallow [] XMM-Newton survey. We find 12 X-ray/radio matches representing 4% of the X-ray selected sample. Most of them are found to be associated with AGNs (total of 9) on the basis of the observed optical spectra (3), radio morphology (2) or X-ray/optical properties (4), while one radio source is identified with an X-ray selected cluster. We also find two sources associated with low redshift galaxies with narrow emission line optical spectra, X-ray luminosity , radio luminosity density and suggesting ‘normal’ star-forming galaxies. We argue that radio surveys combined with X-ray samples could provide a powerful tool for identifying X-ray selected ‘normal’ galaxies powered by stellar processes. Finally, radio loud and quiet systems in the present sample have mean X-ray spectral properties consistent with .
keywords:
Surveys – Galaxies: active – X-rays: galaxies – X-rays: general1 Introduction
X-ray surveys are not only dominated by AGNs but are also believed to be the least biased method for selecting such systems (e.g. Brinkmann et al. 2000). The evidence above has motivated a number of studies aiming to compile X-ray selected (and thus least biased) AGN samples to understand the large variations in their observational properties and to test unification schemes. At radio wavelengths in particular large programs have been initiated by cross-correlating wide area radio surveys with archival X-ray data aiming to understand the radio loud/quiet AGN dichotomy (Brinkmann et al. 1997; Caccianiga et al. 1999; Brinkmann et al. 2000).
For example Brinkmann et al. (2000) cross-correlated the FIRST radio survey (Faint Images of the Radio Sky at Twenty centimeters; Becker et al. 1995) with the ROSAT All Sky Survey (RASS-II; Voges et al. 1999) at a 0.1-2.4 keV flux limit of . About 1/3 of the X-ray sources are identified with radio counterparts. The above fraction of X-ray/radio associations is higher than that found in previous soft X-ray selected samples (Stocke et al. 1991; Zamorani et al. 1999; Ciliegi et al. 1995; see Ciliegi et al. 2003 for a summary), most likely due to the relative X-ray and radio limits of the RASS-II and the FIRST surveys. Follow-up optical spectroscopy of the X-ray/radio matches shows that the majority of these sources are AGNs spanning both the radio loud and the radio quiet regime. These data indicate that there is no sharp boundary between radio loud and radio quiet AGNs but rather a smooth transition. A highly significant X-ray–radio luminosity correlation for these sources is also reported. Apart from AGNs the sample of Brinkmann et al. (2000) also comprises a small fraction () of ‘normal’ galaxies likely to be starbursts.
At fainter X-ray flux limits () Bauer et al. (2002) investigated the radio properties of the X-ray sources using data from the 1 Ms Chandra Deep Field North (CDF-N) combined with Jy sensitivity VLA observations. They find that of the X-ray selected AGNs have radio counterparts to the limit of the VLA data (0.05 mJy). They also argue that the radio emission, at least in the sub-sample of harder (i.e. obscured) AGNs, is likely to be associated with circumnuclear star-formation activity. Contrary to AGNs the largest overlap between X-ray and radio sources () is for the sub-sample of narrow emission line galaxies likely to be star-forming systems. The evidence above suggests the emergence of ‘normal’ and starburst galaxies at faint X-ray fluxes.
In addition to soft X-ray selected samples a number of hard X-ray surveys have been followed by radio observations yielding X-ray/radio matched samples with identification rates (e.g. Ciliegi et al. 2003; Akiyama et al. 2000; Barger et al. 2001; Georgakakis et al. 2004b). Ciliegi et al. (2003) argue that this is likely due to observational effects (e.g. deeper radio data) and the fact that both the radio wavelengths and the hard X-ray energies () are least biased to obscuration effects.
The studies above mainly concentrate on either very bright () or extremely faint () X-ray sources. In the present study we explore the radio properties of the X-ray population in the intermediate X-ray flux range (). We cross correlate the FIRST radio survey with a wide area () shallow [] XMM-Newton survey near the North Galactic Pole region (XMM-Newton/2dF survey111http://www.astro.noa.gr/xray/).
2 Observations
2.1 X-ray data
The X-ray sample used in the present study is compiled from the XMM-Newton/2dF survey. This is a wide area () shallow [; ] survey carried out by the XMM-Newton near the North and the South Galactic Pole regions. The data reduction, source extraction, flux estimation and catalogue generation are described in detail by Georgakakis et al. (2003a, Paper I; 2004a, Paper II). In the present study we concentrate on the North Galactic Pole F864 subregion of the XMM-Newton/2dF survey covering an area of . This is because of the wealth of follow-up observations (optical photometry and spectroscopy, radio) available for these fields. The X-ray sample comprises a total of 291 sources detected in the 0.5-8 keV spectral band above the threshold. We note that about 10% of the surveyed area is covered at the flux . This fraction increases to about 50% at .
2.2 Radio data
The radio data are from the FIRST (Faint Images of the Sky at Twenty centimeters) radio survey (Becker et al. 1995; White et al. 1997). The observations are carried out at 1.4 GHz using the NRAO Very Large Array (VLA) in the B-configuration. The limiting flux density is with a source detection limit of . The catalogue is estimated to be 95 and 80% complete at 2 and 1 mJy respectively (Becker et al. 1995). The positional accuracy of the detected sources is better than arcsec facilitating their optical identification.
The radio data used in the present study are from the April 11, 2003 version of the FIRST VLA catalogue. A total of 78 radio sources overlap with the XMM-Newton pointings of the F864 region.
2.3 Optical photometric and spectroscopic data
The XMM-Newton/2dF survey F864 region overlaps with the Sloan Digital Sky Survey (York et al. 2000). The SDSS is an on-going imaging and spectroscopic survey that aims to cover about of the sky. Photometry is performed in 5 bands (; Fukugita et al. 1996; Stoughton et al. 2002) to the limiting magnitude mag, providing a uniform and homogeneous multi-color photometric catalogue. The SDSS spectroscopic observations will obtain spectra for over 1 million objects, including galaxies brighter than mag, luminous red galaxies to and colour selected QSOs (York et al. 2000; Stoughton et al. 2002). In the present study we use data from the Early Data Release (EDR; Stoughton et al. 2002).
In addition to the SDSS the F864 region overlaps with the recently completed 2dF Galaxy Redshift Survey (2dFGRS222http://msowww.anu.edu.au/2dFGRS/; Colless et al. 2001; Colless et al. 2003) and the 2dF QSO Redshift Survey (2QZ333http://www.2dfquasar.org; Croom et al. 2001). Both the 2dFGRS and 2QZ are large-scale spectroscopic campaigns that fully exploit the capabilities of the 2dF multi-fibre spectrograph on the 4 m Anglo-Australian Telescope (AAT). These projects provide high quality spectra, redshifts and spectral classifications for 220 000 mag galaxies and 23 000 optically selected mag QSOs.
| ID | NAME | Classa | ||||||||
| (J2000) | (J2000) | (arcsec) | (arcsec) | (%) | (mag) | (mJy) | ||||
| 1b | FIRST J134304.6–000055 | 13 43 04.61 | –00 00 55.35 | 3.3 | 0.9 | 0.27 | 21.97 | 28.26 | – | DOUBLE |
| 2 | FIRST J134233.0–001553 | 13 42 33.04 | –00 15 53.24 | 3.6 | 2.9 | 0.44 | 19.98 | 0.73 | BL | |
| 3 | FIRST J134212.2–001737 | 13 42 12.21 | –00 17 37.82 | 4.3 | 0.1 | 17.18 | 1.50 | EA | ||
| 4 | FIRST J134347.5+002024 | 13 43 47.47 | +00 20 24.22 | 2.9 | 0.5 | 0.01 | 19.55 | 3.13 | AB | |
| 5 | FIRST J134414.2+001642 | 13 44 14.18 | +00 16 42.31 | 1.1 | 0.4 | 0.01 | 19.67 | 95.96 | – | DOUBLE |
| 6 | FIRST J134232.4–003151 | 13 42 32.38 | –00 31 51.10 | 0.4 | 0.1 | 18.98 | 1.55 | BL | ||
| 7 | FIRST J134133.4–002432 | 13 41 33.36 | –00 24 32.26 | 2.8 | 0.3 | 17.08 | 2.98 | NL | ||
| 8 | FIRST J134137.7–002555 | 13 41 37.68 | –00 25 55.02 | 2.7 | 0.3 | 16.56 | 2.37 | NL | ||
| 9 | FIRST J134412.9–003006 | 13 44 12.89 | –00 30 05.51 | 2.5 | 0.1 | 20.55 | 8.03 | BL | ||
| 10 | FIRST J134431.8–002832 | 13 44 31.77 | –00 28 31.48 | 2.9 | 0.6 | 0.50 | 23.80 | 1.43 | – | – |
| 11 | FIRST J134128.4–003120 | 13 41 28.36 | –00 31 20.21 | 0.2 | 0.4 | 0.04 | 21.55 | 0.81 | – | – |
| 12 | FIRST J134447.0–003009 | 13 44 46.97 | –00 30 09.29 | 0.7 | 0.7 | 0.22 | 22.30 | 50.46 | – | DOUBLE |
| aAB: absorption lines; NL: Narrow emission lines; BL: Broad optical emission lines; EA: absorption+emission lines | ||||||||||
| DOUBLE: double lobe morphology | ||||||||||
| bthis double lobe radio sources is associated with an X-ray cluster. | ||||||||||
| 1: XMM-Newton/2dF spectroscopic program; 2: 2dFGRS; 3: 2QZ; 4: SDSS; 5: Terlevich et al. (1991) | ||||||||||
| ID | net counts | |||||
| (0.5-8.0 keV) | () | () | () | () | ||
| 1 | 45 | – | – | |||
| 2 | 24 | |||||
| 3 | 21 | |||||
| 4a | 141 | |||||
| 5b | 766 | – | – | |||
| 6 | 93 | |||||
| 7 | 22 | |||||
| 8 | 30 | |||||
| 9 | 77 | |||||
| 10 | 31 | – | – | |||
| 11 | 110 | – | – | |||
| 12 | 32 | – | – | |||
| aX-ray flux and X-ray spectral properties are estimated from the MOS | ||||||
| bX-ray spectral fitting used statistic with both and free parameters | ||||||
3 X-ray – radio correlation
In the present study we use a total of 291 XMM-Newton/2dF survey sources with detection significance in the 0.5-8 keV band. The limiting flux of these observations in the 0.5-8 keV band is .
The FIRST and the XMM-Newton/2dF source catalogues are cross correlated using an initial matching radius of 10 arcsec. This is to include in our sample well separated double lobe radio sources that may be missed if a smaller radius is employed. The candidate identifications were then visually inspected rejecting single component sources (i.e. not double lobes) that lie more than 7 arcsec from an X-ray detection. The final sample comprises a total of 12 X-ray sources with radio counterparts. Given the surface density of the FIRST survey (; Becker et al. 1995) and the XMM-Newton/2dF sources we estimate about 0.3 spurious identifications for the above sample within the 7 arcsec radius. We note that increasing the initial matching radius to 40 arcsec does not include any additional sources in the sample.
The SDSS is used to optically identify these sources by estimating the probability a given candidate is chance coincidence (Downes et al. 1986). The more accurate radio positions are used for the optical identifications. Of the 12 X-ray/radio matches we propose 10 candidate optical identifications. Optical images of these sources are shown in Figure 1. The optical spectrum of source #4 (see Table 1) is plotted in Figure 2. The optical spectra of the remaining sources are either presented in Paper II or can be found in the 2QZ, 2dFGRS and SDSS archives.
The X-ray/radio matched sample is presented in Table 1 which has the following format:
1. source identification number.
2. Name of the FIRST radio source closest to the X-ray source.
3-4. Right ascension () and declination () of the radio source position in J2000. In the case of double lobes we list the position of the centroid.
5. Offset in arcseconds between the X-ray source centroid estimated by the ewavelet task of sas and the radio source centre. We note that the X-ray source centroid does not always coincide with the peak of the X-ray emission.
6. Offset in arcseconds between the radio source position and the optical source centre.
7. Probability, , the optical identification or a radio source is a chance coincidence.
8. Optical -band magnitude.
9. 1.4 GHz radio flux density.
10. Redshift. The source from which the redshift estimate was obtained is also listed in Table 1.
11. Classification on the basis of the observed optical spectral features or radio morphology: AB: absorption lines only, NL: narrow emission lines, EA: both absorption and emission lines, BL: broad emission lines and DOUBLE: for radio sources with double lobes. We note that source #1 has double lobe morphology and is associated with an X-ray selected cluster.
To explore the X-ray spectral properties of the X-ray/radio matched population we use the C-statistic technique (Cash et al. 1979) as implemented in xspec v11.2. This method has been developed to extract information from X-ray spectra with small number of counts. The data are grouped to have a minimum of one count per bin but using higher binning factors does not modify the results. Assuming an absorbed power law model we attempt to constrain the fixing the power law index to . Only two of the sources presented here (sources #11 and #12) show evidence for enhanced absorbing columns . The remaining sources have X-ray spectral properties consistent with Galactic absorption (). The results are shown in column 5 of Table 2. We also attempt to constrain the power law index keeping the column density fixed to the Galactic value. The results are also presented in Table 2. With the exception of sources #11 and #12 the present sample has steep X-ray spectra. Source #5 in Tables 1 and 2 has sufficient counts that allow standard spectral analysis. This source is also fit by an absorbed power law model with both the column density, , and the X-ray spectral index, , free parameters.
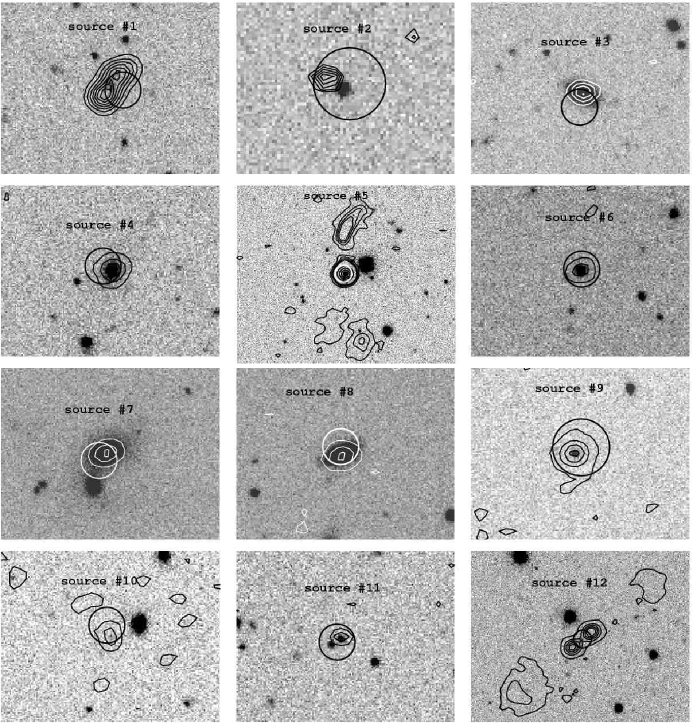

Table 2 presents the X-ray properties of the present sample. We list:
1. source identification number.
2. 0.5-8 keV net source counts.
3. 0.5-8 keV X-ray flux in .
4. 0.5-8 keV X-ray luminosity in , if a redshift is available.
5. 1.4 GHz radio luminosity density in , if a redshift is available.
6. column density estimated by the C-statistic for a fixed power law index . The only exception is source #5 which is fit by an absorbed power law using statistics.
7. power law spectral index estimated by the C-statistic for a fixed column density . Source #5 is fit using statistics.
The sources in Tables 1 and 2 span both the radio loud (#1, 4, 5, 9, 10, 11, 12) and the radio quiet (#2, 3, 6, 7, 8) regime with the radio-loudness parameter defined as in Stocke et al. (1991; see Figure 5 below). In Table 2 both radio quiet and loud systems have X-ray spectral index consistent on average with . Coadding the X-ray spectra of radio loud and quiet sources separately yields and respectively. Although radio loud sources are flatter the spectral indices above are consistent within the 90% confidence level.
Figure 3 plots -band magnitude against 0.5-8 keV X-ray flux for both X-ray sources with radio counterparts and the whole X-ray selected sample. The lines in this figure delineate the region of the parameter space occupied by AGNs. X-ray sources with radio emission span a wide range of X-ray–to–optical flux ratios. Although many X-ray/radio matches lie in the AGN region of the parameter space, a small number of sources have suggesting relatively optically luminous obscured AGN and Low Luminosity AGNs (LLAGN; Lehmann et al. 2001) or ‘normal’ galaxies.
The lines of constant X-ray–to–optical flux ratio in Figure 3 are estimated from the 0.5-8 keV flux, , and the -band magnitude according to the relation
| (1) |
The equation above is derived from the X-ray–to–optical flux ratio definition of Stocke et al. (1991) that involved 0.3-3.5 keV flux and -band magnitude. These quantities are converted to 0.5-8 keV flux and -band magnitude assuming a mean colour using the colour transformations of Fukugita et al. (1996) and a power law X-ray spectral energy distribution with .
Figure 4 plots total band X-ray luminosity against radio luminosity density for those sources in the present sample with available redshift information. Both and are k-corrected assuming a power law spectral energy distribution with and respectively. Also shown is the best fit relation for local star-forming galaxies derived by Ranalli, Comastri & Setti (2003). Two of our sample sources (#7 and #8) have and lie close to the Ranalli et al. (2003) relation suggesting they are likely to be dominated by star-formation. These same sources also have low X-ray–to–optical flux ratios in Figure 3 () which is additional evidence for star-formation activity in these systems. The optical spectra for these two sources are presented in Paper II. The remaining sources in Figure 4 either deviate from the relation of local star-forming systems (suggesting the presence of AGN) or have X-ray luminosities well in excess of typical starburst galaxies (; Moran, Lehnert & Helfand 1999).
We also find a double lobe radio source (#1) associated with diffuse X-ray cluster emission. As discussed in Appendix A this cluster is likely to lie at . Powerful radio galaxies are known to be good tracers of dense environments with Fanaroff-Rilley I type sources (FRI) associated with rich groups or clusters and Fanaroff-Rilley II type sources (FRII) avoiding rich clusters at low- (e.g. Zirbel 1997 and references therein). Recently, Zanichelli et al. (2001) used NVSS data to compile an intermediate redshift () cluster sample based on radio selection. Follow-up optical photometry and spectroscopy confirmed that a significant fraction of their targeted cluster candidates are real, demonstrating the strength of radio selection in cluster studies. Our X-ray/radio matched sample comprises a total of 3 double lobe radio sources (#1, #5 and #12) of which only one (#1) is clearly associated with X-ray cluster emission. The remaining two lie in either poor or high- clusters/groups that remain undetected in both the X-ray and the optical data. Indeed, as discussed in Appendix A we do not find evidence for optical galaxy overdensity in the vicinity of sources #5 and #12, at least to the optical magnitude limit of the SDSS.
Sources with absorption line optical spectra and high X-ray luminosities (), similar to those found in the present sample (#3, 4 in Table 1) , have also been identified in previous X-ray surveys (e.g. Griffiths et al. 1995; Blair, Georgantopoulos & Stewart 1997; Allen, Di Matteo & Fabian 2000; Comastri et al. 2002; Brusa et al. 2003). Possible scenarios for the observed X-ray emission in these optically normal (e.g. no emission lines) systems include (i) BL-Lac type activity (e.g. Blair et al. 1997), (ii) Advection Dominated Accretion Flows (ADAF; Narayan & Yi 1995; Di Matteo et al. 2000), (iii) diffuse cluster of group X-ray emission and (iv) LLAGN with its optical signature diluted by the host galaxy light (e.g. Moran, Filippenko & Chornock 2002; Severgnini et al. 2003).
For sources #3, 4 we can exclude the possibility of X-ray cluster emission. The X-ray sources associated with these two galaxies are not extended. Also, no optical galaxy overdensity is found in the vicinity of the two sources (Basilakos et al. 2004, Paper III; Goto et al. 2002). The evidence above is against the cluster emission scenario although the presence of hot gas associated with a group (that remains undetected in both the X-ray and the optical data) cannot be ruled out. Below we argue that source #3 is likely to be associated with an ADAF or a LLAGN, while source #4 is a BL-Lac candidate.
We explore the nature of these sources using their two-point spectral indices, optical–to–X-ray () and radio–to–optical () defined by Stocke et al. (1991):
| (2) |
| (3) |
where , and are the monochromatic fluxes at 2 keV, 5 GHz and respectively. The is estimated from the 1.4 GHz flux density assuming a power law spectral energy distribution of the form with . The X-ray flux density at 2 keV is estimated from the 0.5-8 keV flux assuming a mean photon spectral index . The monochromatic optical flux at 2500 Å, , is estimated from the SDSS -band magnitudes assuming an optical power law spectral slope (Brinkmann et al. 2000). The flux densities are not k-corrected but this effect is small and does not modify the estimated monochromatic flux ratios.
The results are shown in Figure 5 plotting against . Also shown are the regions of the parameter space occupied by different classes of objects as defined by Stocke et al. (1991; see their Figure 6b). The absorption line galaxy in our sample (#4) has and consistent with those of BL-Lacs. This coupled with the soft X-ray spectral properties of this system and the absorption line optical spectrum strongly support the BL-Lac scenario. Fossati et al. (1998) showed that the peak frequency of the BL-Lac SED is a function of the radio luminosity of these objects: less luminous systems peak at UV and soft X-ray wavelengths (High energy peak BL-Lacs), while more luminous radio sources have a peak at the infrared regime (Low energy peak BL-Lacs). Source #4 at has a radio luminosity at 5 GHz of suggesting that this is a High energy peak BL-Lac (see Figure 7a of Fossati et al. 1998). The estimated radio luminosity is also consistent with the steep X-ray spectral index of this source in Table 2 (see Figure 11 of Fossati et al. 1998). We also note that absorption line systems with properties similar to those of source #4 have been identified in previous X-ray surveys with available radio observations (Gunn et al. 2003; Brusa et al. 2003).
Three sources in Figure 5 lie close to the ‘normal’ galaxy region of the Stocke et al. (1991) classification scheme. Two of these sources are the ‘normal’ galaxy candidates showing narrow emission line optical spectra. The third source is #3 in Tables 1 and 2 exhibiting both narrow emission and absorption optical lines. The evidence above combined with the fact that this system deviates from the Ranalli et al. (2003) relation in Figure 4 suggest an ADAF or a LLAGN.
Broad optical emission line systems and double lobe sources in Figure 5 occupy the radio loud and the radio quiet AGN space. We note that the one double lobe source associated with the X-ray cluster is not plotted here since its X-ray emission is not due to the central AGN. One of the two spectroscopically unclassified sources (#11) in the present sample has and consistent with those of BL-Lacs. This is inconsistent however, with the relatively hard X-ray spectral properties of this source in Table 2 suggesting for . The second spectroscopically unclassified source (#10) lies in the border line between radio loud QSOs and BL-Lacs.


A detailed description of individual sources is presented in Appendix A. The classification of the present sample into different classes is performed on the basis of their optical spectroscopic (i.e. spectral features), photometric (i.e. resolved or point-like sources) and X-ray properties (i.e. X-ray luminosity, X-ray–to–optical flux ratio, X-ray spectral properties). More information about the source classification can be found in Appendix A. The present sample of X-ray/radio matches comprises: (i) 3 broad emission line AGNs (#2, 6, 9), (ii) 2 sources with double lobe radio morphology also indicating AGN activity (#5, 12), (iii) 1 double lobe source (#1) associated with X-ray cluster emission, (iv) 2 systems with optical spectra dominated by the host galaxy (i.e. absorption and/or narrow emission lines) and X-ray/optical properties suggesting AGN activity (#3, 4), (v) 2 ‘normal’ galaxy candidates exhibiting narrow emission line optical spectra (#7, 8) and (vi) 2 unclassified sources with no optical spectroscopic information (#10, 11). The X-ray/optical properties of this latter class of sources suggests AGN activity. We also note that although the X-ray and optical properties of ‘normal’ galaxy candidates are consistent with stellar origin for the X-ray emission we cannot exclude the possibility of heavily obscured AGN or LLAGN. Summarising the classification above, 9 out of the 12 X-ray/radio matches are associated with AGN activity on the basis of the broad optical emission lines (total of 3), radio morphology (2) or X-ray/optical properties (4). One radio source is associated with X-ray cluster emission with the remaining two sources being ‘normal’ galaxy candidates.
4 Discussion
Brinkmann et al. (2000) cross-correlated the FIRST radio survey with the RASS-II catalogue with a 0.1–2.4 keV limiting flux of . These authors found that of the RASS-II sources have radio counterparts to the limit of the FIRST survey. In the present survey probing X-ray fluxes about 1 dex fainter than the RASS-II we find that 12 out of 291 X-ray sources () have radio counterparts. This fraction is much lower than that of the RASS-II () suggesting that a significant fraction of the X-ray sources have radio emission below the FIRST flux density limit. Ciliegi et al. (2003) suggest that the fraction of the X-ray/radio matches strongly depends on the relative depths of the X-ray and the radio data. They quantify this effect using the ratio of the X-ray–to–radio flux density limits of different surveys, . For the XMM-Newton/2dF survey we estimate (assuming ) which is 1 dex higher than that of for the Brinkmann et al. (2000) sample. Ciliegi et al. (2003) also provide a comparison of the X-ray/radio identification rate of various surveys spanning a range of X-ray and radio limits (see their Table 2). The XMM-Newton/2dF survey has the lowest fraction of X-ray/radio matched sources in this table (4%) and the highest ratio, while the FIRST/RASS-II sample of Brinkmann et al. (2000) is comparable with other soft X-ray selected surveys with similar ratios (e.g. Stocke et al. 1991).
In addition to soft X-ray samples a number of studies have explored the radio properties of hard sources finding much higher X-ray/radio identification rates than those in softer X-ray surveys (Barger et al. 2001; Ciliegi et al. 2003). This is attributed to both observational effects (e.g. deeper radio data) and the insensitivity of both the radio and the hard X-ray wavelengths to obscured AGNs (e.g. Ciliegi et al. 2003). Moreover, hard X-ray selected AGNs with radio counterparts have harder X-ray spectra (i.e. more absorbed) than non-radio detected AGNs (e.g. Bauer et al. 2002; Georgakakis et al. 2004b). It has been suggested that this may be due to the presence of circumnuclear starbursts in radio detected AGNs that both feed and obscure the central black hole (e.g. Bauer et al. 2002). Only two sources in the present sample (#11, 12) show evidence for absorption with the remaining having soft X-ray spectral properties consistent with little or no photoelectric obscuration. These two sources are also detected in the hard X-ray spectral band (2-8 keV) above the detection threshold (Georgantopoulos et al. 2004, Paper IV).
Brinkmann et al. (2000) also present follow up spectroscopic observations for about half of their X-ray/radio matched population. They find that (324/454) of the sources are AGNs, (99/454) are early type galaxies with absorption line spectra, (23/454) are classified starbursts and (8/454) are clusters. We note that the class of absorption line galaxies in the Brinkmann et al. (2000) sample is likely to be contaminated by AGNs that do not reveal their presence in the optical spectrum (Severgnini et al. 2003).
In our sample about (9/12) of the X-ray/radio matches are AGNs on the basis of their optical spectra, radio morphology or X-ray/optical properties. Starforming ‘normal’ galaxy candidates represent (2/12) of the X-ray/radio poulation while we find 1 radio source associated with cluster X-ray emission. We find a larger fraction of starforming galaxy candidates than Brinkmann et al. (2000) that can be interpreted as tenuous evidence for increasing fraction of ‘normal’ galaxies with decreasing X-ray flux. One should be cautious however, since the estimated fractions above are clearly affected by small number statistics that do not allow firm conclusions to be drawn.
‘Normal’ galaxy candidates have only recently been reliably identified in X-ray surveys suggesting that their number density increases with decreasing X-ray flux (Bauers et al. 2002; Hornschemeier et al. 2003; Kim et al. 2004; Paper II). On the contrary, radio selection below 10 mJy has long been known to be an efficient tool for identifying starburst galaxies albeit with some AGN contamination (Georgakakis et al. 1999; Magliocchetti et al. 2002; Chapman et al. 2003). Starforming systems appear in increasing numbers with decreasing flux density below 10 mJy and are believed to dominate the sub-mJy radio source counts (Hopkins et al. 1998; 2003). The two ‘normal’ galaxy candidates found in the present study by cross-correlating the X-ray and radio samples have also been identified in Paper II on the basis of both their low and their optical spectral properties. Therefore, radio selection to the limit of the FIRST survey has identified all the X-ray selected ‘normal’ galaxy candidates in our XMM-Newton/2dF survey. Although the statistics are poor the evidence above suggests that radio selection can potentially single out ‘normal’ starforming galaxies within X-ray samples.
Magliocchetti et al. (2002) studied the nature of the optically bright ( mag) FIRST radio sources using optical spectra from the 2dFGRS. They find that as much as 32% of their spectroscopic sample are star-forming systems with the rest being early type galaxies or Seyfert 1 and 2 type systems. The majority of star-forming galaxies are found at relatively low redshifts, .
From the 72 FIRST radio sources overlapping with the XMM-Newton/2dF survey (see section 2.2), a total of 18 have optical counterparts on the SDSS brighter than mag (i.e. similar to mag). On the basis of the Magliocchetti et al. (2002) study from the above 18 radio sources brighter than mag we expect about 6 star-forming galaxies. This number can be compared with the two X-ray selected “normal” galaxy candidates identified both in the present study and in Paper II. Although the statistics are poor the analysis above suggests that to the limit of the XMM-Newton/2dF survey we have only identified a sub-sample of the total population of radio selected starforming galaxies (to the limit mag).
It is an interesting exercise to quantify the flux limits that radio and X-ray surveys should have to detect the same population of starforming galaxies. We use the relation of local star-forming galaxies derived by Ranalli et al. (2003) to establish the relation between X-ray flux, , and radio flux density, . Since the Ranalli et al. (2003) relation is linear one can factor the distance out to obtain an relation for starforming galaxies. This simple transformation however, ignores the k-correction. The effect of the differential X-ray/radio k-correction is nevertheless small compared to the rms scatter of the Ranalli et al. (2003) relation. The derived relation for star-forming galaxies is compared in Figure 6 with the limits of various X-ray/radio surveys including the XMM-Newton/2dF survey. The region of the parameter space (e.g. X-ray/radio flux range) accessible by these surveys is also marked in this figure. We conclude that our X-ray survey is too shallow to detect the radio selected star-forming population to the limit of the FIRST survey. An order of magnitude improvement in sensitivity at X-ray wavelengths is essential for such a study. Nevertheless, Figure 6 suggests that combining X-ray and radio surveys with carefully selected limiting fluxes is a powerful tool for identifying star-forming galaxies. In particular, this figure shows that the CDF-N has X-ray/radio flux limits that allow a large fraction of the radio/X-ray selected star-forming galaxy population to be identified at both wavelengths. Indeed, Bauer et al. (2002) investigated the association between faint X-ray and radio source populations detected in the 1 Ms CDF-N. They found that the majority of X-ray sources with narrow emission-line spectra also have Jy radio counterparts and are likely to be dominated by star-formation activity.

5 Conclusions
In this paper we explore the nature of the X-ray sources with radio counterparts by cross-correlating the FIRST 1.4 GHz radio survey with a wide field () shallow [] XMM-Newton survey. Our sample comprises 12 X-ray/radio matches representing about 4% of the X-ray selected sample. The majority of these sources (9/12) have properties suggesting AGN activity. Two sources in the sample have narrow emission line optical spectra, X-ray luminosities , radio powers and X-ray–to–optical flux ratios suggesting ‘normal’ galaxies powered by star-formation activity. Finally we find 1 double radio source associated with X-ray cluster emission. Both radio loud and quiet systems in the present sample have mean X-ray spectral properties consistent with .
We also argue that radio selection to the limit of the FIRST survey has identified all the X-ray selected ‘normal’ galaxy candidates in our XMM-Newton/2dF survey. Although small number statistics hamper a secure interpretation the evidence above suggests that radio selection can potentially single out ‘normal’ starforming galaxies within X-ray samples. Using the relation for local starforming galaxies we quantify the flux limits that X-ray and radio surveys should have to identify the same population of starbursts.
6 Acknowledgments
We thank the anonymous referee for useful comments and suggestions that improved this paper. This work is jointly funded by the European Union and the Greek Government in the framework of the programme “Promotion of Excellence in Technological Development and Research”, project “X-ray Astrophysics with ESA’s mission XMM”. The XMM-Newton/2dF survey data as well as part of the observations presented here are electronically available at http://www.astro.noa.gr/xray/.
We acknowledge use of the 100k data release of the 2dF Galaxy Redshift Survey. The 2dF QSO Redshift Survey (2QZ) was compiled by the 2QZ survey team from observations made with the 2-degree Field on the Anglo-Australian Telescope.
Funding for the creation and distribution of the SDSS Archive has been provided by the Alfred P. Sloan Foundation, the Participating Institutions, the National Aeronautics and Space Administration, the National Science Foundation, the U.S. Department of Energy, the Japanese Monbukagakusho, and the Max Planck Society. The SDSS Web site is http://www.sdss.org/. The SDSS is managed by the Astrophysical Research Consortium (ARC) for the Participating Institutions. The Participating Institutions are The University of Chicago, Fermilab, the Institute for Advanced Study, the Japan Participation Group, The Johns Hopkins University, Los Alamos National Laboratory, the Max-Planck-Institute for Astronomy (MPIA), the Max-Planck-Institute for Astrophysics (MPA), New Mexico State University, University of Pittsburgh, Princeton University, the United States Naval Observatory, and the University of Washington.
Appendix A Notes on individual sources
FIRST J134304.6–000055: this double lobe radio source has optical counterpart lying arcsec from the radio centroid. Although optical spectroscopy is not available for this source the radio morphology indicates AGN activity. The X-ray source likely to be associated with FIRST J134304.6–000055 lies 3 arcsec from the radio centroid. The X-ray emission is extended suggesting hot gas cluster emission. Indeed, Couch et al. (1991) used photographic material to identify an optical galaxy overdensity in the vicinity of the X-ray source. Follow-up spectroscopy of selected galaxies in this field by these authors suggests a cluster redshift of . In Paper III we use CCD photometry to identify a statistically significant optical galaxy overdensity in the vicinity of the X-ray source. Using photometric methods (e.g. Postman et al. 1996) these authors estimate a redshift for this cluster candidate.
FIRST J134233.0–001553: the radio centroid lies arcsec off the X-ray position and arcsec from the optical counterpart. Optical spectroscopy shows that this source is associated with a broad emission line QSO at a redshift .
FIRST J134212.2–001737: the radio position coincides with that of a mag galaxy at . The X-ray centroid is offset from both the optical and radio source positions by 4 arcsec. This may suggest that the X-ray source may not be associated with either the optical galaxy or the radio source. Keeping this caveat in mind in what follows we assume that both the radio and the X-ray emission originate from the optical galaxy at . The 2dFGRS optical spectrum of this systems suggest an early type spiral with both emission (, , ) and absorption (H+K, , , , ) lines. The X-ray–to–optical flux ratio of and the X-ray luminosity, , suggest either AGN or X-ray properties dominated by stellar processes. In Figure 4 this systems deviates from the mean of local star-forming galaxies favoring the AGN scenario for the observed X-ray emission. This source also lies close to the ‘normal’ galaxy region of the diagram in Figure 5. The C-statistic X-ray spectral analysis suggests soft X-ray spectral properties consistent with Galactic column density absorption. This source is also discussed in Paper II (their source TGN 336Z232). We classify this source LLAGN or ADAF.
FIRST J134347.5+002024: the X-ray and radio positions coincide within 3 arcsec. The optical counterpart is likely to be a mag galaxy at a redshift . The optical spectrum of this systems does not show emission lines suggesting an early type galaxy. The X-ray–to–optical flux ratio of and the X-ray luminosity, , suggest AGN activity. The two point spectral indices of this source, and , are consistent with those of BL-Lacs. This coupled with the soft X-ray spectral properties of this system and the absorption line optical spectrum strongly support the BL-Lac scenario.
FIRST J134414.2+001642: this radio source has double lobe radio morphology indicating AGN activity. The X-ray source likely to be associated with FIRST J134414.2+001642 lies 1 arcsec from the radio centroid. The optical counterpart has mag and no optical spectroscopic information. The X-ray–to–optical flux ratio of is consistent with AGN activity. Our X-ray spectral analysis suggests soft X-ray spectrum.
FIRST J134232.4–003151: the X-ray and radio positions overlap within less than 1 arcsec. The radio source is associated with a mag QSO at . The X-ray–to–optical flux ratio of and the X-ray luminosity are also consistent with AGN activity. This is the only source that has enough photons allowing detailed X-ray spectral analysis. The X-ray spectrum is best fit by a power law spectrum with and photoelectric extinction consistent with the Galactic value.
FIRST J134133.4–002432: the radio source lies 3 arcsec off the X-ray position. The most probable optical counterpart of both the X-ray and radio sources is a mag galaxy. The X-ray centroid is offset by 3 arcsec from the optical centre of the galaxy. This is a narrow emission line system at showing doublet, and . Although the signal–to–noise ratio of the spectrum is low, is not visible in emission. This coupled with the strong feature may suggest a Seyfert 2 type system. Moreover, the low X-ray luminosity and X-ray–to–optical flux ratio are consistent with a ‘normal’ galaxy powered by stellar processes. In Figure 4 this system lies close to the mean of local star-forming galaxies favoring the star-formation as a probable source of the observed X-ray emission.
FIRST J134137.7–002555: The X-ray and radio positions coincide within 3 arcsec. The most probable optical counterpart of both the X-ray and radio sources is a mag galaxy at . This narrow emission line galaxy is classified as H II on the basis of its optical spectral properties (Terlevich et al. 1991). Its X-ray luminosity and X-ray–to–optical flux ratio also suggest ‘normal’ galaxy. Our X-ray spectral analysis also suggests soft X-ray properties. In Figure 4 this system lies close to the mean of local star-forming galaxies also favoring the star-formation scenario for the X-ray emission.
FIRST J134412.9–003006: the X-ray and radio positions coincide within 3 arcsec. The most probable optical counterpart for both the X-ray and the radio source is a mag broad line AGN at . Its X-ray luminosity and X-ray–to–optical flux ratio also consistent with AGN activity. The C-statistic suggests consistent with the Galactic column density.
FIRST J134431.8–002832: the radio source lies 3 arcsec off the X-ray position. The most probable optical counterpart is a mag galaxy. No optical spectroscopic information is available for this source. The X-ray–to–optical flux ratio of suggests AGN activity. The X-ray spectrum is very steep for . In the diagram this source lies in the borderline between radio loud AGNs and BL-Lacs.
FIRST J134128.4–003120: the radio source lies 3 arcsec off the X-ray centroid. The most probable optical counterpart is a mag galaxy. Although no optical spectroscopic information is available for this system the X-ray–to–optical flux ratio of suggest AGN activity. This source lies in the BL-Lac region of the parameter space. The C-statistic suggests hard X-ray spectral properties with photoelectric absorption () which is inconistent with a BL-Lac.
FIRST J134447.0–003009: The X-ray and radio positions coincide within less than arcsec. The radio source has double lobes indicating the presence of an AGN. The optical counterpart has mag and no optical spectral information are available. The X-ray–to–optical flux ratio of also suggest AGN activity. The C-statistic suggests hard X-ray spectral properties with photoelectric absorption ().
References
- [1]
- [2] Akiyama M., et al., 2001, ApJ, 532, 700
- [3]
- [4] Allen S. W., Di Matteo T., Fabian A. C., 2000, MNRAS, 311, 493
- [5]
- [6] Basilakos S., Plionis M., Georgakakis A., Georgantopoulos I, Kolokotronis V., Gaga D., Stewart G. C., 2004, MNRAS, in press astro-ph/0310136, Paper III.
- [7]
- [8] Barger A. J., Cowie L. L., Mushotzky R. F., Richards E. A., 2001, AJ, 121, 662
- [9]
- [10] Barger A. J., Cowie L. L., Brandt W. N., Capak P., Garmire G. P., Hornschemeier A. E., Steffen A. T., Wehner E. H., 2002, AJ, 124, 1839.
- [11]
- [12] Bauer F. E., Alexander D. M., Brandt W. N., Hornschemeier A. E., Vignali C., Garmire G. P., Schneider D. P., 2002, AJ, 124, 2351
- [13]
- [14] Becker R. H., White R. L., Helfand D. J., 1995, ApJ, 450, 559
- [15]
- [16] Blair A. J., Georgantopoulos I., Stewart G. C., 1997, MNRAS, 289, 921
- [17]
- [18] Brandt W. N., 2001, AJ, 122, 2810.
- [19]
- [20] Brinkmann W., Laurent-Muehleisen S. A., Voges W., Siebert J., Becker R. H., Brotherton M. S., White R. L., Gregg M. D, 2000, A&A, 356, 445
- [21]
- [22] Brinkmann W., et al., 1997, A&A, 323, 739
- [23]
- [24] Brusa M., et al., 2003, A&A, 409, 65
- [25]
- [26] Caccianiga A., Maccacaro T., Wolter A., della Ceca R., Gioia I. M., 1999, ApJ, 513, 51
- [27]
- [28] Cash W., 1979, ApJ, 228, 939
- [29]
- [30] Chapman S. C., et al., 2003, ApJ, 585, 57.
- [31]
- [32] Ciliegi P., Elvis M., Wilkes B. J., Boyle B. J., McMahon R. G., Macacaro T., 1995, MNRAS, 277, 1463
- [33]
- [34] Ciliegi P., Vignali C., Comastri A., Fiore F., La Franca F., Perola G. C., 2003, MNRAS, 342, 575
- [35]
- [36] Croom S. M., Smith R. J., Boyle B. J., Shanks T., Loaring N. S., Miller L., Lewis I. J., 2001, MNRAS, 322L, 29
- [37]
- [38] Goto T., 2002, AJ, 123, 1807
- [39]
- [40] Colless M., Dalton G., Maddox S. et al., 2001, MNRAS, 328, 1039.
- [41]
- [42] Colless M., et al. 2003, astro-ph/0306581
- [43]
- [44] Comastri A., et al. 2002, ApJ, 571, 771.
- [45]
- [46] Di Matteo T., Quataert E., Allen S. W., Narayan R., Fabian A. C., 2000, MNRAS, 311, 507
- [47]
- [48] Downes A. J. B., Peacock J. A., Savage A., Carrie D. R., 1986, MNRAS, 218, 31
- [49]
- [50] Fossati G., Maraschi L., Celotti A., Comastri A., Ghisellini G., 1998, MNRAS, 299, 433
- [51]
- [52] Fukugita M., Ichikawa T., Gunn J. E., Doi M., Shimasaku K., Schneider D. P., 1996, AJ, 111, 1748
- [53]
- [54] Georgakakis A, Mobasher B, Cram L., Hopkins A., Lidman C., Rowan-Robinson M., 1999, MNRAS, 306, 708.
- [55]
- [56] Georgakakis A, Georgantopoulos I., Stewart G. C., Shanks T., Boyle B. J., 2003a, MNRAS, 344, 161 (Paper I)
- [57]
- [58] Georgakakis A., Hopkins A. M., Sullivan M., Afonso J., Georgantopoulos I., Mobasher B., Cram L. E., 2003b, MNRAS, 345, 939
- [59]
- [60] Georgakakis A., Georgantopoulos I, Kolokotronis V., Basilakos S., Plionis M., Stewart G. C., Shanks T., Boyle B. J., 2004a, MNRAS, 349, 135 (Paper II).
- [61]
- [62] Georgakakis A., Hopkins A. M., Afonso J., Sullivan M., Mobasher B., Cram L. E., 2004b, MNRAS, submitted
- [63]
- [64] Georgantopoulos I., Georgakakis A., Akylas A., Stewart G. C., Giannakis O., Shanks T., Kitsionas S., 2004, MNRAS, in press, astro-ph/0404048, Paper IV
- [65]
- [66] Griffiths R. E., Georgantopoulos I., Boyle B. J., Stewart G. C., Shanks T., Della Ceca R., 1995, MNRAS, 275, 77.
- [67]
- [68] Hopkins A. M., Afonso J., Chan B., Cram L. E., Georgakakis A., Mobasher B., 2003, AJ, 125, 465
- [69]
- [70] Hopkins A. M., Mobasher B., Cram L., Rowan-Robinson M., 1998, MNRAS, 296, 839H
- [71]
- [72] Hornschemeier A. E., 2003, AJ, 126, 575
- [73]
- [74] Kim D.-W., et al., 2004, ApJ, 600, 59
- [75]
- [76] Lehmann I., et al., 2001, A&A, 371, 833.
- [77]
- [78] Magliocchetti M., et al., 2002, MNRAS, 333, 100
- [79]
- [80] Moran E., Filippenko A. V., Chornock R., 2002, ApJ, 579L, 71
- [81]
- [82] Moran E. C., Lehnert M. D., Helfand D. J., 1999, ApJ, 526, 649
- [83]
- [84] Mushotzky R. F., Cowie L. L., Barger A. J., Arnaud K. A., 2000, Nature 404, 459.
- [85]
- [86] Narayan R., Yi I., 1995, ApJ, 452, 710
- [87]
- [88] Ranalli P., Comastri A., Setti G., 2003, A&A, 399, 39.
- [89]
- [90] Severgnini P., et al., 2003, A&A, 406, 483
- [91]
- [92] Stocke J. T., Morris S. L., Gioia I. M., Maccacaro T., Schild R., Wolter A., Fleming T. A., Henry J. P., 1991, ApJS, 76, 813
- [93]
- [94] Stoughton C., et al., 2002, AJ, 123, 485.
- [95]
- [96] Strüder L., Briel U., Dennerl K., et al. 2001, A&A, 365, L18.
- [97]
- [98] Terlevich R., Melnick J., Masegosa J., Moles M., Copetti M. V. F., 1991, A&AS, 91, 285
- [99]
- [100] Turner M. J. L., Abbey A., Arnaud M., et al., 2001, A&A, 365, L27.
- [101]
- [102] York D. G., et al., 2000, AJ, 120, 1579.
- [103]
- [104] Voges W., et al., 1999, A&A, 349, 389
- [105]
- [106] Zamorani G., et al., 1999, A&A, 346, 731
- [107]
- [108] Zanichelli A., Scaramella R., Vettolani G., Vigotti M., Bardelli S., Zamorani G., 2001, A&A, 379, 35
- [109]
- [110] Zirbel E. L., 1997, ApJ, 476, 489
- [111]