Confronting the Superbubble Model with X-ray Observations of 30 Dor C
Abstract
We present an analysis of XMM-Newton observations of the superbubble 30 Dor C and compare the results with the predictions from the standard wind-blown bubble model. We find that the observed X-ray spectra cannot be fitted satisfactorily with the model alone and that there is evidence for nonthermal X-ray emission, which is particularly important at keV. The combination of the bubble model and a power-law gives a reasonable fit to the observed spectra. The thermal pressure and central temperature of the bubble are dyne cm-2 and K, respectively, and we infer that, for a bubble age of years, the ambient density is cm-3, the mechanical luminosity is erg s-1, and the coefficient of thermal conductivity is of the Spitzer value. The total unabsorbed – keV luminosities of the eastern and western parts of the bubble are erg s-1 and erg s-1, respectively. The unabsorbed – keV luminosity of the bubble model is erg s-1 and so the power-law component contributes between and to the total unabsorbed luminosity in this energy band. The nature of the hard nonthermal emission is not clear, although recent supernovae in the bubble may be responsible. We expect that about one or two core-collapse supernovae could have occured and are required to explain the enrichment of the hot gas, as evidenced by the overabundance of -elements by a factor of , compared to the mean value of solar for the interstellar medium in the Large Magellanic Cloud. As in previous studies of various superbubbles, the amount of energy currently present in 30 Dor C is significantly less than the expected energy input from the enclosed massive stars over their lifetime. We speculate that a substantial fraction of the input energy may be radiated in far-infrared by dust grains, which are mixed with the hot gas because of the thermal conduction and/or dynamic mixing.
1 INTRODUCTION
The fast winds from massive stars and their subsequent supernovae (SNe) ejecta dominate the mass and energy input to the interstellar medium (ISM; e.g., Abbott 1982) and so may regulate star formation and galaxy evolution. Most massive stars form in OB associations, and the concentrated energy input from massive stars in OB associations sweeps up the ambient ISM to form expanding shells called superbubbles (e.g., McCray & Snow 1979). The physical structure of a superbubble is very similar to that of a bubble blown by the stellar wind of an isolated massive star (Mac Low & McCray, 1988). However, theories of such bubbles are still very uncertain and have not had much serious appraisal with observations of high quality.
Studies of Galactic superbubbles are difficult because of their large angular sizes and the confusion of objects in the line of sight. The Large Magellanic Cloud (LMC), in contrast, provides an excellent laboratory to study superbubbles since it is nearby (at a distance of kpc, as adopted here, pc; Eastman & Kirshner 1989) and almost face-on (inclined by to the line of sight; van der Marel & Cioni 2001). It also has little foreground (; Xu et al. 1992) or internal extinction ( in the range from to ; Bessel 1991). The superbubble 30 Dor C (= DEM L 263; Davies, Elliott, & Meaburn 1976) is southwest of the main 30 Doradus complex in the LMC, and is coincident with the large OB association LH 90 (= NGC 2044; Lucke & Hodge 1970). This OB association consists of a number of stellar clusters and is particularly rich in Wolf-Rayet (W-R) stars (Lortet & Testor, 1984). The most massive stars appear to have ages in the range from to Myr (Testor, Schild, & Lortet 1993). In X-ray imaging observations, 30 Dor C appears almost as a complete shell with a diameter of (Wang & Helfand 1991; Dennerl et al. 2001; Dunne, Points, & Chu 2001). The X-ray shell is confined within the H-emitting filaments (see Fig. 1l of Dunne et al. 2001), as expected from the evaporation of cool gas into the hot interior of a superbubble. There is also an indication for a substantial nonthermal contribution in addition to an assumed one-temperature thermal component, particularly in the western part of shell (Bamba et al., 2003, 2004). The radio emission from 30 Dor C may be due to a combination of synchrotron-emitting relativistic electrons produced by shocks within the superbubble and thermal emission from the H-emitting shell (Mathewson et al., 1985).
In this paper, we report on a spatially resolved spectroscopic analysis with XMM-Newton of the diffuse X-ray emission emanating from 30 Dor C. We specifically use the wind-blown bubble model of Weaver et al. (1977; see also Mac Low & McCray 1988) to infer the temperature and density structure of the X-ray emitting gas, which in turn are used to estimate both the density of the ambient medium and the rate at which energy is injected into the ISM by the stellar winds.
2 OBSERVATIONS AND DATA REDUCTION
The region surrounding 30 Dor C is known to be rich in X-ray sources and was chosen as the first light image for XMM-Newton (Jansen et al., 2001). However, data acquired this early in the mission are in a format which cannot be processed by the Science Survey Center using the standard software and so are not included in the XMM-Newton archive at the time of writing. The data reported here were instead acquired during and ks observations of SN 1987A and PSR J0537-6909 with XMM-Newton on 2000 November 25-26 (observation ID 0104660301; PI: Watson) and 2001 November 19-20 (observation ID 0113020201; PI: Aschenbach), respectively. These observations had a low background count rate and were pointed (0104660301) and (0113020201) offset from the center of the 30 Dor C. While there are other observations that covered 30 Dor C in the XMM-Newton archive, these observations are either severely contaminated by background flares (observational ID 0083250101) or had a very short good exposure time (e.g., ks for observation 0104660101; PI: Watson). The EPIC MOS cameras (Turner et al., 2001) were operated in the full-frame mode with the medium filter inserted. Over the time interval between the two observations, the energy resolution of MOS CCDs had worsened, from eV to eV (FWHM) at keV, due to radiation damage. These values are actually worse than the initial post-launch value of eV. The on-axis telescope point spread function is (FWHM) at 1.5 keV and the field-of-view is roughly circular with a diameter of . Unfortunately, the EPIC pn exposure of the first observation was taken with the calibration lamps switched on, so rendering the data useless for scientific analysis, and the pn was operated in the timing mode during the second observation, so providing no imaging data.
The data reduction and analysis were done using the XMM-Newton Science Analysis Software (SAS) version 5.4.1 (released on 2003 January 16). The MOS data were reprocessed into calibrated event list files using the SAS program emchain. The procedure of Read & Ponman (2003) was used to filter each event list for periods of high background. We created lightcurves in the 10–15 keV energy range, where no source counts are expected due to the very low effective area of the X-ray telescope, and using only single pixel events and flag values as defined by #XMMEA_EM. Periods when the count rate in these lightcurves exceeded counts s-1 were excluded from the event files. The event lists were then filtered further, keeping only single, double, triple, and quadruple pixel events in the – keV energy range. For the first observation, the total good exposure time was ks, and for the second observation, the MOS1 and MOS2 CCDs had total good exposure times of ks and ks, respectively. We also checked for soft proton flares in the – keV band, but found none.
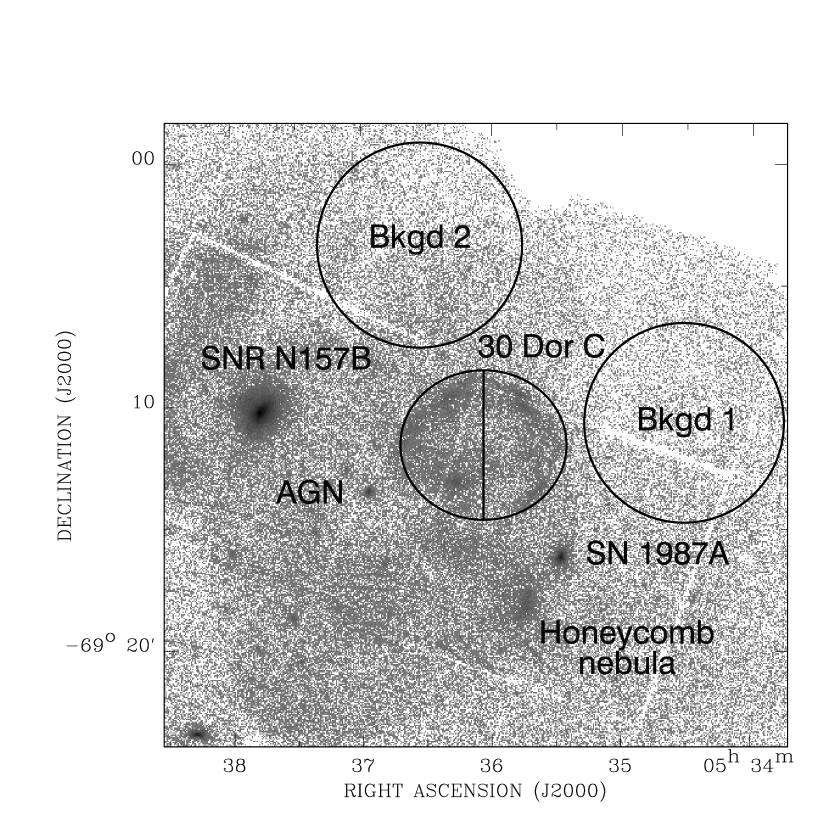
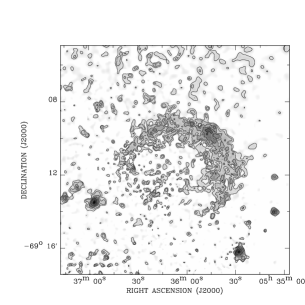
The interstellar extinction () towards the western part of 30 Dor C is known to be higher by at least than that towards the eastern part (Testor et al. 1993; see also Dunne et al. 2001 and Fig. 5 of Dennerl et al. 2001). We therefore extracted spectra from two sectors of an ellipse centered on 30 Dor C with major-axis diameter of ( pc) and major-to-minor axis ratio of . The regions are marked in Figure 1, which is an image of the central region of the 30 Dor C field (see § 3.1 for a description of X-ray sources in this image). The shape and size of the extraction regions were chosen to include as much of the diffuse emission from the superbubble as possible, while minimizing the contribution from the background.
The background was estimated from source free regions near the superbubble (Fig. 1). There are spatial variations in the detector background rate, which can be estimated from a comparison of blank-field spectra in the source and source free regions of the 30 Dor C observations. For this comparison, we have used blank-field observations with a total exposure of ks and ks for the MOS1 and MOS2 detectors, respectively (Read & Ponman, 2003). These data, taken with the same instrument mode and filter combination as the 30 Dor C observations, had point sources of emission excised, and were reprojected on the sky to match the positions of the 30 Dor C observations.
We find that for the first observation, the MOS1 blank-field spectra in the source free region and in the eastern part of 30 Dor C are statistically consistent (within deviation) with each other in the – keV band, with (497 dof). However, for the same observation, a comparison of the MOS2 blank-field spectra in the source free region and in the eastern part of 30 Dor C revealed significant differences in the background count rate near the energy of the Si K ( keV) fluorescence line. We therefore compared the MOS2 blank-field spectra in the – and – keV band, and find that the spectra are consistent with each other, with (466 dof). There are also, for the first observation, and near the energies of the Al K (1.5 keV) and the Si K fluorescence lines, significant differences in the background count rate between the blank-field spectra in the source free region and the blank-field spectra in the western part of 30 Dor C. In the – and – keV band, however, the blank-field spectra in the source free region are statistically consistent with the blank-field spectra in the western part of 30 Dor C, with (449 dof) and (430 dof) for the MOS1 and MOS2 detectors, respectively.
Similarly, for the second observation, and near the energy of the Si K fluorescence line, we find that there are significant differences in the background count rate near between the blank-field spectra in the source free region and the blank-field spectra in the eastern part of 30 Dor C. In the – and – keV band, however, the blank-field spectra are consistent with each other, with (464 dof) and (476 dof) for the MOS1 and MOS2 detectors, respectively. There are also, for the same observation, and near the energies of the Al K and Si K fluorescence lines, significant differences in the background count rate between the blank-field spectra in the source free region and the blank-field spectra in the western part of 30 Dor C. We therefore compared the blank-field spectra in the – and – keV band, and find that the MOS1 and MOS2 blank-field spectra in the source free region should be scaled by and , respectively, in order to match the blank-field spectra in the western part of 30 Dor C. The rescaled spectra are statistically consistent with the blank-field spectra in the western part of 30 Dor C, with (478 dof) and (468 dof) for the MOS1 and MOS2 detectors, respectively.
We therefore excluded data in the – keV band from the MOS2 spectra of the diffuse emission in the eastern part of 30 Dor C and data in the – keV band from the spectra of the diffuse emission in the western part of 30 Dor C. For the second observation, we also excluded data in the – from the MOS1 spectrum of the diffuse emission in the eastern part of 30 Dor C.
We created spectral redistribution matrices and ancilliary response files for the source spectra using the SAS programs rmfgen and arfgen, respectively. The ancilliary response file appropriate for each source spectrum was created weighting the position-dependent quantum efficiency and effective area by the number of – keV blank-field background subtracted counts in the corresponding region. Prior to performing the spectral analysis with XSPEC version 11.2.0au (Arnaud, 1996), we rebinned the data so that the background subtracted signal-to-noise ratio in each bin is greater than . When performing the spectral analysis, we excluded data with energies greater than keV, since the background dominates the total emission from 30 Dor C at energies greater than this. We also excluded data with energies less than keV, because of the uncertainties in the calibration of the instruments.
3 ANALYSIS AND RESULTS
3.1 Morphological Properties
Figure 1 shows the XMM-Newton image of the () region centered on 30 Dor C in the – keV band. In this image, 30 Dor C is a roughly elliptical feature with major axis ( pc). This feature appears to be the observational manifestation of a bubble blown in the ISM by the winds from massive stars in the bubble’s interior (Mac Low & McCray, 1988). Other sources of X-ray emission in Figure 1 include SN 1987A, which is located southwest of the bubble center and close to a region of diffuse X-ray emission associated with the Honeycomb nebula (Meaburn et al., 1993; Chu et al., 1995b). There is also a compact X-ray source, J0536.9-6913, to the east of 30 Dor C, which has a radio counterpart and is probably a background AGN (Haberl et al., 2001). The bright source at the left of the image is the Crab-like supernova remnant N157B (Wang & Gotthelf, 1998).
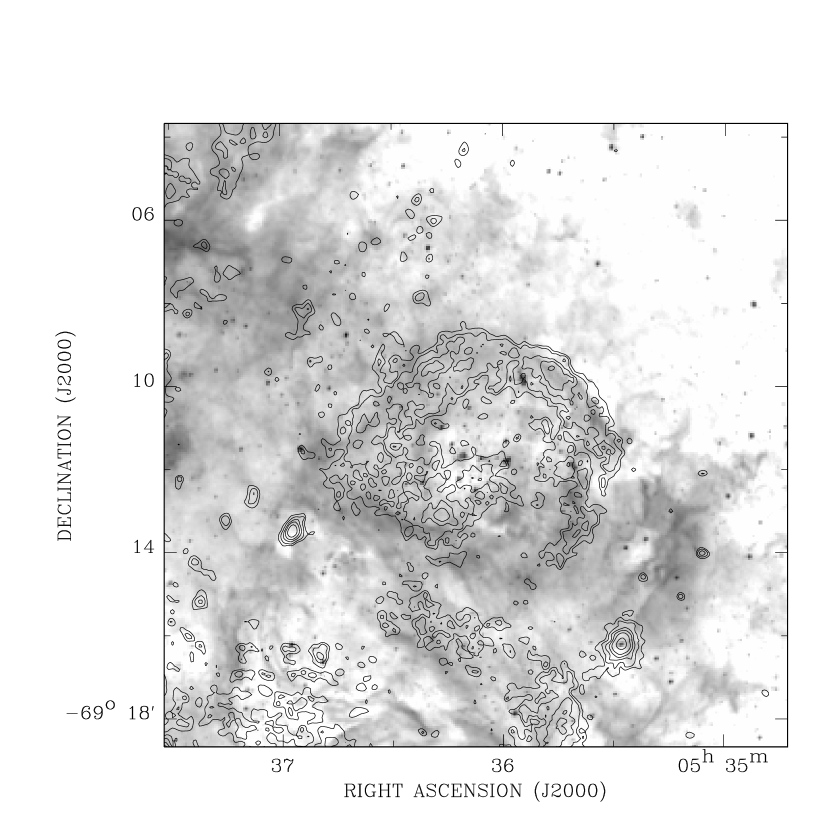
In Figure 2, we compare an H emission-line image from University of Michigan/CTIO Magellanic Cloud Emission-line Survey (MCELS; Smith et al. 1998) to an adaptively smoothed image of the inner region of the 30 Dor C field in the – keV band. The edge-brightened X-ray emission is presumably due to an increase in gas density around the edge of the bubble, and is spatially enclosed by the H-emitting filaments. It is conceivable that the increase in gas density is due to the evaporation of cool ( K) gas into the hot interior from the surrounding H-emitting shell (Weaver et al., 1977).
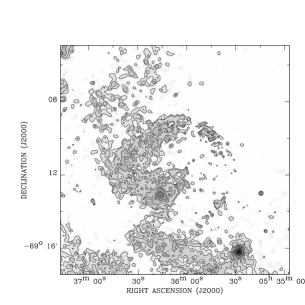
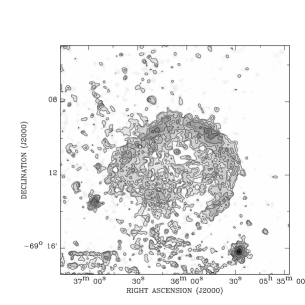
We also show adaptively smoothed images of the central region of the 30 Dor C field in the soft (– keV), medium (– keV), and hard (– keV) bands (Fig. 3). In these images, there is evidence for spectral variations in the X-ray emission across the face of the bubble. While the western part of the bubble is easily seen in the medium and hard band images, it is almost invisible in the soft band image, clearly due to the X-ray absorption by foreground cool gas (see also Dennerl et al. 2001 and Dunne et al. 2001). There is a region of localized CO emission projected onto the western part of 30 Dor C (Johansson et al., 1998). Assuming a 12CO(1-0) intensity of K km s-1 for the cloud (see Table 3 of Johansson et al. 1998) and a CO to conversion factor of for the LMC (Israel, 1997), we estimate an column density of towards the western part of 30 Dor C. This absorption column density is sufficient to absorb the soft X-ray emission from the western part of bubble. Intriguingly, in the hard band image, the western part of the bubble appears much brighter than the eastern part, and is presumably more luminous.
Finally, we note that J0536.9-6913 is almost invisible in the soft band image, due to either absorption by gas in the LMC or absorption intrinsic to the source. This source also went undetected in the PSPC observations reported by Dunne et al. (2001), which would require either an increase in the absorption column density towards the source or a decrease in the intensity of the source.
3.2 Implementation of the Wind-Blown Bubble Spectral Model
In earlier studies of 30 Dor C with Einstein and ROSAT, the X-ray luminosity expected from the stellar wind-blown bubble model of Weaver et al. (1977) was often compared with that derived from spectral fits to the data using a single temperature thermal plasma model (e.g., Dunne et al. 2001). The main disadvantage of this approach is that the data are not directly compared to the model and so any test of the model will depend on the measurements used to derive the expected X-ray luminosity of the bubble (e.g., the number density and expansion velocity of the H ii region). Also, the wide range of gas temperatures inside the bubble gives rise to soft X-ray emission in excess of that expected from a single temperature plasma model and emission lines from a wider range of ionization states than those expected from a single temperature thermal plasma model, which will naturally result in an underestimate of the heavy element abundances. The shortfall in the soft X-ray emission below keV from the single temperature thermal plasma model can also lead to an underestimate of the absorption column density, and hence the soft X-ray luminosity. In a more sophisticated analysis of 30 Dor C with the Einstein data, Wang & Helfand (1991) compared the IPC spectrum with that expected from integrating the model over the bubble interior and folding the result through the IPC response. However, with the limited quality of the IPC data, they were unable to constrain tightly the basic spectral parameters such as temperature and absorption column density, let alone to test other interesting parameters such as the efficiency of thermal conduction and metal abundance of the X-ray emitting gas. In a more recent analysis of the Chandra and XMM-Newton data, Bamba et al. (2003, 2004) discovered nonthermal X-ray emission from 30 Dor C, although the discovery was made using a single temperature, non-equilibrium, ionized plasma model to describe the thermal emission from the bubble.
Here we have compared the X-ray spectra of 30 Dor C directly with the stellar wind-blown bubble model of Weaver et al. (1977; see also Mac Low & McCray 1988) by implementing it into the spectral analysis package XSPEC. The X-ray emission in their model arises primarily from a region of thermally evaporated material (see Fig. 3 of Weaver et al. 1977). The temperature and density of the hot gas as a function of radius within this region can be approximated as and , respectively, where and are the corresponding central values, and is the outer radius of the bubble. The X-ray flux, , expected from the bubble is
| (1) |
where is the mean emissivity of the hot gas in the X-rays and is the distance to the source.
We have calculated the X-ray spectrum with a multi-temperature, variable heavy element abundance MEKAL (Mewe, Kaastra, & Liedahl 1995) model, as implemented in XSPEC, using
| (2) |
for the differential emission measure , which is a function of temperature. is the normalization of the spectrum in XSPEC. In this form, the model spectrum can be applied approximately to a slightly aspherical bubble of an equivalent volume .
3.3 Spectral Analysis
The MOS1 and MOS2 spectra of the diffuse emission in the eastern and western parts of 30 Dor C (a total of 8 spectra) were simultaneously fitted to the above wind-blown bubble model and a foreground absorption of a column density of . The absorption cross-sections and atomic abundances were taken from Morrison & McCammon (1983) and Anders & Grevesse (1989), respectively. While the foreground absorption was allowed to be different between the eastern and western parts of 30 Dor C, we constrained the bubble model to have the same temperature, metal abundance, and intensity in the eastern and western parts of 30 Dor C. This model, which has 5 free parameters, gives a poor, simultaneous fit to the MOS1 and MOS2 data with (349 dof). We also did not obtain a significant improvement in the fit when we allowed the normalization of the bubble model to be different between the MOS1 and MOS2 datasets.
An inspection of the spectra indicates that much of the deviation from the best-fit bubble model is due to an excess of hard X-rays in the spectra of the diffuse emission, particularly in the western part of 30 Dor C. Such an hard X-ray excess can naturally be explained as nonthermal X-ray emission, which can typically be described by a power-law. We therefore added a power-law component of photon index to our model fits. The normalization of the power-law continuum was allowed to vary between the eastern and western parts of 30 Dor C, to account for the spatial variation in the hard X-ray emission (Fig 3). In our initial modeling of the data, the metal abundance was poorly constrained, with a lower limit of solar and an upper limit of several times solar. We therefore fixed the metal abundance at the known mean value of solar for the ISM in the LMC (Russell & Dopita, 1992). In comparison to the bubble model, this model (model B+P) gives a much improved, although still statistically unacceptable, simultaneous fit to the MOS1 and MOS2 data with ( dof; Table 1, column 2). The absorbed – keV flux in the western and eastern parts of 30 Dor C are and erg s-1 cm-2, respectively. These fluxes are slightly larger than the fluxes reported in Bamba et al. (2003) for their regions 1–4, due to the differences in the sizes of the regions used for extracting spectra between the present work and Bamba et al. (2003). We note that a marginal (at greater than % confidence — a result) improvement in the fit is obtained when we allowed the normalization of the bubble model to be different between the eastern and western parts of 30 Dor C.
The spectra of the diffuse X-ray emission in wind-blown bubbles have often been fitted to single temperature plasma models in collisional ionization equilibrium (e.g., Dunne et al. 2001), although with little physical justification. In order to compare with these earlier observations and analyses, we have replaced the bubble model with a single temperature MEKAL model. We have also fixed the metal abundance of the MEKAL at solar, since it is poorly constrained by the data. This model (model M+P) gives a similar quality fit to the data as the B+P model, with ( dof; Table 1, column 3). The best-fit equivalent hydrogen column densities and normalizations of the power-law continua are comparable to the values obtained from the fitting the data to the B+P model, and the best-fit temperature of the MEKAL is consistent with the value reported in Bamba et al. (2003) for the thermal emission in their region 1.
We have also considered the possibility that the hard X-ray excess in 30 Dor C is attributable to a second thermal component that might be caused by a recent supernova explosion, for example. We replaced the power-law component in the above M+P model with a second MEKAL model, with the metal abundances of the two MEKALs fixed at the same value of solar and the normalization of the high-temperature MEKAL allowed to vary between the eastern and western parts of 30 Dor C. We find that this model provides a much worse fit to the data than do either the B+P or M+P models, with ( dof). This is due to the data at high energies being much too flat compared to the model. Although a significant (at greater than % confidence) improvement in the fit is obtained when we allowed the metal abundances of the two MEKALs to vary together, this model, with one extra free parameter, still provides a worse fit to the data than do either the B+P or M+P models, with ( dof). Moreover, the metal abundance of solar is uncomfortably small for the ISM in the LMC. More sophisticated models, such as the non-equilibrium, ionized (NEI) plasma codes as implemented in XSPEC (see e.g., Borkowski, Lyerly, & Reynolds 2001 for a detailed critique of these models), also gave poorer fits to the data than do either the B+P or M+P models. We therefore conclude that the hard X-ray excess in 30 Dor C is best described by a nonthermal emission component.
Because 30 Dor C is a massive star forming region with possible recent core-collapse supernovae occurring inside the bubble, we have further examined the data for an over-abundance of the -process elements compared to Fe-like elements. We did this by dividing the elements into two groups: the -process elements O, Ne, Mg, Si, S, Ar, and Ca; and the remaining Fe-like elements C, N, Na, Al, Fe, and Ni. Elements in each group were constrained to have the same abundance relative to solar. The abundances of He and the Fe-like elements were fixed at the solar and solar values, respectively, which are appropriate for the ISM in the LMC (Russell & Dopita, 1992). This model (model vB+P) further improves the fit to the MOS1 and MOS2 data with ( dof; Table 1, column 3). For clarity, we show the co-added MOS spectra from the eastern and western parts of the bubble, together with the residuals to this model fit (Fig. 4). There are some large residuals around the energies of the Al K fluorescence line that arises from the detector housing and the Au M-edge that arises from X-ray absorption in the telescope mirror surface. With the possible exception of Si, the -process elemental abundance of solar (errors here and elsewhere in this paper are 90% confidence for one interesting parameter, ) is higher than that of the ISM in the LMC (Russell & Dopita, 1992). There is no improvement (at greater than 90% confidence) in the fit when we allow the abundance of the Fe-like elements to vary.
Although the model spectrum can still be rejected statistically at % confidence, we consider the fit to be reasonably good. The model is certainly still an over-simplification. For example, we have assumed that the normalization of the soft bubble component is the same for both the eastern and western parts of 30 Dor C. This assumption is problematic, however, since the power-law components of the two parts are very different. Because of the heavy absorption, the data below keV does not allow us to independently constrain the bubble component in the western part of 30 Dor C. Dividing the data into the two parts (east and west) is an oversimplification; in general, the transition from east to west must be gradual and so the parameters inferred from our model should be considered as averaged values within the divided regions. We have also not included any systematic error in the data due to uncertainties in the calibration, background subtraction, and modeling, which are difficult to quantify at present. We therefore decided not to add more complications (such as varying abundances of individual elements) into the model.
4 PHYSICAL PROPERTIES
The morphology of the diffuse X-ray emission in 30 Dor C is consistent with that expected from the evaporation of cool gas into the hot interior of a bubble created in the ISM by the winds of massive stars. The close confinement of the limb-brightened X-ray emission by the outer H-emitting shell indicates that the bubble is roughly spherical. Otherwise, the bubble has to be elongated almost exactly along the line of sight. We have therefore interpreted the X-ray emission in terms of the stellar wind-blown bubble model of Weaver et al. (1977).
Assuming that the above wind-blown bubble model provides a reasonable characterization of 30 Dor C, the physical properties of the enclosed hot gas can be inferred from the spectral parameters obtained above. We have adopted a notation similar to Shull & Saken (1995), where is the age of the superbubble in Myrs, is the ambient density of the ISM in cm-3, is the equivalent mechanical power injected into the superbubble in units of erg s-1, and is the ratio of the coefficient of thermal conduction to the classical Spitzer value ( erg s-1 K-1 cm-1). The respective central temperature and density of the hot gas are and , assuming a superbubble radius (Shull & Saken 1995; see also Mac Low & McCray 1988). We can rearrange the above equations for , , and to give
| (3) |
| (4) |
and
| (5) |
The parameters on the right side of equations (3)–(5) can be inferred from either the spectral fits with the bubble model ( and ) or other independent measurements ( and ). The central temperature and normalization of the best-fit bubble model (model vB+P) are and , respectively. This value of gives a central density of and a mean emission measure of cm-6 pc, assuming the bubble to be a prolate spheroid of dimension . Adopting a mean radius of for the bubble, which is the radius of the sphere that has the same volume as the prolate spheroidal bubble, gives an ambient density of , a mechanical luminosity of , and a coefficient of thermal conduction of of the Spitzer value. The mass of gas that has been swept up is then , where is the mass per particle, is the mass of a hydrogen atom, and is the mass of the Sun. Following Shull & Saken (1995), we also estimate the mass of X-ray emitting gas at temperatures K as . Finally, the thermal and kinetic energy of the superbubble are and respectively, and the thermal pressure of the hot gas is . From the total energy, we infer that one or two core-collapse supernovae could have occurred within the superbubble, since each supernova supplies roughly erg (e.g., Woosley & Weaver 1986). W-R stars are the most probable core-collapse supernovae progenitors in LH 90, and we may expect these stars to have a mass distribution similar to that of the W-R stars in the Galaxy, i.e., masses in the range from to (e.g., Cherepashchuk 1991). Stars with masses in the range from to are expected to undergo nuclear fusion of the -elements and yield between and of oxygen (Woosley & Weaver, 1995; Thielemann et al., 1996). From the best-fit -process elemental abundance of solar, we infer an oxygen/hydrogen mass ratio of for the X-ray emitting gas in the bubble. The ISM in the LMC has an -process elemental abundance of solar or an oxygen/hydrogen mass ratio of . Thus, the bubble must have been enriched by of oxygen, assuming that percent of the mass of the X-ray emitting gas is hydrogen. At least 2–3 high () mass, core-collapse supernovae are needed to explain the oxygen abundance in the bubble, and the total energy supplied exceeds the value inferred from the spectral fits.
5 CHECKING THE PHYSICAL PARAMETERS WITH MULTIWAVELENGTH DATA
To make our results a bit more quantitative, we need to know the age of the bubble, which is still uncertain. Following Chu et al. (1995a), we use the observed expansion velocity of km s-1 (Dunne et al., 2001), where in units of pc, to derive a bubble age of years. This value of is probably a lower limit to the true age of the bubble since the expansion is only detected in parts of the bubble (Y.-H. Chu 2004, private communication). The energy input from the OB association also tends to increase with time (Shull & Saken, 1995). The ages of the most massive stars in the OB association give an age of – Myr (Testor et al., 1993), although there are subclusters that are older (up to Myr). This kind of progressive star formation is also seen in the central OB association of the nearby 30 Dor nebula, typically with increasing strength; i.e., the most massive stars are formed later (e.g., Selman et al. 1999). Therefore, we adopt a mean age of the OB association as Myrs. The inferred ambient density of is reasonable for the expected high density ISM near 30 Dor C.
The mean emission measure of the H-emitting shell is cm-6 pc (Dunne et al., 2001). Adopting a minimum path length of through the H emission region, which is twice as large as the width of the optical line-emitting filaments in Figure 2 (see also Fig. 1l of Dunne et al. 2001), gives an upper limit to the mean electron density of for the ionized shell, where is the filling factor of the H-emitting gas. The thermal pressure of the ionized shell is approximately , where K and is the Boltzmann constant. This value is within a factor of three of the thermal pressure derived from the X-ray data for filling factors in the range –.
The mechanical luminosity required to power the bubble is . There are spectroscopically indentified O-type stars and confirmed W-R stars in LH 90 (Testor et al., 1993). While the mass loss rates of W-R stars can be an order of magnitude higher than those of O-type stars (e.g., Nugis & Lamers 2000), the lifetime of these stars are fractions of a million years, i.e., much shorter than the probable age of the bubble, and so their energy input to the bubble is negligible compared with that from the O-type stars. Adopting a mean mass loss rate of (de Jager, Nieuwenhuijzen, & van der Hucht 1988) and terminal velocities in the range from to (Prinja, Barlow, & Howarth 1990), which are typical values for the O-type stars in LH 90, we calculate an integrated wind luminosity of –. Therefore, the O-type stars in the stellar clusters of LH 90 could easily supply the mechanical luminosity required to power the bubble, without the contributions from a few supernovae. If the bubble is much older than Myr, then the mechanical energy input to the bubble from the O-type stars could greatly exceed the value of inferred from the spectral fits. The best-fit bubble parameters give an estimate of the total energy input of . This energy input is inferred from the density and temperature structure of the bubble, and not from its mechanical luminosity and age.
There is clearly discrepancy between the expected mechanical energy input from the OB association and that inferred from the bubble model. This apparent oversupply of mechanical energy is a common problem in the existing studies of several other structures around OB associations (e.g., Oey 1996; Nazé et al. 2001; Cooper et al. 2003). In all these studies, including the present one, a potentially very important energy mechanism — dust grain cooling — is not considered. One expects dust grains to be mixed with the X-ray-emitting gas due to the thermal evaporation and supernova ejecta. With a normal interstellar dust grain population, the cooling rate of dust grains heated by collisions with hot electrons can be substantially greater than the radiative cooling of the hot gas itself (e.g., Dwek & Arendt 1992 and references therein). Of course, dust grains subject to the sputtering. Their survival timescale depend on both the grain sizes and the ambient hot gas density. With the large uncertainties in these parameters, we find that it is conceivable for dust grains to be the major coolant of a superbubble.
We find a coefficient of thermal conduction of of the classical Spitzer value. Thermal conduction can be reduced by the presence of magnetic fields (e.g., Chandran & Cowley 1998): the thermal conductivity can approach % of the Spitzer value due to the chaotic transverse wandering of the magnetic field lines, although this value could be uncertain by a factor of two (Narayan & Medvedev, 2001). The theoretical value of is consistent with our measurement, given the uncertainties in the bubble age. Thermal conduction is unlikely to be saturated (e.g., Cowie & McKee 1977), since the mean free path of a charge particle is much smaller than the radius of the bubble.
As expected, the best-fit equivalent hydrogen column densities toward the eastern and western parts of 30 Dor C are significantly higher than the equivalent Galactic H i column density toward 30 Dor C of cm-2 (Dickey & Lockman, 1990). We therefore use the optical extinction of stars in the OB association to independently estimate the total (atomic plus molecular) column density toward 30 Dor C. The mean interstellar extinction for the association as a whole is and reaches a maximum of in the western part (Testor et al., 1993). Adopting a value of for the Galactic foreground extinction toward 30 Dor C (Xu et al., 1992) and assuming gas-to-dust ratios of (Bohlin, Savage, & Drake 1978) and (Fitzpatrick, 1985) for the Galaxy and LMC respectively, we estimate a mean column density of toward the OB association and a maximum column density of toward the western part. While these values appear to be larger than our measurements, we had assumed solar abundances for the atomic absorption cross-sections in the spectral fits. Almost all of the absorption cross-section at keV is provided by metals and so, for a metal abundance of solar, the measured X-ray absorption column densities towards the eastern and western parts of the bubble are cm-2 and cm-2, respectively. These X-ray absorption column densities are consistent with the absorption column densities estimated from the optical extinction of stars in the OB association. The difference in the measured X-ray absorption column densities of cm-2 is consistent with the H2 column density inferred from the CO emission projected onto the western part of 30 Dor C (see § 3.1).
6 NATURE OF THE NONTHERMAL X-RAY EMISSION
6.1 Synchrotron Emission
For energy-conserving shocks, the H expansion velocity of km s-1 (Dunne et al., 2001) corresponds to a shock velocity of km s-1 (e.g., Chu et al. 1995b), and gas passing through the shock would only be heated to temperatures of K (e.g., Hollenbach & McKee 1979), which is well below the temperature of the X-ray emitting gas. The observed [S ii]/H flux ratio of (Mathewson et al., 1985) is also below that expected from shocked gas (e.g., Long et al. 1990) and, contrary to the observations, the bulk of the nonthermal X-ray emission is expected to originate in the eastern part of 30 Dor C since the non-thermal radio emission is much stronger on the eastern side of the bubble than on the western side. Thus, we conclude that any recent supernova explosion must have occured deep inside the bubble, producing little or no observable nonthermal X-ray synchrotron radiation. Bamba et al. (2003, 2004) explained the the apparently nonthermal component in the X-ray spectrum of 30 Dor C as synchrotron radiation from relativistic electrons. If this is true, the required electron energies should be a few hundred TeV for a typical interstellar magnetic field of order G. Although low (up to a few tens of km s-1) velocity shoulders are visible on the H emission lines from various parts of the bubble (Y.-H. Chu 2004, private communication), there is a complete lack of emission with velocities greater than km s-1 from the recessional velocity of the LMC and so the shock velocities are certainly too low to produce such energetic particles.
The most obvious site for an effective particle acceleration should be the reverse shock, which separates the free-streaming stellar wind from the region of thermally evaporated material ( in Fig. 1 of Weaver et al. 1977). For a mean mass loss rate of , a terminal velocity of , an ambient density of cm-3, and a bubble age of Myrs, the inner shock radius is roughly pc (Weaver et al., 1977). The time scales for the relativistic electrons to diffuse from the reverse shock to the edge of the bubble would have to be shorter than their synchrotron half-lives, which are of order (e.g., Lang 1974, pp. 31-32). The relativistic electrons would therefore have to travel in the bubble at velocities that are an order of magnitude faster than the sound velocity of – km s-1 and two orders of magnitude faster than the Alfvén velocity of km s-1, which is untenable (e.g., Jaffe 1977). It is possible that the electrons could be accelerated by turbulent motions in the bubble itself. The turbulent velocities would be of order or greater than the Alfvén velocity, since otherwise the magnetic field would damp the turbulent motions (e.g., Jaffe 1977), and so the turbulent kinetic energy involved would be a few erg. The electrons must be accelerated on time scales that are shorter than their radiative lifetimes and so the power dissipated in this process is of order erg s-1. While this value is comparable to the mechanical wind luminosity of the early-type stars, the “second-order” acceleration by turbulence is probably too inefficient.
6.2 Inverse Compton Radiation
The inverse Compton (IC) scattering of Cosmic Microwave Background (CMB) and other ambient photons (e.g., infrared photons from reprocessed starlight) by relativistic electrons will also generate nonthermal X-ray emission. The upscattering of such photons to keV requires electrons with energies in the range from to GeV. These electrons radiate synchrotron emission at frequencies of MHz to tens of MHz in magnetic fields of order . For CMB photons, the ratio of inverse Compton-scattered X-ray flux to radio synchrotron flux is
| (6) |
(e.g., Blumenthal & Gould 1970), where and are the flux densities at frequencies and , respectively. The functions and are given in Blumenthal & Gould (1970) for a power-law distribution of electron energies with index . The radio synchrotron spectrum should have the same spectral index as the IC emission and so we have assumed a spectral index of for the radio synchrotron spectrum. The ratio of to is for this value of . We have also assumed that the magnetic field strength is and that the electron distribution is an unbroken power-law extending from Lorentz factors of few times , which will upscatter CMB photons to X-ray wavelengths, to Lorentz factors of order , which will produce MHz radio emission via synchrotron radiation. This last assumption may not be correct, however, since the nonthermal X-ray emission is stongest in the western part of the bubble where there is no evidence for nonthermal radio emission (Mathewson et al., 1985). Nonetheless, the total (thermal plus synchrotron) emission at MHz is Jy (Mathewson et al., 1985) and so the expected 1 keV to MHz flux density ratio of gives an upper limit to the IC emission at 1 keV of photons cm-2 s-1 keV-1. Although this value is consistent with the flux densities of the power-law emissions from the eastern and western parts of 30 Dor C, the IC emission is probably much fainter than this, since the flat () radio spectrum is an indication that the radio emission is mostly thermal (Mathewson et al., 1985).
The upscattering of infrared photons to X-ray energies requires electrons with Lorentz factors of a few hundred. For a power-law distribution of electron energies with index , we would expect the number of electrons capable of upscattering infrared photons to X-ray energies to be times the number of electrons capable of upscattering CMB photons to X-ray energies. The –m luminosity of 30 Dor C can be estimated from
| (7) |
(Cataloged Galaxies and Quasars Observed in the IRAS Survey, Appendix B), where and are the IRAS flux densities in Jy at m and m, respectively, and is the distance to the source in cm. The extended infrared emission measured by IRAS is roughly and Jy at and m, respectively (Laspias & Meaburn, 1991), and so we estimate a –m luminosity of the order of a few erg s-1. Thus, the mean infrared energy density of the bubble is of the order erg cm-3 and could be higher if the infrared emission is concentrated in the outer shell. If we adopt a mean photon energy of eV for the infrared emission, then the total infrared photon number density is cm-3. The CMB photons have, in contrast, a mean photon energy of eV and a total photon number density of cm-3 (e.g., Gaiser, Protheroe, & Stanev 1998). From equation (6) of Gaisser et al. (1998) and assuming that the electron energies are distributed as a power-law of index , we find that the IC emission at a fixed photon energy scales roughly as , where is the photon number density of the radiation under consideration. So we would expect the X-ray emission from IC-scattered infrared photons to be percent higher than that from the upscattering of the CMB photons. However, the optical radiation from stars should have an energy density greater than that of the infrared emission and could be IC-scattered to X-ray energies by electrons with Lorentz factors of . If we assume that the mean energy of the optical photons is eV, then the total photon number density of the optical radiation should be cm-3 and the X-ray emission from IC-scattered optical photons should be an order of magnitude higher than that from the upscattered infrared and CMB photons. Unless the particle energy distribution is far from the power law (e.g., a Maxwellian distribution) and/or the particle population is greatly enhanced at the shell, the nonthermal X-ray emission should then be concentrated in the central region of 30 Dor C, where the optical emission is greatest. This is inconsistent with the observed limb-brightened hard X-ray emission (Fig. 3). A strong shock, as expected inside the bubble, will also produce electron spectra with indexes of (e.g., Blandford & Eichler 1987), which is totally at odds with the spectral index of the nonthermal X-ray emission. On the other hand, if the relativistic particles represent the thermalized wind material from young pulsars during the lifetime of the bubble, then the particle energies could be distributed as a Maxwellian of peak energy – (Arons & Tavani, 1994; Atoyan, 1999). Therefore, we cannot rule out the possibility that the bulk of the nonthermal X-ray emission from the bubble is due to IC radiation.
6.3 Nonthermal Bremsstrahlung Radiation
Nonthermal particles generate bremsstrahlung in regions where the energy losses due to ionization and Coulomb collisions are significant. The energy flux of the bremsstrahlung radiation is times the total energy input to the particles (e.g., Dogiel et al. 2002), i.e., a large amount of energy is required to maintain the particles against Coulomb/ionization losses to the emitting region. The best-fit bubble model (model vB+P) has power-law components with unabsorbed – keV luminosities of and erg s-1 in the eastern and western parts of the bubble, respectively. The required energy input is therefore – erg s-1. Although the necessary energy input can be less than this for a quasi-thermal distribution of electrons formed in regions of in situ acceleration (Dogiel et al., 2002), it is still orders of magnitude greater than the integrated wind luminosity of - erg s-1 from the O-type stars in LH 90. A recent (within the last a few years; Chu & MacLow 1990) supernova explosion could provide the energy input to the bubble, but this would mean that we are seeing the event by chance. The 26 O-type stars in LH 90 have masses in the range from to (e.g., Walborn et al. 1995, 1999). If we assume a Spitzer initial mass function for the stars in LH 90, then we would expect O-type stars with masses in the range from to . Although some of these stars would undoubtedly have evolved into W-R stars, the remainder would have exploded as supernovae (stars with masses greater than do not explode as supernovae, but instead collapse into a black-hole). Thus, there must have been at least – supernovae in 30 Dor C, and so the probability of seeing a supernova within the last years is approximately percent, assuming that the age of the bubble is Myr.
7 CONCLUSIONS
In summary, the nature of the apparent nonthermal hard X-ray component is still uncertain. The expansion of the bubble is much too slow in order to produce the energetic particles necessary for nonthermal X-ray synchrotron emission. Although such energetic particles can be produced at the inner reverse shock, they cannot cross the bubble within their synchrotron half-lives. Nonthermal bremsstrahlung is an inefficient process, requiring at least three orders of magnitude more energy than can be supplied by the O-type stars in LH 90. A recent supernova could supply the necessary energy, but this would mean that we are seeing the event by chance (a probability of percent). The IC scattering of CMB and infrared photons cannot account for all of the nonthermal X-ray emission unless the radio flux is purely synchrotron radiation, which seems unlikely. While the X-ray emission from IC-scattered optical photons should be much higher than that from IC-scattered CMB and infrared photons, it should be concentrated in the central region of 30 Dor C, where the optical photon density is greatest, in sharp contrast to the data. The nonthermal X-ray emission could instead be due to the IC scattering of CMB and infrared photons by relativistic particles originating in young pulsar wind material with energies peaking between –. High spatial resolution X-ray imaging, which can be afforded by an on-axis Chandra observation, will be particularly useful to further the understanding of the component. Such an observation will allow for an accurate determination of the size and geometry of the X-ray-emitting region and for a detailed comparison with images in other wavelength bands. A substantial fraction of the expected energy input from stellar winds and supernovae may be radiated in the infrared by dust grains entrained in the hot gas.
We thank R. Chris Smith for providing his optical image of 30 Dor C in computer-readable format, Glenn Allen for discussions on the nonthermal emission, and the referee for insightful comments on an earlier draft of the paper. This research is supported by the NASA LTSA grant NAG5-8935.
References
- Abbott (1982) Abbott, D. C. 1982, ApJ, 263, 723
- Anders & Grevesse (1989) Anders, E., & Grevesse, N. 1989, Geochimica et Cosmochimica Acta, 53, 197
- Arnaud (1996) Arnaud, K. A. 1996, in ASP Conf. Proc. 101, Astronomical Data Analysis Software and Systems V, ed. G. Jacoby & J. Barnes (San Francisco: ASP), 17
- Arons & Tavani (1994) Arons, J. & Tavani, M. 1994, ApJS, 90, 797
- Atoyan (1999) Atoyan 1999, å, 346, L49
- Bamba et al. (2003) Bamba, A., Ueno, M., Koyama, K., & Itoh, M. 2003, in The Proceedings of the 8th IAU Asian-Pacific Regional Meeting, Volume II, ed., S. Ikeuchi, J. Hearnshaw, and T. Hanawa (San Francisco: ASP), 129
- Bamba et al. (2004) Bamba, A., Ueno, M., Nakajima, H., & Koyama, K. 2004, ApJ, 602, 257
- Bessel (1991) Bessel, M. S. 1991, A&A, 242, L17
- Blandford & Eichler (1987) Blandford, R. D., & Eichler, D. 1987, Phys. Rep., 154, 1
- Blumenthal & Gould (1970) Blumenthal, G. R., & Gould, R. J. 1970, Rev. Mod. Phys., 42, 237
- Bohlin et al. (1978) Bohlin, R. C., Savage, B. D., & Drake, J. F. 1978, ApJ, 224, 132
- Borkowski et al. (2001) Borkowski, K. J., Lyerly, W. J., & Reynolds, S. P. 2001, ApJ, 548, 820
- Cassé & Paul (1980) Cassé, M., & Paul, J. A. 1980, ApJ, 237, 236
- Chandran & Cowley (1998) Chandran, B. D. G., & Cowley, S. C. 1998, Phys. Rev. Lett., 80, 3077
- Cherepashchuk (1991) Cherepashchuk A. M., 1991, in Proc. IAU Symp. 143, Wolf-Rayet Stars and Interrelations with Other Massive Stars in Galaxies, ed. K. A. van der Hucht, B. Hidayat (Dordrecht: Kluwer), 187
- Chu & Mac Low (1990) Chu, Y.-H., & Mac Low, M.-M. 1990, ApJ, 365, 510
- Chu et al. (1995a) Chu, Y.-H., Chang, H.-W., Su, Y.-L., & Mac Low, M.-M. 1995a, ApJ, 450, 157
- Chu et al. (1995b) Chu, Y.-H., Dickel, J. R., Staveley-Smith, L., Osterberg, J., & Smith, R. C. 1995b, AJ, 109, 1729
- Cooper et al. (2003) Cooper, R. L., Guerrero, M. A., Chu, Y.-H., Chen, C.-H. R., & Dunne, B. D. 2003, ApJ, submitted
- Cowie & McKee (1977) Cowie, L. L., & McKee, C. F. 1977, ApJ, 211, 135
- Davies et al. (1976) Davies, R. D., Elliott, K. H., & Meaburn, J. 1976, MmRAS, 81, 89
- de Jager et al. (1988) de Jager, C., Nieuwenhuijzen, H., & van der Hucht, K. A. 1988, A&AS, 72, 259
- Dennerl et al. (2001) Dennerl, K., et al. 2001, A&A, 365, L202
- Dickey & Lockman (1990) Dickey, J. M., & Lockman, F. J. 1990, ARA&A, 28, 215
- Dogiel et al. (2002) Dogiel, V. A., Inoue, H., Masai, K., Schönfelder, V., & Strong, A. W. 2002, ApJ, 581, 1061
- Dunne et al. (2001) Dunne, B. C., Points, S. D., & Chu, Y.-H. 2001, ApJS, 136, 119
- Dwek & Arendt (1992) Dwek, E. & Arendt, R.G., 1992, ARA&A, 30, 11
- Eastman & Kirshner (1989) Eastman, R. G., & Kirshner, R. P. 1989, ApJ, 347, 771
- Fitzpatrick (1985) Fitzpatrick, E. L. 1985, ApJ, 299, 219
- Gaisser et al. (1998) Gaisser, T. K., Protheroe, R. J., & Stanev, T. 1998, ApJ, 492, 219
- Ghavamian et al. (2002) Ghavamian, P., Winkler, F. P., Raymond, J. C., & Long, K. S. 2002, ApJ, 572, 888
- Haberl et al. (2001) Haberl, F., Dennerl, K., Filipović, M. D., Aschenbach, B., Pietsch, W., & Trümper, J. 2001, A&A, 365, L208
- Hollenbach & McKee (1979) Hollenbach, D., & McKee, C. F. 1979, ApJS, 41, 555
- Israel (1997) Israel, F. P. 1997, A&A, 328, 471
- Jaffe (1977) Jaffe, W. J. 1977, ApJ, 212, 1
- Jansen et al. (2001) Jansen, F., et al. 2001, A&A, 365, L1
- Johansson et al. (1998) Johansson, L. E. B., et al. 1998, A&A, 331, 857
- Lang (1974) Lang, K. R. 1974, Astrophysical Formulae (New York: Springer)
- Laspias & Meaburn (1991) Laspias, V. N., & Meaburn, J. 1991, MNRAS, 249, 1P
- Long et al. (1990) Long, K. S., Blair, W. P., Kirshner, R. P., & Winkler, P. F. 1990, ApJS, 72, 61
- Lortet & Testor (1984) Lortet, M. C., & Testor, G. 1984, A&A, 139, 330
- Lucke & Hodge (1970) Lucke, P. B., & Hodge, P. W. 1970, AJ, 75, 171
- Mathewson et al. (1985) Mathewson, D. S., Ford, V. L., Tuohy, I. R., Mills, B. Y., Turtle, A. J., & Helfand, D. J. 1985, ApJS, 58, 197
- Mac Low & McCray (1988) Mac Low, M.-M., & McCray, R. 1988, ApJ, 324, 776
- McCray & Snow (1979) McCray, R., & Snow, T. P., Jr. 1979, ARA&A, 17, 213
- Meaburn et al. (1993) Meaburn, J., Wang, L., Palmer, J., & Lopez, J. A. 1993, MNRAS, 263, L6
- Mewe et al. (1995) Mewe, R., Kaastra, J. S., & Liedahl, D. A. 1995, Legacy, 6, 16
- Morrison & McCammon (1983) Morrison, R., & McCammon, D. 1983, ApJ, 270, 119
- Narayan & Medvedev (2001) Narayan, R., & Medvedev, M. V. 2001, ApJ, 562, L129
- Nazé et al. (2001) Nazé, Y., Chu, Y.-H., Points, S. D., Danforth, C. W., Rosado, M., Chen, C.-H. R. 2001, AJ, 122, 921
- Nugis & Lamers (2000) Nugis, T., & Lamers, H. J. G. L. M. 2000, A&A, 360, 227
- Oey (1996) Oey, M. S. 1996, ApJ, 467, 666
- Prinja et al. (1990) Prinja, R. K., Barlow, M. J., & Howarth, I. D. 1990, ApJ, 361, 607
- Read & Ponman (2003) Read, A. M., & Ponman, T. J. 2003, A&A, 409, 395
- Russell & Dopita (1992) Russell, S. C., & Dopita, M. A. 1992, ApJ, 384, 508
- Selman (1999) Selman, F., Melnick, J., Bosch, G., & Terlevich, R. 1999, A&A, 347, 532
- Shull & Saken (1995) Shull, J. M., & Saken, J. M. 1995, ApJ, 444, 663
- Smith et al. (1998) Smith, R. C., and the MCELS Team 1998, Publ. Astron. Soc. Aust., 15, 163
- Testor et al. (1993) Testor, G., Schild, H., & Lortet, M. C. 1993, A&A, 280, 426
- Thielemann et al. (1996) Thielemann, F.-K., Nomoto, K., & Hashimoto, M. 1996, ApJ, 460, 408
- Turner et al. (2001) Turner, M. J. L., et al. 2001, A&A, 365, L27
- van der Marel & Cioni (2001) van der Marel, R. P., & Cioni, M.-R. L. 2001, AJ, 122, 1807
- Wang & Helfand (1991) Wang, Q., & Helfand, D. J. 1991, ApJ, 373, 497
- Wang & Gotthelf (1998) Wang, Q. D., & Gotthelf, E. V. 1998, ApJ, 494, 623
- Walborn et al. (1995) Walborn, N. R., MacKenty, J. W., Saha, A., White, R. L., & Parker, J. W. 1995, ApJ, 439, L47
- Walborn et al. (1999) Walborn, N. R., Drissen, L., Parker, J. W., Saha, A., MacKenty, J. W., & White, R. L. 1999, AJ, 118, 1684
- Weaver et al. (1977) Weaver, R., McCray, R., Castor, J., Shapiro, P., & Moore, R. 1977, ApJ, 218, 377
- Woosley & Weaver (1986) Woosley, S. E., & Weaver, T. A. 1986, ARA&A, 24, 205
- Woosley & Weaver (1995) Woosley, S. E., & Weaver, T. A. 1995, ApJS, 101, 181
- Xu et al. (1992) Xu, C., Klein, U., Meinert, D., Wielebinski, R., & Haynes, R. F. 1992, A&A, 257, 47
| Modelaafootnotemark: | ||||
|---|---|---|---|---|
| Parameter | B+P | M+P | vB+P | |
| bbfootnotemark: | ( cm-2) | |||
| ccfootnotemark: | ( cm-2) | |||
| ddfootnotemark: | (keV) | |||
| eefootnotemark: | () | fffootnotemark: | fffootnotemark: | fffootnotemark: |
| ggfootnotemark: | () | fffootnotemark: | fffootnotemark: | |
| hhfootnotemark: | () | |||
| iifootnotemark: | ||||
| jjfootnotemark: | ( photons cm-2 s-1 keV-1) | |||
| kkfootnotemark: | ( photons cm-2 s-1 keV-1) | |||
| (dof) | ||||
| Prob.llfootnotemark: | ||||
aModel: B wind-blown bubble (model valid for gas
temperatures in the range from 8 eV to 80 keV); vB wind-blown
bubble with variable abundances (model valid for gas temperatures in
the range from 8 eV to 80 keV); M MEKAL (model valid for gas
temperatures in the range from 8 eV to 80 keV); P power-law.
bMeasured column density towards the eastern part of the
bubble.
cMeasured column density towards the western part of the
bubble.
dThe gas temperature at the center of the bubble.
eC, N, Na, Al, Fe, and Ni abundance relative to solar of the
bubble.
fFixed at the known value of % solar for the ISM in the LMC.
gO, Ne, Mg, Si, S, Ar, and Ca abundance relative to solar of
the bubble.
hThe normalization of the bubble model. The units are
cgs.
iPhoton spectral index.
jNormalization for the power-law model in the eastern part of
the bubble.
kNormalization for the power-law model in the western part of
the bubble.
lProbability that the model describes the data and that
exceeds the observed value by chance.