11email: galletta@pd.astro.it; casasola@pd.astro.it 22institutetext: Osservatorio Astronomico di Padova, Vicolo dell’Osservatorio 5, I-35122, Padova
22email: bettoni@pd.astro.it
The gas content of peculiar galaxies: strongly interacting systems††thanks: Table 1 is only available in electronic form at the CDS via anonymous ftp to cdsarc.u-strasbg.fr (130.79.128.5) or via http://cdsweb.u-strasbg.fr/cgi-bin/qcat?J/A+A/
A study of the gas content in 1038 interacting galaxies, essentially selected from Arp, Arp and Madore, Vorontsov-Velyaminov catalogues and some of the published literature, is presented here. The data on the interstellar medium have been extracted from a number of sources in the literature and compared with a sample of 1916 normal galaxies. The mean values for each of the different ISM tracers (FIR, 21 cm, CO lines, X-ray) have been estimated by means of survival analysis techniques, in order to take into account the presence of upper limits. From the data it appears that interacting galaxies have a higher gas content than normal ones. Galaxies classified as ellipticals have both a dust and gas content one order of magnitude higher than normal. Spirals have in most part a normal dust and HI content but an higher molecular gas mass. The X-ray luminosity also appears higher than that of normal galaxies of same morphological type, both including or excluding AGNs. We considered the alternative possibilities that the molecular gas excess may derive from the existence of tidal torques which produce gas infall from the surrounding regions or from a different metallicity which affects the X conversion factor between the observed CO line luminosity and the H2 calculated mass. According to our tests, it appears that interacting galaxies possess a higher molecular mass than normal galaxies but with a similar star formation efficiency.
Key Words.:
catalogues – galaxies: ISM – galaxies: Interacting1 Introduction
It is known that interactions between galaxies and environment play an important role in determining the internal galaxy structure. Gas accretion may produces central black holes (Kormendy and Richstone 1995), polar rings (Whitmore et al. 1990) or counter-rotations (Galletta 1996; Corsini & Bertola 1998). Gas stripping in clusters may deplete a spiral galaxy transforming it into an S0 (Dressler et al. 1997), while massive collisions may destroy the whole galaxy structure creating giant triaxial ellipticals (Bendo & Barnes 2000). According to numerical models, bars and rings may also be generated by a close encounter between galaxies (Athanassoula 2002). Interaction also affects other galaxy properties, such as the star formation rate (Sanders & Mirabel 1996; Solomon & Sage 1988; Combes et al. 1994), visible as a strong increase of infrared luminosity.
Inside galaxies, gas is expected to reflect the effects of the interaction more strongly than stars. A recent study on the interstellar medium (ISM) in 104 peculiar galaxies (Bettoni et al. 2001) shows that polar ring galaxies have a gas content one order of magnitude higher than normal ones. In many cases, the higher gas content is visible even if the interaction with the environment has ceased for long time.
We wonder if a peculiar gas content is detectable in those galaxies where interaction is currently ongoing, such as some systems contained in the Vorontsov-Velyaminov (1959), Arp (1966) and Arp & Madore (1987) catalogues. Here we present the results of a selection of 1038 objects extracted from these catalogues. For these galaxies data on dust, HI, molecular gas and X-ray luminosities are available in the literature. The properties of the different components of the interstellar medium are studied here and compared with those of a sample of 1916 normal galaxies (Bettoni et al. 2003).
| All | Dust | HI | Mol | X-ray | ||
|---|---|---|---|---|---|---|
| Type | t | N/Nd | N/Nd | N/Nd | N/Nd | |
| E | -5 | 22 | 15/8 | 12/7 | 3/0 | 13/11 |
| E+ | -4 | 21 | 18/12 | 6/3 | 3/1 | 11/10 |
| E/S0 | -3 | 18 | 13/9 | 9/5 | 4/1 | 9/4 |
| S0 | -2 | 47 | 36/31 | 21/14 | 8/2 | 11/7 |
| S0+ | -1 | 40 | 35/31 | 18/15 | 3/2 | 4/1 |
| S0/a | 0 | 36 | 31/25 | 14/14 | 7/4 | 3/1 |
| Sa | 1 | 82 | 75/71 | 44/41 | 12/12 | 9/5 |
| Sab | 2 | 78 | 67/63 | 42/42 | 10/9 | 6/3 |
| Sb | 3 | 142 | 128/127 | 75/72 | 29/23 | 8/5 |
| Sbc | 4 | 177 | 169/164 | 68/64 | 16/15 | 10/8 |
| Sc+S? | 5 | 148 | 129/124 | 89/87 | 19/17 | 10/3 |
| Sc | 6 | 74 | 63/58 | 50/48 | 12/11 | 8/2 |
| Scd | 7 | 33 | 31/30 | 20/20 | 4/4 | 5/4 |
| Sd | 8 | 30 | 23/20 | 26/26 | 4/2 | 2/1 |
| Sm | 9 | 30 | 22/19 | 25/24 | 10/6 | 4/3 |
| Irr | 10 | 35 | 23/23 | 30/29 | 5/5 | 4/3 |
| ? | 11 | 25 | 22/21 | 7/7 | 4/4 | 1/0 |
| Total | 1038 | 900/836 | 556/518 | 153/118 | 118/71 |
2 Data extraction
Our first effort was to define a list of galaxies appearing to be clearly interacting with nearby objects and presenting tidal tails or bridges. Merging systems and galaxies with disturbed structures have also been included in our sample. The first catalogues of galaxies of this kind were compiled by Vorontsov-Velyaminov (1959), Arp (1966) and Arp & Madore (1987). These three catalogues represent almost the totality of our sample galaxies. However, all the above catalogues also contain objects that have been considered peculiar by the authors because of an unusually low surface brightness or the presence in a elongated group or chain of galaxies. The morphology of these galaxies do not seem to be directly connected with tidal perturbation and have been discarded from our sample. We also removed from the sample galaxies such as NGC 5128 (Cen A or Arp 153) because they belong to the category of polar ring ellipticals, whose gas content has already been discussed in a precedent study (Bettoni et al. 2001). Similarly, all the galaxies containing gas- or star- counter-rotation have been removed. For 81 objects no distances have been found in the literature and for a further 486 galaxies no data are available on gas content. These galaxies have also been discarded. Among the 596 Vorontsov-Velyaminov galaxies we selected 395 systems only, while from the 560 Arp and 6445 Arp & Madore objects we selected 341 and 557 galaxies respectively. Finally, 27 more galaxies not included in the previous catalogues were added from Zhu et al. (1999) work. Our final sample is composed of 1038 galaxies whose appearance seems to be perturbed by an external agent. The data on these galaxies are presented in Table 1, available in electronic form only. In the case of interacting pairs and triplets whose components appear detached, both components have been included.
To analyze the ISM of these sample galaxies, we searched in the literature for survey papers (e.g. Knapp et al. 1989; Roberts et al. 1991; Casoli et al. 1998; Fabbiano et al. 1992; Burstein et al. 1997; Beuing et al. 1999; O’Sullivan et al. 2001) and single studies in four different tracers: warm dust from 60 and 100 m observations; atomic gas from 21 cm data; molecular gas from CO line observations and X-ray luminosities from Einstein and Rosat satellite observations. Many data come from LEDA111http://leda.univ-lyon1.fr/ galaxy catalogue (Paturel et al. 1997) and from the NASA/IPAC extragalactic database (NED222http://nedwww.ipac.caltech.edu/). The list of sample galaxies has been compared with the Véron-Cetty & Véron (2003) catalogue, to check the eventual presence of active galaxy nuclei (AGN). The number of galaxies with data (detections and upper limits) and the number of detections only are listed in Table 2, binned according to the morphological type.
To homogenize all these data, we reduced the published values to the distances extracted from a single source, the LEDA on-line archive. The LEDA distance moduli are mainly derived from redshifts, corrected for Virgocentric inflow and adopting Ho=70 km s-1 Mpc-1. When redshift was not available, we used the photometric distance modulus, if present. For each galaxy we also collected the morphological classification, the diameter and the blue luminosity, corrected for cosmological reddening and galactic- and internal- dust absorptions. The blue corrected luminosity LB in solar units and the square of the face-on corrected diameter in kpc Log D2 were used as normalization factors for the gas masses and the X-ray luminosities. However, due to the similarity in the results obtained with one or other normalization factor, we present only the data normalized to LB.
The LEDA morphological type t codes derive from RC3 (de Vaucouleurs et al. 1991) with some changes, as visible in our Tables 2 and 3. Type 5 includes systems with uncertain classification (type S?). In our sample 25 galaxies are unclassified in LEDA. We attributed the morphological type code t=11 to these systems in order to plot them in our graphs as well. We remember that the morphological classification may be misleading for very perturbed objects, and when present in interacting galaxies reflects the present-day observed morphology and not the original one. The difference we found in the comparison with normal galaxies then will reflect the difference between the present, may be transient, morphology and that of a stable galaxy with similar appearance.
2.1 Mass estimates
We have estimated total gas masses and/or luminosities following standard procedures. From the value of the IR fluxes at 60 and 100 m we estimated the temperature (Kelvin) of the dust emitting at such a wavelengths:
| (1) |
and the corresponding warm dust mass, in solar units, by means of the expression:
| (2) |
In the above formula, is in mJy and in Mpc.
HI gas masses were derived from 21 cm fluxes or from the m21c corrected magnitudes of LEDA. From m21c, we used the expression:
| (3) |
whereas if , in Jy km s-1, was available we used the formula:
| (4) |
For 71 galaxies that are in close interaction or merging, the IR or 21 cm emission is attributed to the whole pair and not to a single galaxy in the literature. For instance, PGC 37967 and PGC 37969, making part of the object called ‘The Antennae’, have no IR data from 12 to 100 m visible in NED or LEDA catalogues. However, these data appear when the databases are searched with the name of the whole pair, ARP 224 or VV245. To manage these galaxies, we decided to calculate from the IR data the total warm dust mass of the pair. This total mass was normalized by the total absolute blue luminosity of the pair or the total area by adding the values of both components. So the values of both components of the pair appear identical in Tab. 1. These spatially unresolved data were not used to define the mean values in the following statistical analysis, due to the difficulty in attributing the masses to every single object.
The formula used to derive molecular gas masses from CO(1–0) line fluxes ( in Jy km s-1) is:
| (5) |
We implicitly assumed a constant CO/H2 conversion factor X = = 2.3 1020 mol cm-2 (K km/s)-1 (Strong et al. 1988); includes the helium mass fraction by multiplying the H2 mass by 1.36. A possible variation of the CO-H2 conversion factor X will be discussed later.
X-ray luminosities may derive from diffuse gas and/or from discrete sources. Very recent observations with the Chandra satellite indicate there is the possibility for some galaxies that X-ray fluxes are ‘contaminated’ by the presence of X-ray binaries which must be taken into account in discussing the ISM physical properties (Kim & Fabbiano 2003). We shall discuss the data according to the different models.
When no observed fluxes but only mass values were available in the consulted references, these have been scaled to the distances assumed here. If data from different sources are available for a galaxy, mean values have been calculated. When both upper limits and detections are available, only detections have been used to compute mean values. Moreover, if several upper limits exist, only the lowest value has been adopted.
In order to define the mean content of each tracer according to the morphological type, we made use of survival analysis methods (see Feigelson & Nelson 1985). This method takes into account both detections and upper limits (UL) to derive representative averages. Our survival analysis was performed by means of the statistical package available in IRAF, using the Kaplan-Meier estimator. Mean values and errors listed in Table 3 derive from survival analysis of our data. When all the galaxies are detected, the survival analysis means coincide with arithmetic means. Conversely, the method cannot be applied when both upper and lower limits are present, for instance when considering the mass ratios (e.g. Mmol/MHI). In such a case, we present ratios of mean values. No survival analyses were made for unclassified galaxies (our type t=11).
2.2 Star formation
The production of stars inside strongly interacting systems may be enhanced during the close encounter or the merging of galaxies. Massive, newly born stars heat the dust and increase the infrared luminosity (Lonsdale et al. 1984). Several authors estimated the star formation rate SFR, which is directly proportional to the bolometric (40-100 m) IR luminosity LFIR (Thronson & Telesco 1986; Solomon & Sage 1988; Devereux & Young 1991), calculated from the fluxes S60 and S100. In LEDA catalogue, the entity of infrared emission is defined by the quantity mFIR:
| (6) |
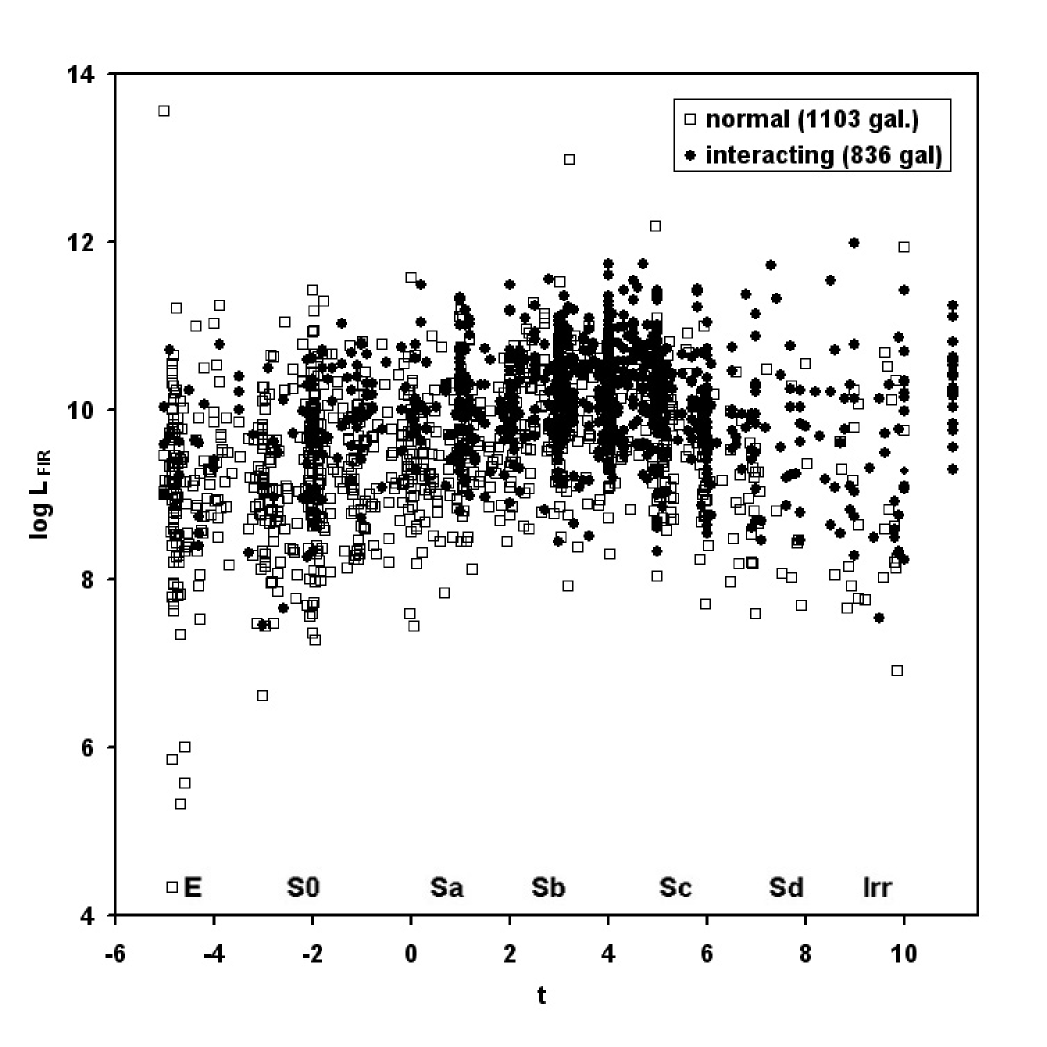
We collected the mFIR values from LEDA catalogue for the sample of interacting galaxies and for the comparison sample of normal galaxies of Bettoni et al. (2003). These values give a direct estimate of the star formation in the two kinds of galaxies, when corrected for the galaxy distance , to give an absolute FIR luminosity
| (7) |
FIR luminositiesa are plotted in Fig. 5 that is discussed in the next section.
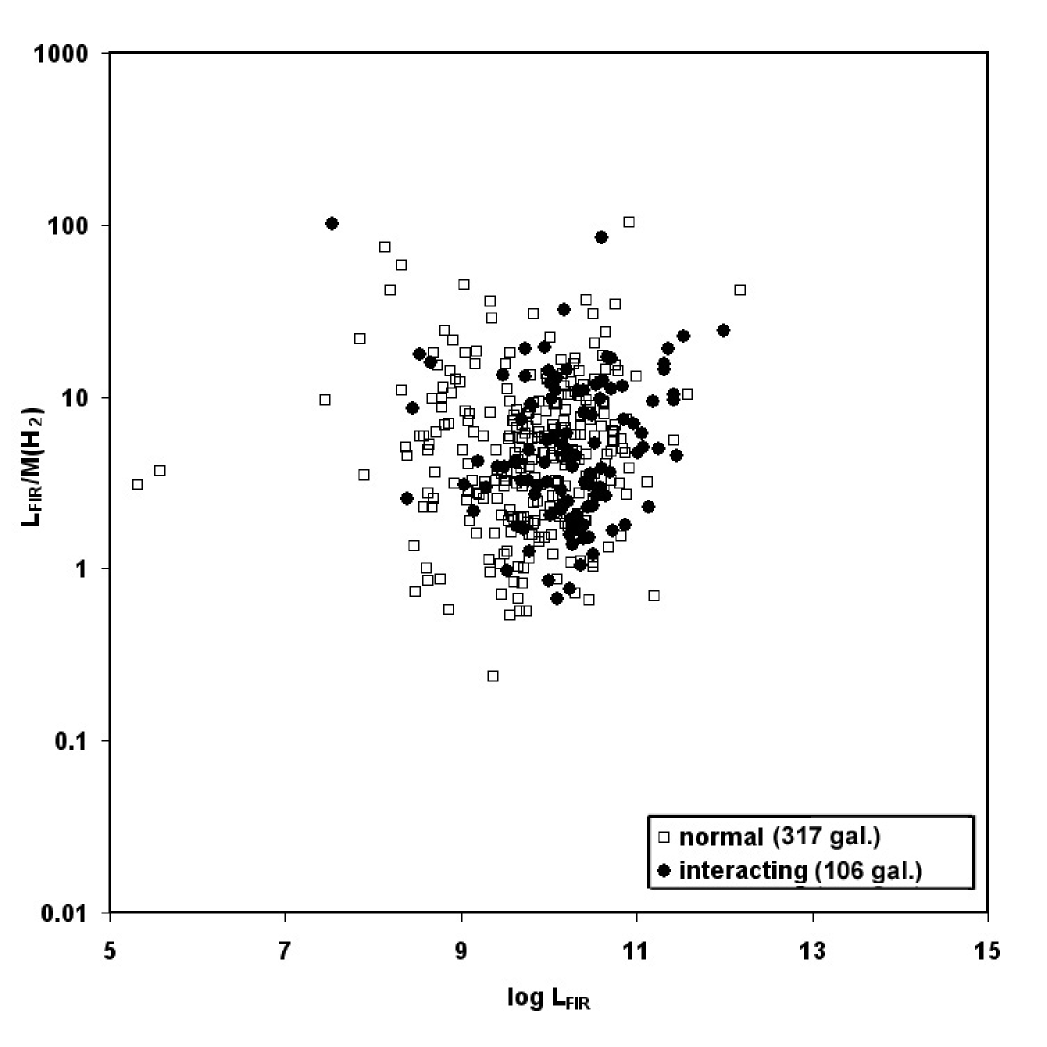
Another parameter describing the stellar formation is the star formation efficiency, SFE, indicating how much stars are produced by a unit of molecular mass. This value may be estimated dividing the FIR luminosity by the total mass of molecular hydrogen:
| (8) |
The more efficient a galaxy is in forming stars, the shorter the time for all the gas to be converted into stars, apart from possible recycling of mass through supernovae explosion or cooling flows (Solomon & Sage 1988). Several authors indicate that strongly interacting galaxies are also more efficient in forming stars (Solomon & Sage 1988; Combes et al. 1994). To study this effect, we plotted the values of Log(SFE) for both samples of galaxies in Figure 6. We note that the value of M(H2) depends on two parameters: the observed CO line intensity and the assumed X conversion factor. Physically, X is determined by various factors, among which the metallicity and the temperature (see Maloney & Black 1988; Boselli et al. 2002). Generally galaxies with a lower metallicity have a X factor higher. However, we don’t know the metallicity of our sample galaxies and our estimates of H2 masses or SFE values depend from how much the assumed X value differs from the true X of each galaxy. In the literature, measured X values found in different type of galaxies span two order of magnitudes (see Boselli 2001), being both higher and lower than our assumed value. As consequence, our calculated H2 masses will be lower than real if the true X value for each galaxy is higher than assumed, and higher than real if it is lower than the assumed value. The same happen for calculated SFE values. The spread of LFIR/M(H2)data visible in Figure 6 may reflect both the effect of a different metallicity or temperature and that of a real different stellar formation efficiency.
3 Properties of Interacting Galaxies
The final data presented in Table 1 are: (1) PGC number; (2) Other names of the galaxies, mainly Arp, AM or VV; (3) morphological type code t; (4) Distance in Mpc; (5) log D, the logarithm of Diameter in Kpc; (6) log LB, logarithm of the blue luminosity; (7) log Mdust/LB, the dust content normalised to blue luminosity; (8) log MHI/LB, the HI content; (9) log Mmol/LB, the molecular gas content; (10) log LX/LB, the normalised X ray luminosity; (11) log LFIR, the FIR luminosity; (12) the presence of activity, extracted from Véron-Cetty & Véron (2003) catalogue, indicated with an ‘a’; (13) the code for the references to the table values, as specified in the Appendix. Masses and luminosities are in solar units.
| Dust | HI | Mol | X-ray | mol/HI | ||
|---|---|---|---|---|---|---|
| Type | t | Log M/LB | Log M/LB | Log M/LB | Log LX/LB | |
| E | -5 | -4.550.17 | -1.230.33 | - | -3.130.14 | - |
| E+ | -4 | -4.900.28 | -1.530.52 | -2.70 - | -2.910.18 | -1.160.52 |
| E/S0 | -3 | -4.920.27 | -0.820.18 | -2.170.67 | -3.500.23 | -1.360.69 |
| S0 | -2 | -4.190.13 | -1.110.24 | -2.240.30 | -3.250.27 | -1.140.38 |
| S0+ | -1 | -3.700.12 | -0.810.12 | -0.680.02 | -3.370.38 | 0.130.12 |
| S0/a | 0 | -3.830.08 | -0.680.14 | -0.940.13 | -3.23 - | -0.260.19 |
| Sa | 1 | -3.750.04 | -0.780.08 | -0.550.15 | -3.100.39 | 0.230.17 |
| Sab | 2 | -3.760.05 | -0.810.06 | -0.710.15 | -3.720.25 | 0.090.17 |
| Sb | 3 | -3.640.04 | -0.610.05 | -0.780.14 | -3.470.19 | -0.180.15 |
| Sbc | 4 | -3.660.03 | -0.550.05 | -0.660.11 | -2.980.30 | -0.110.12 |
| Sc+S? | 5 | -3.760.03 | -0.540.04 | -0.610.09 | -3.580.20 | -0.070.10 |
| Sc | 6 | -3.710.08 | -0.390.06 | -1.190.19 | -4.430.30 | -0.810.20 |
| Scd | 7 | -3.880.07 | -0.520.08 | -1.070.25 | -3.520.27 | -0.550.26 |
| Sd | 8 | -3.940.09 | -0.220.12 | -1.410.31 | -3.560.05 | -1.190.33 |
| Sm | 9 | -3.940.14 | -0.250.10 | -1.780.37 | -3.600.28 | -1.530.38 |
| Irr | 10 | -4.070.09 | -0.280.10 | -1.070.32 | -2.610.63 | -0.790.34 |
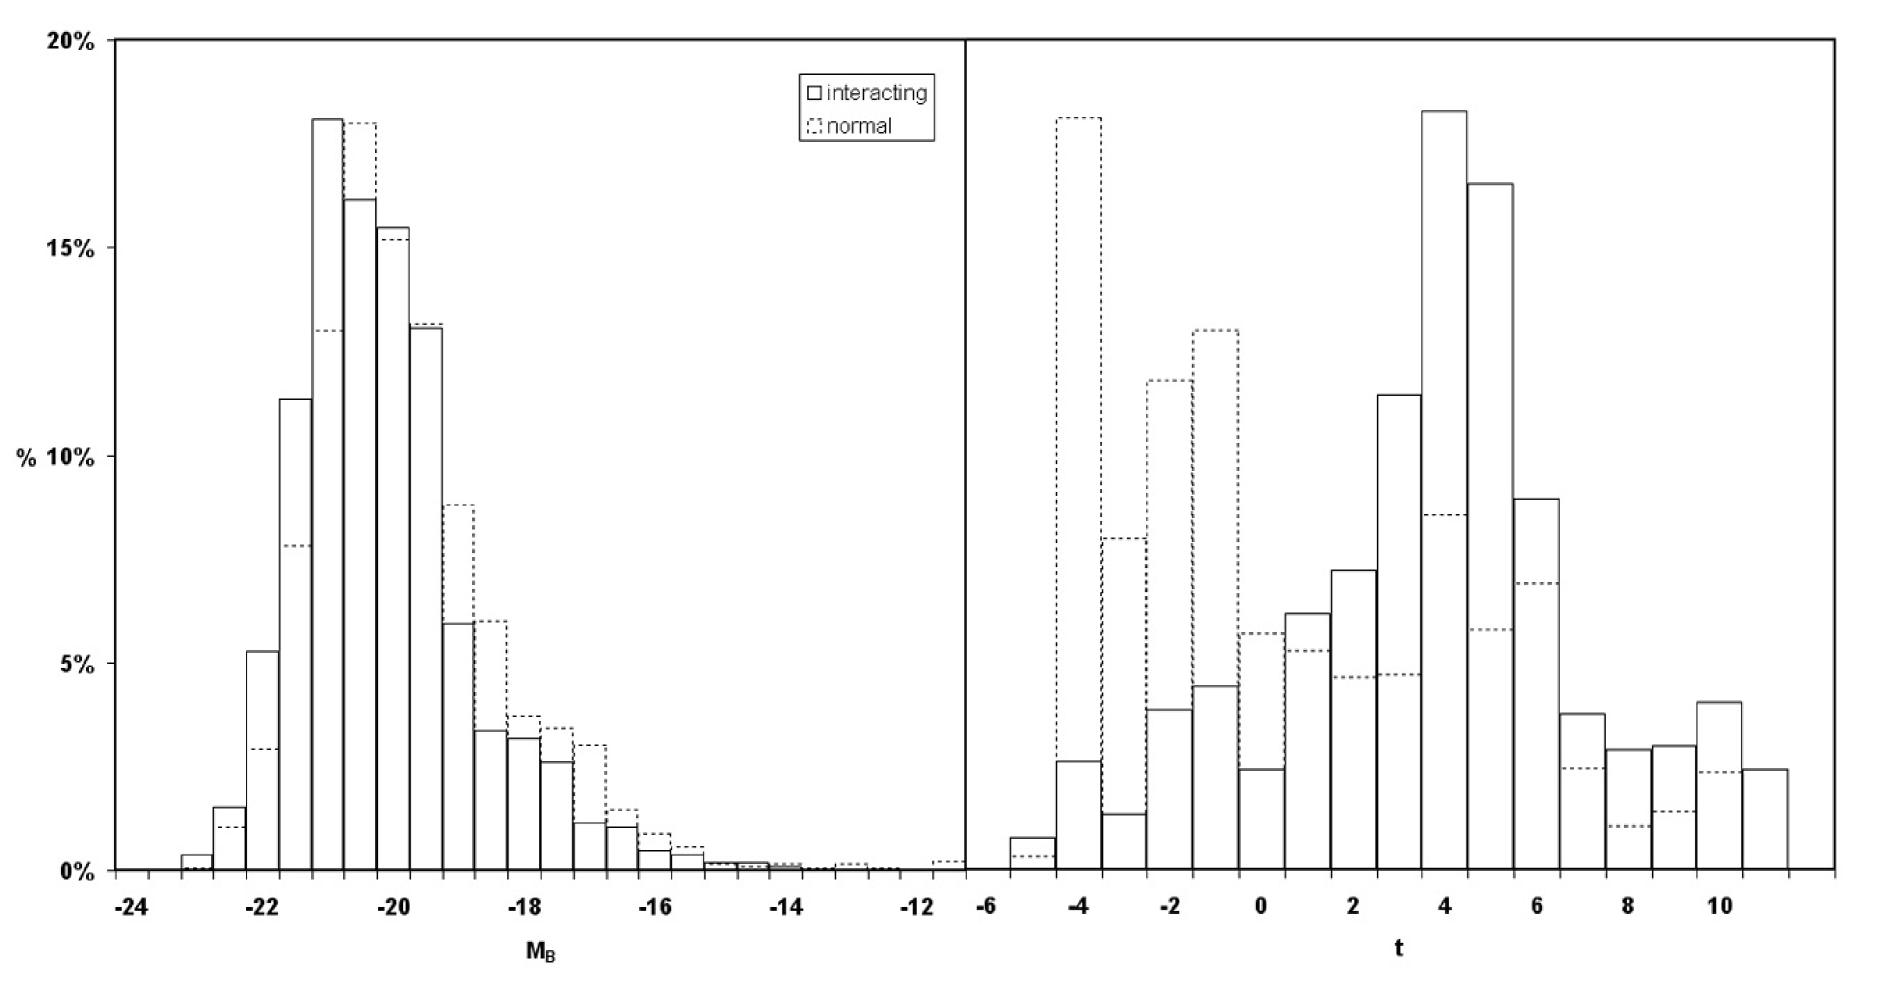
In the following discussion we compare the mean properties of different gas tracers in our sample with that for a sample of 1916 normal galaxies published by Bettoni et al. (2003). The distributions of galaxies in the two samples, in function of absolute magnitudes and morphological types, are shown in Fig. 1. Among the interacting galaxies considered here, the percentage of early-type galaxies is very small, the 15.4% of the total, while the sample of normal galaxies has half of systems with t0 (see Fig. 1). However, most part of our comparison will be made separating the galaxies according to the morphological type code, so keeping into account this difference. A Kolgomorov-Smirmov (KS) test performed on the luminosity and linear diameter functions shows that N(MB) and N(Log D2) are significatively different in the two samples. The same test indicates that the distributions are statistically similar if the interacting galaxies histograms are shifted by MB=0.5 and (log D2)=0.1 with respect to that of normal galaxies. In other words, interacting galaxies appear brighter by 0.5 mag and larger by the 25% with respect to the normal galaxies. Both differences may derive from the effects of the interactions.
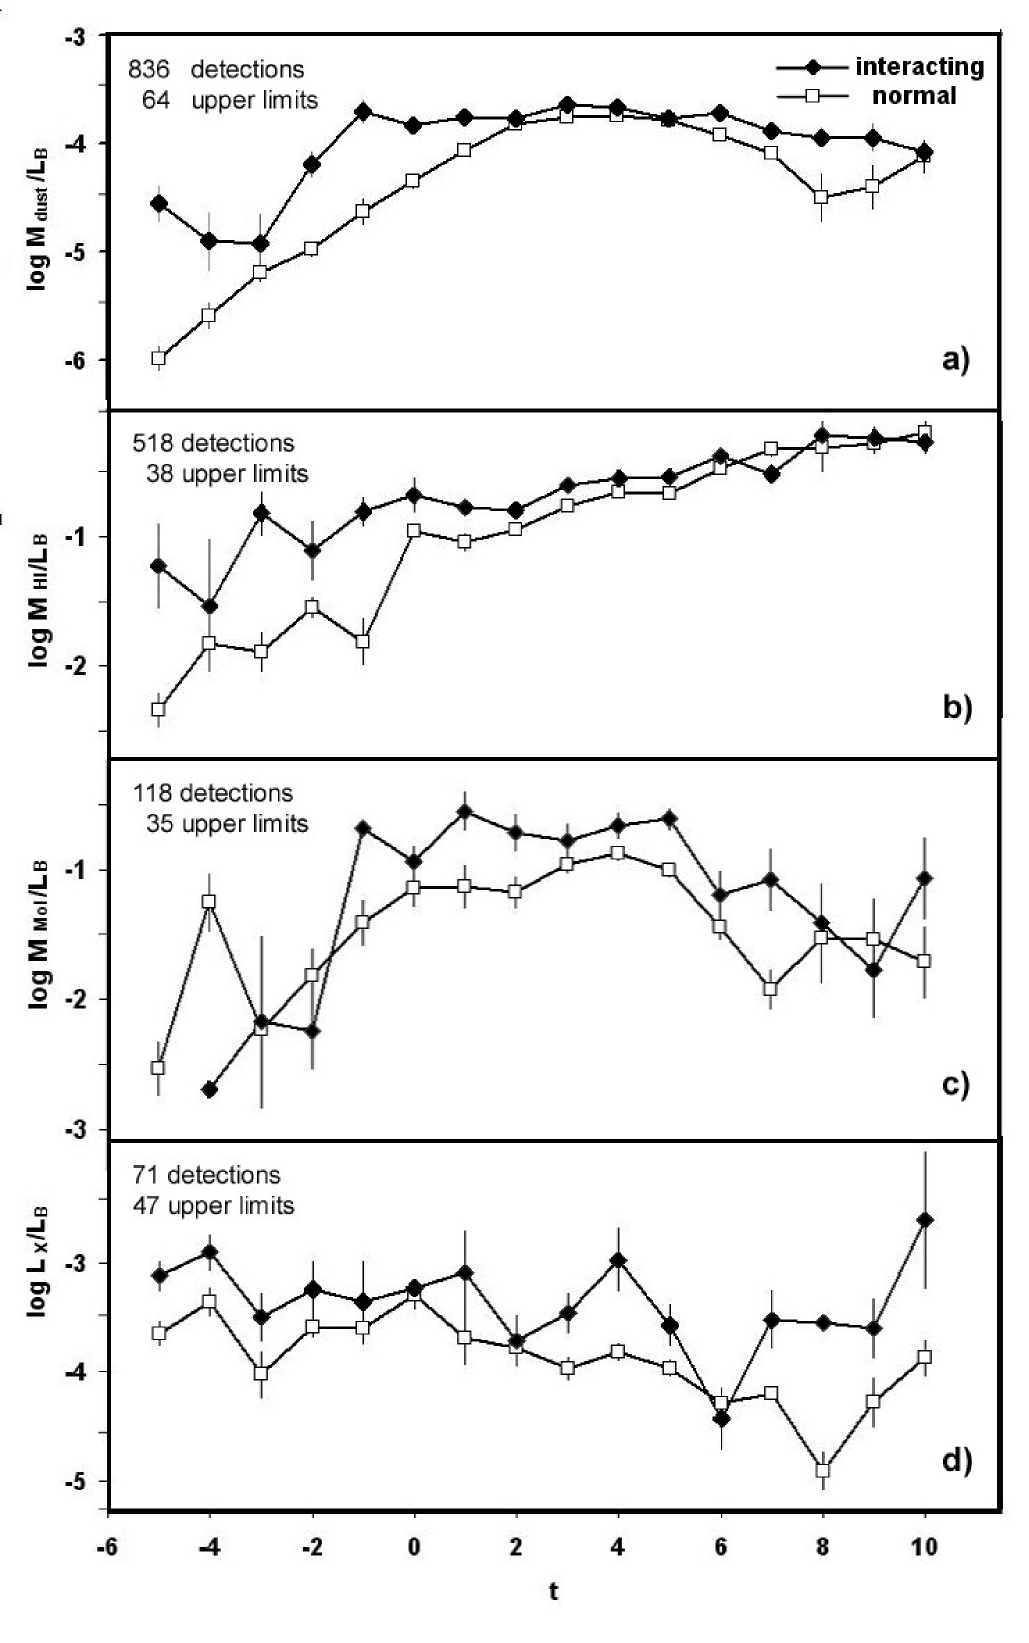
The mean values of gas content obtained with survival analysis for each tracer (dust, HI, molecular gas, X-ray) and for each morphological type are presented in Table 3 and Fig. 2. We tested the statistical significance of the differences found between interacting and normal galaxies samples applying a T-test to the mean values and an F-Test to the variances. The significance of the single values has also been checked by a test, assuming the values of normal galaxies as expected values. The results of all these tests are presented in Table 4.
Due to the different behaviour of galaxies with different t, we decided do not make the comparison between the two samples mixing together galaxies of all morphological types, as sometimes seen in the literature. For statistical tests only, we separated galaxies in two large categories that present similar properties in all the tracers, as explained in the next sections: early types (-5 t 0) and late types (1t10).
3.1 Dust and cold gas
The FIR fluxes at 60 and 100 m trace the warm dust content, at temperatures around 40 K. Most of the dust in galaxies is however colder, and can be studied analyzing the data from longer wavelength, from 100 to 200 m (Popescu et al. 2002). Our sample galaxies possess data essentially from IRAS observations, so we shall discuss their dust mass keeping in mind that the total values may be one order of magnitude greater. Given that our comparison with normal galaxies is made using similar data, our conclusions about the warm dust content should be consistent.
Looking at the Log Mdust/LB values obtained with survival analysis for each morphological type (Fig. 2a), one can see that the warm dust content is quite similar to that of normal galaxies for types later than t=2 (Sab) but higher for early type galaxies. Early type interacting galaxies have in mean a warm dust content one order of magnitude higher than normal galaxies of the same type. According to statistical tests (Table 4) the significance of this difference is high: the two samples of early type galaxies have mean values that differ by more than 95% of significance. They show however a similar dispersion of values (F-test). Late types show on the contrary a lower difference between normal and interacting galaxies and the similarity in dust content is stronger if the comparison is restricted to type from Sab to Sd, excluding Irregular galaxies (see the third line of Table 4).
This excess of mass content seen in early type galaxies is also evident for atomic gas (log MHI/LB, see Fig. 2b) but does not seem to be present as far as the molecular gas content is considered (log Mmol/LB, see Fig. 2c). The statistical tests show a significant difference for HI and a strong similarity for molecular gas. Ellipticals and S0 galaxies (t-1) have low values of Log Mmol/LB with respect to the sequence of spiral galaxies, but are based in total on 10 detections only, compared to 71 detections for early type systems in the sample of normal galaxies.
The mean Log MHI/LB for late type interacting galaxies appears similar to that of normal ones to an higher statistical significance. For these types, the differences between interacting and normal galaxies appear when log Mmol/LB is considered. The two samples show the same dispersion of values but mean molecular gas contents significantly different, being interacting galaxies richer than normal ones.
In the literature, Horellou & Booth (1997) find that the HI surface density in interacting galaxies, mediated over all the morphological types, is equal to 6.33 0.51 M⊙ Kpc-2. This value is lower of that found by Haynes & Giovanelli (1984) for ‘isolated’ galaxies, corresponding to 6.810.24. In this latter sample most part of detected galaxies are of morphological type from Sa to later. On the contrary, our values of Log MHI/D show that early type interacting galaxies have an higher HI content per Kpc2 than normal, as seen for Log MHI/LB curves plotted in Fig. 2b, while the values are similar for late-type. If we mediate our values from survival analysis over the morphological types we obtain a mean value of Log MHI/D= 6.7 0.3, based on 518 detections and 38 upper limits. This value increases to 6.9 0.2 if types from Sa to Irr only are considered. On the contrary, mediating all the Log MHI/D values published by Bettoni et al. (2003) and based on 891 detections and 220 upper limits, we find a mean Log MHI/D value of 6.5 0.62 that becomes 6.8 0.2 if late type galaxies only are considered. Both values of normal galaxies are consistent with that found by Haynes & Giovanelli (1984) in their sample of 288 detected galaxies.
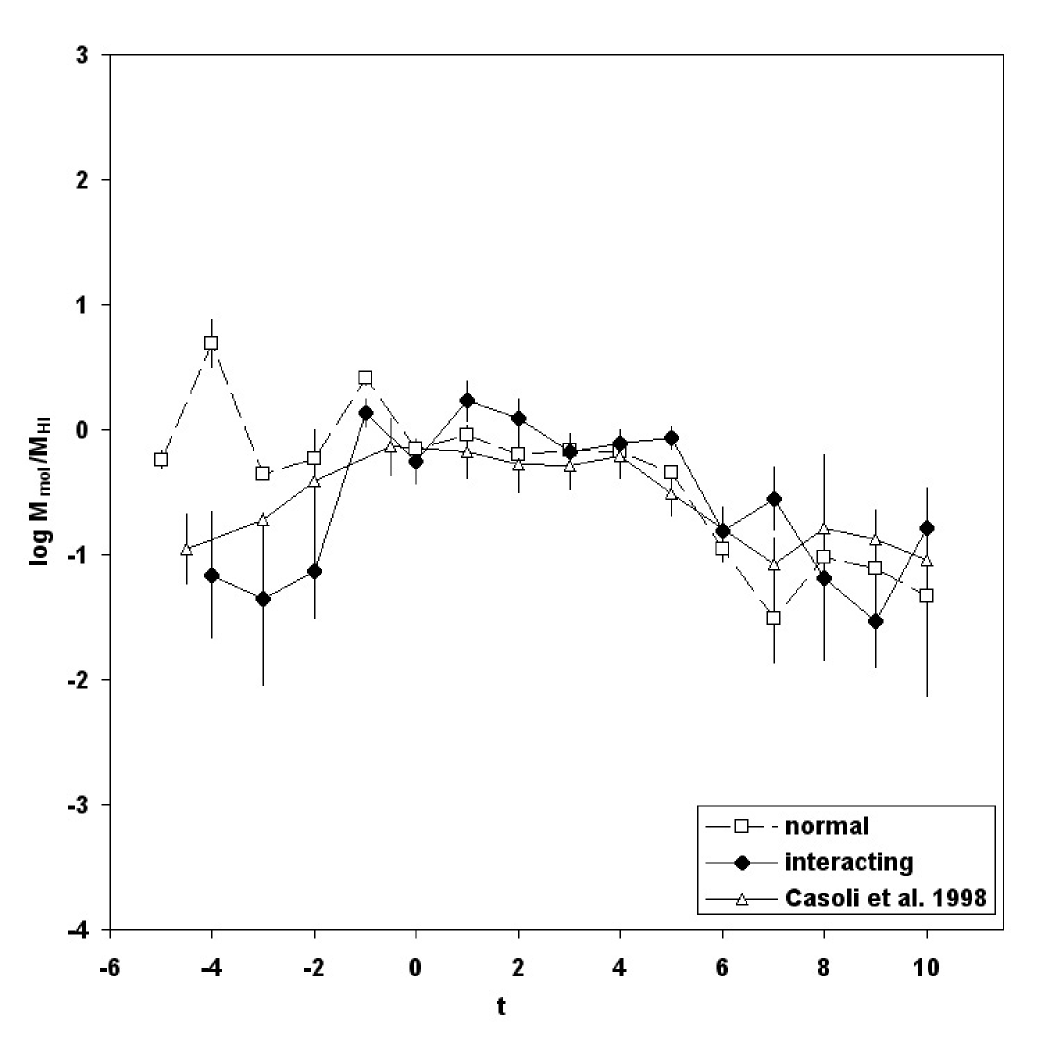
The change of the molecular/HI gas ratio with morphological type has been studied calculating (log Mmol/MHI) from the mean values of log Mmol/LB and log MHI/LB of Table 3. The resulting mol/HI ratio appears very low for early-type systems, if compared with those of normal galaxies (Bettoni et al. 2003) and similar to them for types later than -2. Similar low values for early type galaxies were found by Casoli et al. (1998). Looking at the papers cited as sources of their data (see in Casoli et al. 1998), we found that in their sample 126 galaxies out of 456 (28%) are peculiar, having disrupted structures (e.g. NGC 520) or polar rings (e.g. NGC 2685) or counter-rotations, all phenomena typical of interaction with the environment. This means that the Casoli et al. (1998) values are contaminated by the presence of these peculiar galaxies and that early-type interacting systems really have lower mol/HI values with respect to non-interacting, normal galaxies.
Resuming the above considerations, we find a difference in the colder component of those interacting galaxies classified early-type (t0) with respect to those classified as late-type (t0): the first ones have dust and HI overabundance, even with respect to their molecular gas, while the second are richer in molecular gas and are quite normal, on average, for dust and atomic gas content. This behavior may be due to the characteristics of the interaction and the subsequent evolution of the gas, as discussed later.
The fact that interacting galaxies have a luminosity function brighter than normal ones, as visisble in Fig. 1, strengthen our conclusion on gas overabundances. In fact, the adopted normalisation factor LB should reduce the log M/LB for interacting galaxies, contrary to what observed.
3.2 X-ray emission
To study the component at higher energy of these galaxies, we analyzed the properties of the X-ray emission and the presence of Active Galaxy Nuclei by the Véron-Cetty & Véron (2003) catalogue. Among our sample galaxies, 71 or 7% are classified as AGN. This percentage is similar to that found for the sample of normal galaxies (Bettoni et al. 2003), i.e. 8%, so in this respect the strongly interacting galaxies do not appear to be different from normal ones. In Figure 2 we note that the survival analysis mean values are always higher than that of normal galaxies (including AGN). It is clear that many AGN have high values of Log LX/LB, but looking at the single points, one can see that the rest of interacting galaxies also has higher log LX/LB values than normal galaxies, independent from the morphological type.
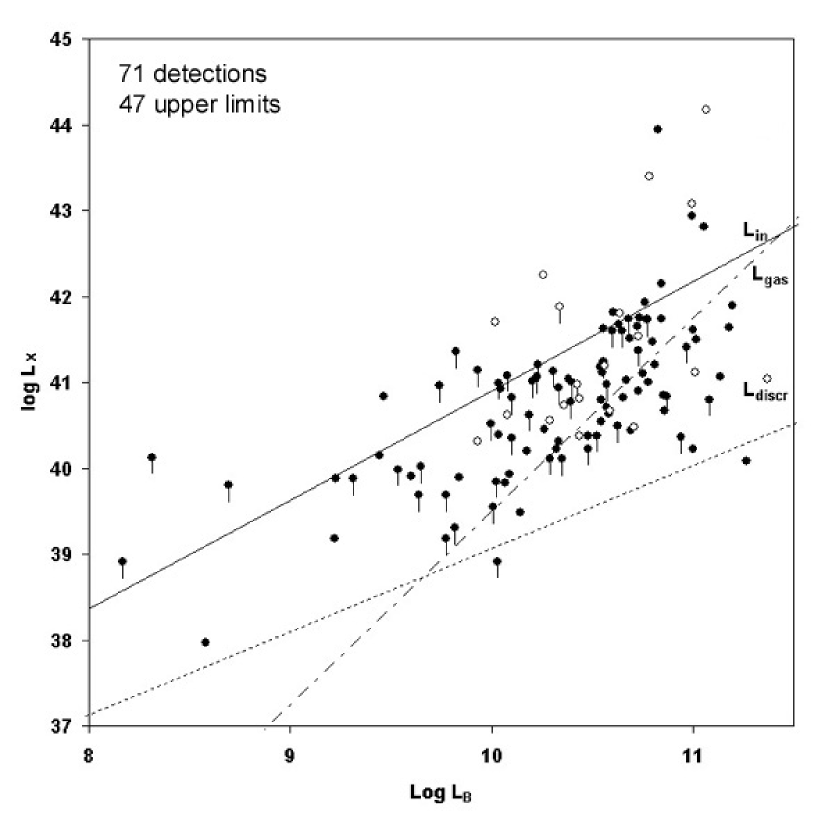
To understand the origin of the emission, we plotted the log LX of the single galaxies versus log LB and we compared the observed values with theoretical expectations. In the plot the representative points of galaxies hosting nuclear activity are distinguished by open symbols. In Figure 4 the lines corresponding to the X-ray emission foreseen for diffuse gas (labeled Lgas) and from discrete sources inside the galaxy (Ldiscr) are plotted. In the first case, the X-ray luminosity would be proportional to the square of blue luminosity LB while in the second one it would be directly proportional to LB (Ciotti et al. 1991). Most of our non-AGN galaxies are clustered around the line expected from emission of diffuse gas. Their luminosity is lower than the values expected for cooling flows (line labeled Lgas) assuming a SN rate of 0.18 (Cappellaro, Evans, & Turatto 1999). Both these aspects are consistent with the hypothesis that this X-ray flux derives from gas stripped from the galaxies by ram pressure during their motion or, alternatively, from gas emitted by SN winds in the intergalactic space.
The origin of this gas has been studied in detail in the literature for some of our systems: Davis et al. (1996) found a diffuse X-ray emitting gas confined near the center of the NGC 2300 group (Arp 114) in addition to point sources localized on the single galaxies. The presence of diffuse gas in a common potential well is a feature visible in other galaxy pairs (Henriksen & Cousineau 1999) but some cases (e.g. Arp 116 = NGC 4647/49) have X-ray emission coming from a single member of the pair only. Given the various X-ray morphologies, a common model in the origin of the X-ray emitting gas is difficult to apply to all our interacting galaxies.
| Tracer | Type | k | P() | P(T-Test) | P(F-Test) | |
|---|---|---|---|---|---|---|
| Dust | early | 13.39 | 5 | 98.0% | 95.9% | 24.2% |
| Dust | late | 8.29 | 9 | 49.5% | 94.9% | 93.4% |
| Dust | Sab-Sd | - | - | - | 84.6% | 95.6% |
| HI | early | 16.58 | 5 | 99.5% | 98.7% | 54.6% |
| HI | late | 5.25 | 9 | 18.8% | 49.3% | 67.5% |
| mol | early | 19.47 | 4 | 99.9% | 2.7% | 65.4% |
| mol | late | 21.34 | 9 | 98.9% | 94.5% | 29.2% |
| X-ray | early | 14.95 | 5 | 99.0% | 97.6% | 37.3% |
| X-ray | late | 47.26 | 9 | 100.0% | 99.5% | 63.3% |
3.3 Star formation
In spiral galaxies (and probably only in part in early-types galaxies) the FIR luminosity is connected with the massive star formation rate (Devereux & Hameed 1997). An enhanced stellar formation in interacting galaxies, already known in the literature, is also visible in Figures 5 and 6.
In the first one, interacting galaxies often appear more luminous in infrared than normal ones, but with a large spread of values. High FIR luminosity is evident in those systems with no morphological classification (right edge of the Figure). These latter are often systems with disrupted morphology, probably in a phase of strong merging, that appear to also be actively star-forming. We must note, however, that also normal galaxies (i.e. non-perturbed, with no polar ring or known kinematical decoupling between gas and stars) may exhibit high values of star formation rate, even those classified as ellipticals.
The star formation efficiency (Fig. 6) appears with a similar dispersion of values. Despite a higher FIR luminosity and star formation rate, the interacting galaxies however do not seem to be more efficient in forming stars. The two distributions intersect together but with a clear deviation of interacting systems toward higher levels of LFIR. This effect is different from that found by Solomon & Sage (1988); Horellou et al. (1999) and by Combes et al. (1994) which suggest, for interacting pairs, an higher efficiency in forming stars than pairs with larger separation. However, Combes et al. (1994) find that in their sample of paired galaxies log LFIR/M(H2) does not change in function of the separation between components. The range of SFE values of our galaxies is larger than that of the previous authors and covers the differences found by them. This may explain our lack of differences between our samples of interacting and normal galaxies. In our data, even binning the interacting galaxies in groups of different separation (i.e. merging, semidetached components, separated components with tails or bridges, single galaxies), the plot of Figure 6 does not change and the groups have representative points mixed together. At the same time, there are no apparent dependences from the morphological type t, including the unclassified objects (t=11).
4 Conclusions
The category of galaxies considered in this paper is a zoo containing several types of objects, going from galaxies observed during a close encounter (e.g. M51) to merging systems (e.g The Antennae) or galaxies relatively isolated but still perturbed after a past encounter (e.g. M82). The spread of values found here and in the literature may derives from the fact that different kind of perturbations generate different effects in galaxies.
We find that the morphological type also have a role in determining the properties of these stellar systems and that may be not correct to mix together interacting galaxies of all morphological types.
In addition, the comparison with the literature is complicated by the fact that very often authors use as ‘normal’ galaxies a list of objects that contains known cases of peculiar galaxies. For instance, in Table 3 of Devereux & Hameed (1997) is visible NGC 660, a disrupted polar ring galaxy. Haynes & Giovanelli (1984) include several Arp and VV galaxies while Casoli et al. (1998) present a sample containing many dynamically peculiar galaxies. The data of these papers have been used by other authors to deduce properties of peculiar galaxies in comparison with ‘normal’ ones. The sample of normal galaxies by Bettoni et al. (2003) used here may also contains galaxies that in the future may be discovered as ’peculiar’, but have been already cleaned by all the known cases of interacting and dynamically peculiar galaxies known.
From our data, we see that interacting or disturbed galaxies have always more gas than normal ones, and that this gas is mainly in the form of atomic hydrogen in early type systems, while it is in molecular form for galaxies of latest types. All have a higher X-ray luminosity. Because of these differences, we shall discuss the early type systems separately from the spiral ones, comparing our finding with that from literature.
A galaxy that appears now as an elliptical may be in the final stage of a merging process, after the complete fusion of the stellar content of two galaxies. Alternatively, it may be a galaxy deprived of the gas because of a close encounter with a more massive one. In both processes, one may expect that the pre-existing gas in the two systems would be heated, with the conversion of molecular gas in atomic form and by the creation of an X-ray component. This scenario agrees with the higher HI and X-ray content found in interacting early type galaxies.
A more complicated scenario appears from the data concerning galaxies classified as spirals. In these systems the mean HI and dust content seems to be similar to that of an unperturbed, normal galaxy of the same morphological type. In addition to the excess in X-ray luminosity, these galaxies seem to have a molecular gas content always one order of magnitude higher that that of normal galaxies. There are two possible explanation for this effect.
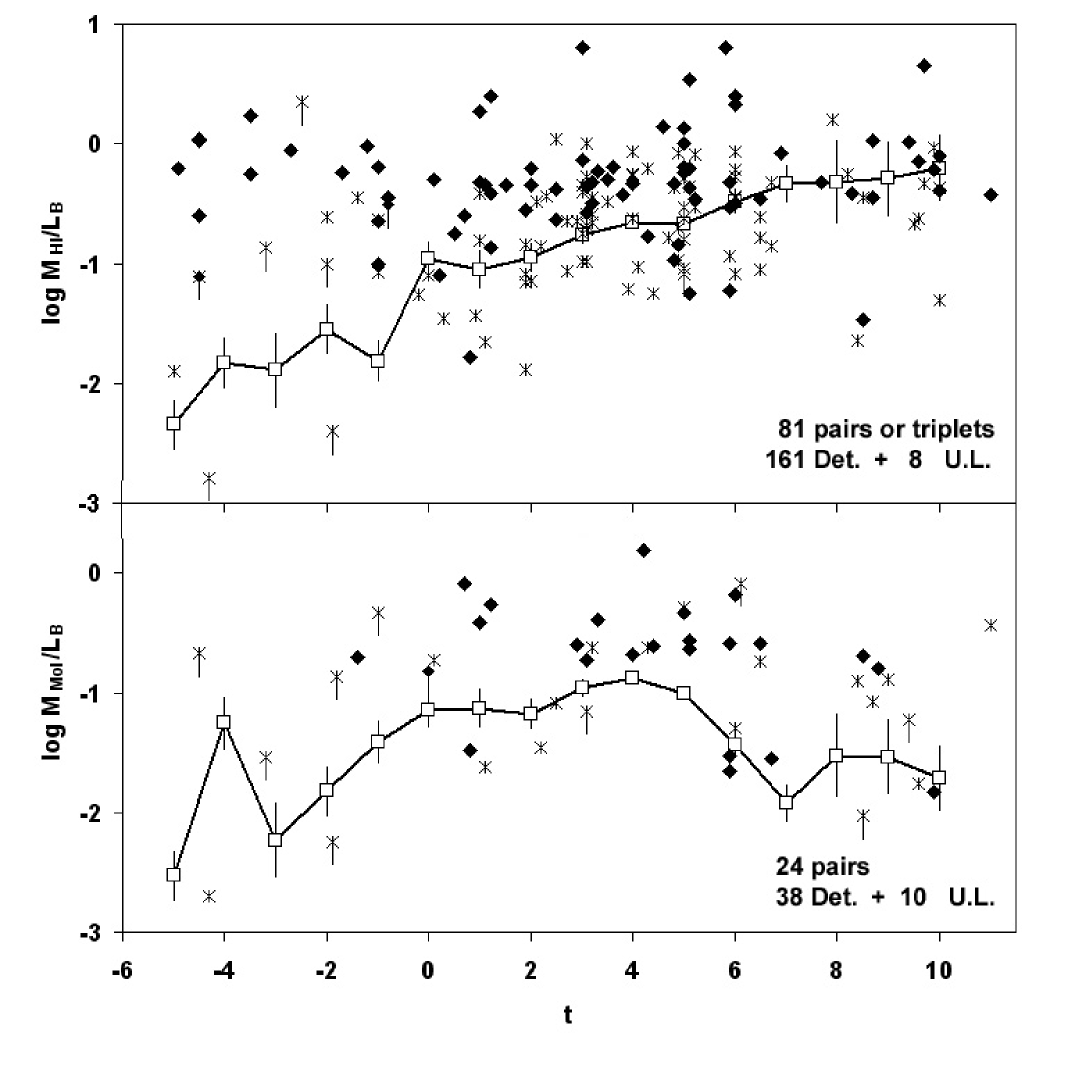
The first possibility is that during the collision the galaxies stimulate a gas inflow by means of gravitational torques, that enhance the CO luminosity because of a massive accumulation of molecular gas. This hypothesis has been presented by Combes et al. (1994) to explain the observed characteristics of a sample of 51 paired galaxies, whose interacting subsample appears more luminous in CO line than the remaining binaries with higher separation. We tested the idea that the gas is simply exchanged by the two components of the same pair, enriching one of them and depauperating the other. We call these galaxies primary and secondary respectively. In our sample there are 179 galaxies in interacting pairs or triplets where the single galaxies are separated and have literature data at 21cm or CO lines. Plotting in Figure 7 (upper panel) the values of log MHI/LB of these galaxies only and identifying with different symbols the primary and the secondary member, one can see that spirals which are primary members have -on mean- higher values than normal galaxies of same morphological type. On the contrary, the secondary members, of whatever morphological type, have values generally lower, below that of normal galaxies. This is in agreement with the idea that part of atomic gas has been transferred between them. However, this is not true when log Mmol/LB values are considered (Figure 7, lower panel): in this case, the primary members of the pair show an excess of molecular mass and the secondary members have in general values near or over the mean curve of normal galaxies. We may suppose that less dense, atomic gas, may be exchanged during an encounter more easily than the molecular gas, condensed in clouds. The existence of a molecular mass excess in these paired galaxies is then difficult to explain supposing a simple transfer during the close encounter.
The second, completely different possibility is that the molecular gas excess is not real but due to different physical conditions inside the galaxy. In the totality of cases presented here the Mmol is determined from CO line luminosities, transformed in solar masses adopting a X conversion factor, as explained in Section 2.1. This value depends on the metallicities or on the physical conditions of the molecular gas and in different kind of galaxies may assume a wide range of values (see the discussion in Section 2.2). An overestimate of the molecular mass may derives by the assumption of a X factor lower than real. among the various possibility, the presence of gas of high temperature may overestimate the H2 mass. However, in some well known cases present in our sample, such as the already cited ‘Antennae’ or ‘Atoms for Peace’ (PGC 68612), believed to be the result of a two spirals merger, the H2 mass excess is accompanied by an HI mass excess. Similarly the ‘Whirlpool galaxy’ M51 and its satellite (PGC 47404 and PGC 47413), show an excess of gas mass. In cases like these, we may think that the gas excess is real for the molecular component like it is for the atomic one.
Another suggestion on the reality of the higher molecular masses comes from the analysis of the star formation rates and efficiencies: interacting galaxies appear more luminous in the infrared (Fig. 5) because of the higher number of newly formed stars heating the dust (Thronson & Telesco 1986). This higher star formation rate does not correspond to a different efficiency in star formation per unit of calculated H2 mass. This may be explained if the higher star formation is simply due to a higher molecular gas quantity. Higher H2 mass and concentration in perturbed galaxies was already suggested by Braine & Combes (1993). In our data, the large spread of data in Figure 6 may indicate that the X conversion factor is different between galaxies but even in this hypothesis, the range of variation inside interacting galaxies does not appear different from that of normal, non interacting stellar systems. Our conclusion are different with the higher SFE found in interacting galaxies by previous authors (Solomon & Sage 1988; Combes et al. 1994; Horellou et al. 1999). As discussed before, their comparison sample contains peculiar galaxies and the large spread of values found in our sample cover the differences found by them. We must conclude that, with the present data, our sample of interacting galaxies appears richer in molecular gas and in some cases also in atomic gas.
It is not clear from where this mass excess originates. An excess of gas, both atomic and molecular, of one order of magnitude is known in the literature for another class of peculiar objects: the polar ring galaxies (Bettoni et al. 2001). In that case, the matter forming the ring is accreted from outside. May this also be the case of interacting galaxies?
Acknowledgements.
The authors thanks Dr. C. Horellou for her useful suggestions during the revision of this paper. This research made use of LEDA database, the Vizier service (Ochsenbein, Bauer, & Marcout 2000), the SIMBAD database (operated at CDS, Strasbourg, France), the NASA/IPAC Extragalactic Database (NED) (which is operated by JPL, California Institute of Technology, under contract to NASA) and NASA’s Astrophysics Data System Abstract Service (mirrored in CDS of Strasbourg). GG made use of funds from the University of Padova (Fondi 60%-2003).References
- Andreani, Casoli & Gerin (1995) Andreani, P., Casoli, F. & Gerin, M. 1995, A&A, 300, 43
- Arp (1966) Arp, H. 1966, Pasadena: California Inst. Technology, 1966,
- Arp & Madore (1987) Arp, H. C. & Madore, B. F. 1987, Cambridge Univ. Press, 1 (1987), 1
- Athanassoula (2002) Athanassoula, E. 2002, ApSS, 281, 39
- Bendo & Barnes (2000) Bendo, G. J. & Barnes, J. E. 2000, MNRAS, 316, 315
- Bertola & Galletta (1978) Bertola, F., Galletta, G., 1978, ApJ 226, L115
- Bettoni et al. (2001) Bettoni, D., Galletta, G., García-Burillo, S. Rodríguez-Franco, A.,2001, A&A, 374, 421
- Bettoni et al. (2003) Bettoni, D., Galletta, G., García-Burillo, S. 2003, A&A, 405, 5
- Beuing et al. (1999) Beuing, J., Döbereiner, S., Böhringer, H., Bender, R., 1999, MNRAS, 302, 209
- Boselli (2001) Boselli, A. 2001, ESA SP-460: The Promise of the Herschel Space Observatory, 357
- Boselli et al. (1995) Boselli, A., Gavazzi, G., Lequeux, J., Buat, V., Casoli, F., Dickey, J. & Donas, J. 1995, A&A, 300, L13
- Boselli et al. (2002) Boselli, A., Lequeux, J., & Gavazzi, G. 2002, ApSS, 281, 127
- Bregman et al. (1992) Bregman, J.N., Hogg, D.E., Roberts,M.S., 1992, ApJ, 387, 484
- Braine & Combes (1993) Braine, J., Combes, F., 1993, A&A, 269, 7
- Burstein et al. (1997) Burstein, D., Jones, C., Forman, W., Marston, A.P., Marzke, R.O., 1997, ApJS, 111, 163
- Cappellaro, Evans, & Turatto (1999) Cappellaro, E., Evans, R., & Turatto, M. 1999, A&A, 351, 459
- Casoli et al. (1991) Casoli, F., Boissé, P., Combes, F. & Dupraz, C. 1991, A&A, 249, 359
- Casoli et al. (1998) Casoli, F., Sauty, S., Gerin, M., Boselli, A., Fouqué, P., Braine, J., Gavazzi, G., Lequeux, J., Dickey, J. 1998, A&A, 331, 451
- Ciotti et al. (1991) Ciotti, L., Pellegrini, S., Renzini, A., & D’Ercole, A. 1991, ApJ, 376, 380
- Corsini & Bertola (1998) Corsini, E. M. & Bertola, F. 1998, Journal of Korean Physical Society, 33, 574
- Combes et al. (1994) Combes, F., Prugniel, P., Rampazzo, R., Sulentic, J.W. 1994, A&A, 281, 725
- Davis et al. (1996) Davis, D. S. Mulchaey, J. S., Mushotzky, R. F., Burstein, D., 1996, ApJ, 460, 601
- de Vaucouleurs et al. (1991) de Vaucouleurs G., de Vaucouleurs A., Corwin H.G., Buta R.J., Paturel G., Fouque P., 1991, Third Reference Catalogue of Bright Galaxies (RC3), Springer-Verlag: New York
- Devereux & Young (1991) Devereux, N. A. & Young, J. S. 1991, ApJ, 371, 515
- Devereux & Hameed (1997) Devereux, N. A. & Hameed, S. 1997, AJ, 113, 599
- Dressler et al. (1997) Dressler, A. et al. 1997, ApJ, 490, 577
- Fabbiano et al. (1992) Fabbiano, G., Kim, D.-W., Trinchieri, G., 1992, ApJS, 80, 531
- Feigelson & Nelson (1985) Feigelson, E.D., & Nelson, P.I., 1985, ApJ, 293, 192
- Galletta (1996) Galletta, G., 1996, in Barred Galaxies, IAU Coll 117, ed Buta R., Crocker D.A. Elmegreen B.G., ASP Conf. Ser. 91, 429
- Gerin & Casoli (1994) Gerin, M. & Casoli, F. 1994, A&A, 290, 49
- Haynes & Giovanelli (1984) Haynes, M. P. & Giovanelli, R. 1984, AJ, 89, 758
- Henriksen & Cousineau (1999) Henriksen, M. & Cousineau, S. 1999, ApJ, 511, 595
- Horellou, Casoli & Dupraz (1995) Horellou, C., Casoli, F. & Dupraz, C. 1995, A&A, 303, 361
- Horellou & Booth (1997) Horellou, C., Booth, R.,S. 1997, A&AS, 126, 3
- Horellou et al. (1999) Horellou, C., Booth, R., S. & Karlsson, B. 1999, ApSS, 269, 629
- Kim & Fabbiano (2003) Kim, D. & Fabbiano, G. 2003, ApJ, 586, 826
- Knapp et al. (1989) Knapp, G.R., Guhathakurta, P., Kim, D.-W., Jura, M., 1989, ApJS 70, 329
- Kormendy and Richstone (1995) Kormendy J., Richstone D., 1995, ARAA, 33, 581
- Lavezzi et al. (1999) Lavezzi, T. E., Dickey, J. M., Casoli, F., Kazés, I., 1999, AJ, 117, 1995
- Lonsdale et al. (1984) Lonsdale, C. J., Persson, S. E., & Matthews, K. 1984, ApJ, 287, 95
- Maloney & Black (1988) Maloney, P., Black, J.H. 1988, AJ, 325, 389
- Nishiyama & Nakai (2001) Nishiyama, K., Nakai, N., 2001 PASJ, 53, 713
- Ochsenbein, Bauer, & Marcout (2000) Ochsenbein, F., Bauer, P., & Marcout, J. 2000, A&AS, 143, 23
- O’Sullivan et al. (2001) O’Sullivan, E., Forbes, D. A., Ponman, T. J., 2001, MNRAS, 328, 461
- Paturel et al. (1997) Paturel, G., Andernach, H., Bottinelli, L., Di Nella, H., Durand, N., Garnier, R., Gouguenheim, L., Lanoix, P., Martinet,M.C., Petit, C., Rousseau, J., Theureau, G., Vauglin, I., 1997, A&AS, 124, 109 (LEDA - http://leda.univ-lyon1.fr/)
- Popescu et al. (2002) Popescu, C. C., Tuffs, R. J., Völk, H. J., Pierini, D., & Madore, B. F. 2002, ApJ, 567, 221
- Roberts et al. (1991) Roberts, M., Hogg, D.E., Bregman, J.N., Forman, W.R., Jones, C., 1991, ApJS, 75, 751
- Sage (1993) Sage, L. J. 1993, A&A, 100, 537
- Sage (1993) Sage, L. J. 1993, A&A, 272, 123
- Sanders & Mirabel (1996) Sanders,D. B., Mirabel, I. F., 1996, ARA&A, 34, 749
- Solomon & Sage (1988) Solomon, P. M:, & Sage, L. J. 1988, ApJ, 334, 613
- Schweizer et al. (1983) Schweizer, F., Whitmore, B. C., Rubin, V. C., 1983, AJ, 88, 909
- Strong et al. (1988) Strong, A. W., Bloemen, J. B. G. M., Dame, T. M. et al. 1988, A&A, 207, 1
- Thronson & Telesco (1986) Thronson, H. A. Jr., Telesco, C. M., 1986, ApJ, 311, 98
- Van Driel et al. (2000) van Driel, W., Ragaigne, D., Boselli, A., Donas, J., & Gavazzi, G. 2000, A&AS, 144, 463
- Véron-Cetty & Véron (2003) Véron-Cetty, M.-P. & Véron, P. 2003, A&A, 412, 399
- Vorontsov-Velyaminov (1959) Vorontsov-Velyaminov, B. A. 1959, Atlas and catalog of interacting galaxies (1959), 0
- Welch & Sage (2003) Welch, G. A.; Sage, L. J., 2003, ApJ, 584, 260
- Whitmore et al. (1990) Whitmore, B.C., Lucas, R.A., McElroy, D.B., Steiman-Cameron, T.Y., Sackett, P.D., Olling, R.P., 1990, AJ, 100, 1489
- Wiklind, Combes & Henkel (1995) Wiklind, T., Combes, F. & Henkel, C. 1995, A&A, 297, 643
- Young et al. (1995) Young, J. S. Xie Shuding, Tacconi, L. J., et al. 1995, ApJS, 98, 219
- Zhu et al. (1999) Zhu, M., Seaquist, E. R., Davoust, E., Frayer, D. T., & Bushouse, H. A. 1999, AJ, 118, 145
5 Appendix A: References to Table 2.
| code | Source of data | ISM |
| tracer | ||
| 1a | Andreani, Casoli & Gerin (1995) | HI |
| 1b | Andreani, Casoli & Gerin (1995) | CO |
| 2 | Beuing et al. (1999) | X-ray |
| 3 | Bregman et al. (1992) | CO |
| 4 | Burstein et al. (1997) | X-ray |
| 5a | Casoli et al. (1991) | HI |
| 5b | Casoli et al. (1991) | CO |
| 6 | Casoli et al. (1998) | CO |
| 7 | Fabbiano et al. (1992) | X-ray |
| 8a | Horellou, Casoli & Dupraz (1995) | HI |
| 8b | Horellou, Casoli & Dupraz (1995) | CO |
| 9 | Knapp et al. (1989) | IR |
| 10a | Lavezzi et al. (1999) | IR |
| 10b | Lavezzi et al. (1999) | HI |
| 10c | Lavezzi et al. (1999) | CO |
| 11a | LEDA (Paturel et al. 1997) | IR |
| 11b | LEDA (Paturel et al. 1997) | HI |
| 12a | NASA/IPAC Extragalactic Database (NED) | IR |
| 12b | NASA/IPAC Extragalactic Database (NED) | HI |
| 12c | NASA/IPAC Extragalactic Database (NED) | X-ray |
| 13 | O’Sullivan et al. (2001) | X-ray |
| 14a | Roberts et al. (1991) | IR |
| 14b | Roberts et al. (1991) | HI |
| 14c | Roberts et al. (1991) | CO |
| 14d | Roberts et al. (1991) | X-ray |
| 15a | Sage 1993 | HI |
| 15b | Sage 1993 | CO |
| 16 | Van Driel et al. (2000) | HI |
| 17a | Welch & Sage (2003) | HI |
| 17b | Welch & Sage (2003) | CO |
| 18 | Wiklind, Combes & Henkel (1995) | CO |
| 19 | Young et al. (1995) | CO |
| 20 | Zhu et al. (1999) | CO |