Calibrated stellar models for metal-poor populations
We extend to lower metallicities recent evolutionary computations devoted to Magellanic Clouds stars, presenting and discussing new stellar models with Z=0.0002, 0.0004, 0.0006, 0.001 and suitable assumptions about the original He content. As in the previous paper, evolutionary results are compared with observational data to properly calibrate the assumptions about the efficiency of the surface convection. On this basis, we follow the evolution of stellar models in the mass range 0.6 to 11M⊙ from the Main Sequence (MS) to the C ignition or the onset of thermal pulses in the advanced Asymptotic Giant Branch (AGB) phase, presenting cluster isochrones covering the range of ages from 20 Myr to 20 Gyr. Selected predictions constraining the cluster ages are discussed, presenting a calibration of the difference in magnitude between the luminous MS termination and the He burning giants in terms of the cluster age. Both evolutionary tracks and isochrones are available at the URL http://astro.df.unipi.it/SAA/PEL/Z0.html111Data files are also available at the CDS.
Key Words.:
stars:evolution, globular clusters:general, open clusters and associations:general1 Introduction
In modern astrophysics, stellar clusters play the role of cosmic clocks marking the history of star populations in the Galaxy. Beyond the Galaxy, improved observational capability has already opened the study of stellar clusters in nearby galaxies, such as the Small and Large Magellanic Clouds, giving access to the history of star formation in the Universe. However, a precise determination of the ages of stellar clusters is still a problem addressed by several authors, investigating both the old Galactic globulars (see e.g. Chaboyer 2001, Salaris & Weiss 2002) and the more recent disk population (see e.g. Carraro et al. 1999, Chaboyer et al. 1999). Thus, there is the need for extensive evolutionary calculations covering suitable grids of chemical compositions and ages.
In a previous paper (Castellani et al. 2003, Paper I) we presented evolutionary results for the Magellanic Cloud (LMC, SMC) chemical composition, prepared for the analysis of new HST observations of the intermediate-age LMC globular NGC1866 (Brocato et al. 2003). The investigation of the deep color-magnitude (CM) diagram of stellar populations in the Carina dwarf galaxy (Monelli et al. 2003) has recently suggested the extension of such evolutionary analysis to lower metallicities. In this paper we present these new results, discussing the justification for several choices made when constructing these stellar models and comparing the results with similar computations available in the recent literature.
The reasons for presenting new theoretical computations have been discussed in Paper I, so they will only be stated briefly here. As a central point, the present set of models is currently the only one covering the phases of both H and He burning over a large range of masses with the inclusion of atomic diffusion of helium and heavy elements. This process has been demonstrated to sensitively affect the evolution of low mass stars, with consequences for the estimated ages of old clusters (see, e.g., Castellani & Degl’Innocenti 1999, VandenBerg et al. 2002). We use throughout the canonical assumption of inefficient overshooting so the He burning structures are calculated according to the prescriptions of canonical semiconvection induced by the penetration of convective elements in the radiative region (Castellani et al. 1985). In the case of low mass stars this gives lifetimes for Horizontal Branch (HB) stars in better agreement with observational constraints than do overshooting models (see Paper I).
Since the occurrence and/or the amount of overshooting in more massive stars is still a debated question (see e.g. Bertelli et al. 2003 and references therein, Brocato et al. 2003), the availability of a set of canonical metal-poor models will be useful to further investigate this point. Moreover, as discussed in Appendix A, the present models are the only ones based on the most updated physics available in the literature. This does not necessarily imply that the updated physical inputs produce the most reliable models, but only that our models represent an updated approach to the difficult problem of stellar modeling (see e.g. Castellani et al. 2001).
2 Model tests and calibrations
| cluster | photometry | E(B-V) | Z | ||||
|---|---|---|---|---|---|---|---|
| NGC4590 (M68) | Walker (1994) | 0.040.09 | -2.090.11 | -2.06 | -1.990.10 | 0.20 | 2.0; 2.1; 2.510-4 |
| NGC5272 (M3) | Rey et al. (2001) | 0.010.03 | -1.660.06 | -1.57 | -1.340.06 | 0.26 | 5.9; 7.3; 12.310-4 |
| NGC6205 (M13) | Rey et al. (2001) | 0.010.03 | -1.650.06 | -1.54 | -1.390.06 | 0.28 | 6.3; 8.1; 11.410-4 |
The theoretical background and the input physics adopted in our code have been discussed in Paper I (see also Ciacio et al. 1997 and Cassisi et al. 1998) and are listed in Appendix A. We only point out here that our models include atomic diffusion, including the effects of gravitational settling, and thermal diffusion with diffusion coefficients given by Thoul et al. (1994) while radiative acceleration (see e.g. Richer et al. 1998, Richard et al. 2002) is not taken into account. For convective mixing, we adopt the Schwarzschild criterion to define regions in which convection elements are accelerated (see the description in Brocato & Castellani 1993). It is known that diffusion is a slow process; for masses of about 3 M⊙ or higher (that is for clusters of ages lower that about 350 Myr) its influence is negligible. Effects of rotation (see e.g. Maeder & Zahn 1998, Palacios et al. 2003) are not included in our models.
As in previous papers, to assess the adequacy of the predicted evolutionary scenario we follow the procedure of submitting stellar models to a preliminary test to calibrate the mixing length parameter governing the efficiency of convection at the surface of a stellar structure and, thus, the predicted effective temperature of stars with convective envelopes.
Following this procedure, our models have been satisfactorily tested relative to Solar Standard Models (SSM; see e.g. Degl’Innocenti et al. 1997), young metal-rich galactic clusters with Hipparcos parallaxes (Castellani et al. 2001, Castellani et al. 2002) and moderately metal-rich galactic globulars (Paper I). We have adopted – in all cases – a ratio between the mixing length and the local pressure scale height of = l/Hp . Here we note that SSM requires element diffusion, so the calibration of with solar models without diffusion does not appear meaningful. The same models also provided a satisfactory fit for young globulars in the LMC (Brocato et al. 2003).
For metal-poor stars, one finds in the Galactic globulars the natural candidates for a further test. In Cassisi et al. (1999) we fitted our low mass stellar models to globular clusters adopting for metallicities Z , but for Z. As we will discuss in this section, the increased accuracy of available CM diagrams allows us to submit the above calibration to even more stringent tests, investigating in particular the disturbing evidence for the need for a larger mixing length only for clusters with a metallicity of about Z.


To this purpose we searched in literature for well observed, not too heavily reddened globular clusters for which good (V, B-V) diagrams are available and with [Fe/H] values in the range explored in this paper. We consequently selected (as in Cassisi et al. 1999) M68 as a suitable sample of the most metal-poor clusters, but now adding the very accurate CM diagrams recently made available by Rey et al. (2001) for the moderately metal-rich clusters M3 and M13. Table 1 lists the three selected clusters together with the source of the photometric data, the range of values for the reddening available in the recent literature, current estimates for [Fe/H] and for the amount of -enhancement.
As is well known, the effect of the -enhancement on the evolutionary tracks and isochrones of Population II stars can be simulated by using a scaled solar mixture corresponding to the actual total metallicity. Isochrones calculated with enhanced elements are very well mimicked in all the main characteristics by the standard solar mixture isochrones of metallicity: Z=Z0(0.638fα + 0.632) where fα=10[α/Fe] and Z0 is the initial (nonenhanced) metallicity (see e.g. Salaris et al. 1993, Salaris & Weiss 1998). The last column in Table 1 gives these “equivalent Z” as evaluated on the basis of [Fe/H] values according to well known relations and by adopting the recent determination [Z/X]⊙=0.0230 (see e.g. Bahcall et al. 2001).
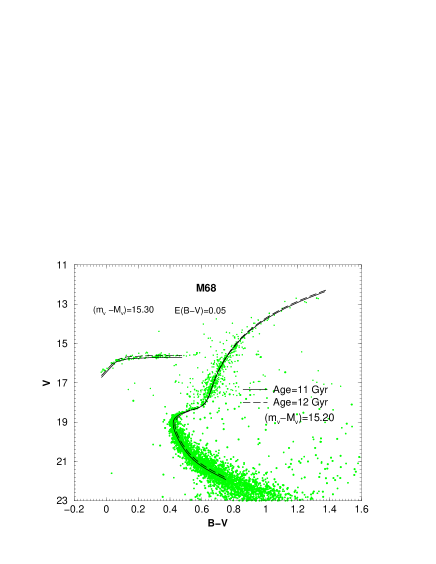
Data in Table 1 show that cluster metallicities are in general far from being firm observational results. For the most metal-poor cluster, M68, the uncertainty is still tolerable and the actual metallicity can be safely put around the value Z=0.0002. As already found, Fig.1 shows that adopting this metallicity the best fit of the clusters requires = 2.0 with an age of 11 Gyr. As in previous works, the fitting has been performed making use of the predicted HB luminosity to constrain the cluster distance modulus and, consequently, the cluster age. However, one may be reluctant to rely uncritically on such a theoretical prediction, since HB models are much more dependent on uncertaintes in the physical inputs than TO and subgiant branch (SGB) models. In this context evidence from the pulsational behavior of RR Lyrae variables in galactic globulars has already indicated that perhaps (i.e. if pulsational theory is taken as face value) our theoretical HB are too bright, even if by only 0.05 mag (Marconi et al. 2003). The discrepancy increases for models without diffusion. However, Fig.1 also shows that the calibration of is not dramatically dependent on the assumed cluster distance modulus. Decreasing the distance modulus by 0.1 mag to 15.20 one would derive a cluster age of 12 Gyr with the same . Here we note that the distance modulus so derived for the cluster appears in good agreement with the results by Carretta et al. (2000, but see also Gratton et al. 1997) who used Hipparcos parallaxes to obtain (mv-Mv)=15.250.06.
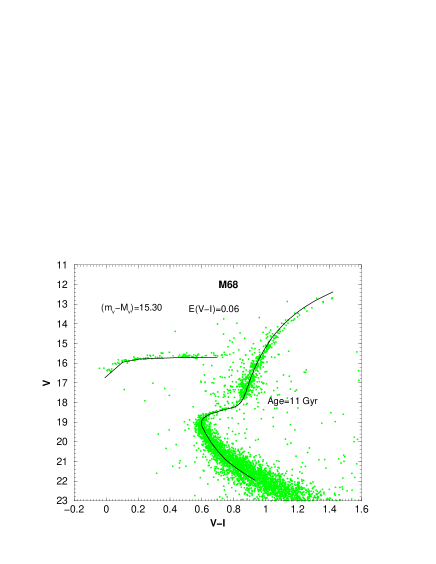
To further discuss this calibration, we show in Fig.2 a set of theoretical data displaying the behavior of theoretical isochrones with varying metallicity, age or . We find, for example, that increasing from 2.0 to 2.3 decreases the extension in temperature of the SGB, the best fit requires shorter ages and also a larger distance modulus to balance the effect of the increased . Thus, we will keep = 2.0 as a rather robust calibration of the mixing length in our models at Z= 0.0002, bearing in mind that this calibration is supported by independent evaluations of the cluster apparent distance modulus. As a parallel check, we took advantage of the (V, V-I) diagram presented by Walker (1994) for M68 to further test the theoretical scenario. As shown in Fig. 1, one finds that the best fit obtained in the (V, B-V) plane is preserved when passing to (V, V-I), supporting the consistency of the adopted model atmospheres by Castelli (1999).
When passing to larger metallicities, data in Table 1 show that, unfortunately, the uncertainties in the metallicity of the two calibrating clusters M3 and M13 are large, while the calibration depends sensitively on the assumption about this parameter. The only results on which all authors agree is that the metallicity of these two clusters should be very similar. Rey et al. (2001) showed that the subgiant branch in M13 appears shorter than in M3, in spite of the assumed common metallicity, reaching the conclusion that M13 is older than M3 by about 2 Gyr. A comparison between the Rey et al. data for the two clusters unambiguously reveals that- if both clusters have a common metallicity - M3 has a larger reddening than M13 by about E(B-V)0.02 mag.
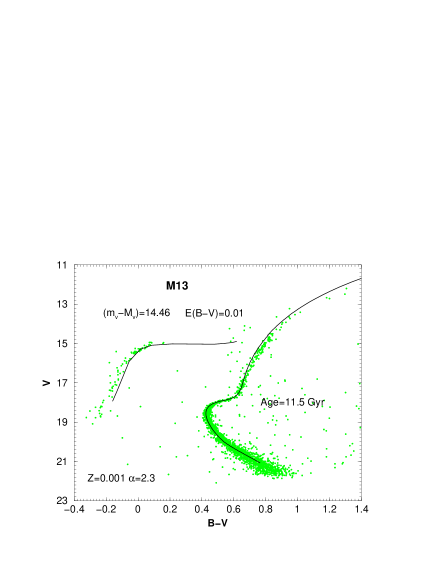
We find that adopting the Carretta & Gratton metallicity value for the clusters requires that cannot be constant when passing from Z=0.0002 to 0.001 (since for = 2.0 one obtains a good fit for M3 with E(B-V)=0.00, but the fit for M13 requires a negative reddening). If one increases , the required reddening increases and Fig 3 (left panel) shows that with the assumption = 2.3 the TO and subgiant region of M13 are reasonably well fitted by the isochrone of 11.5 Gyr with a distance modulus (mv - Mv)14.46 and a reddening E(B-V) =0.010.02. This stands in good agreement with Carretta et al. (2000: (mv - Mv)= 14.440.04). However, at larger luminosities, the cluster red giant branch (RGB) becomes progressively cooler than predicted. A similar effect has been discussed by Brocato et al. (1999) when fitting the RGB of NGC6362 (whose metallicity is similar to both M3 and M13), again with =2.3. One may conclude that by adopting such a large mixing length for MS structures, one cannot avoid decreasing mixing length value along the RGB.
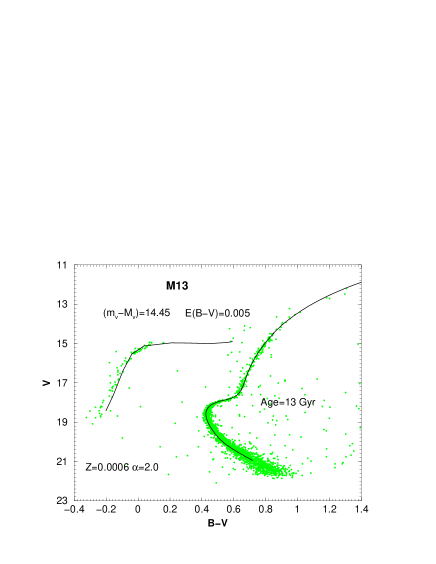
This result depends critically on the assumed metallicity. As shown in the lower panel of Fig.2, decreasing the metallicity down to the Zinn & West values makes the isochrone hotter, increasing the reddening requirements. In contrast, the SGB temperature range shrinks, requiring a shorter mixing length. As a result, the right panel of Fig.3 shows that for Z0.0006 M13 can be reasonably well fitted assuming = 2.0, with similar values of distance modulus and reddening, but increasing the age to about 13 Gyr. The isochrone now better reproduces the RGB shape. Thus metallicity plays a critical role in assessing the calibration of for intermediate metallicity clusters, such as M13 and M3. Pending further and more precise constraints on this parameter, we prefer to adopt = 2.0 throughout the explored range of metallicities, both to avoid a peculiar efficiency of superadiabatic convection at these metallicities and to better fit the RG branches. However, for the case Z=0.001 we present in the evolutionary library both cases ( = 2.0 and =2.3), to allow a quantitative comparison of uncertainties in the fitting of observed CM diagrams.
Comparison of the two panels in Fig.3 shows that the assumed value of affects the evaluation of the cluster age, but has negligible impact on the derived distance moduli. We thus find that the best fit with the present isochrones appears able to produce distance moduli of comparable accuracy to those from the Hipparcos-based evaluations, independent of any uncertainties on the cluster metallicity. Rey et al. (2001) adopt Z=0.0006 to obtain for M13 an age of 13 Gyr, in agreement with our result. This is the consequence of the good agreement between present isochrones and those of Yi et al. (2001), as we will discuss in the next section and in the Appendix A.
3 The models


| Age | MT | MV | m | MT | MV | m | MT | MV | m | MT | MV | m | |||
|---|---|---|---|---|---|---|---|---|---|---|---|---|---|---|---|
| Z=0.0002 Y=0.23 | Z=0.0004 Y=0.23 | Z=0.0006 Y=0.23 | Z=0.001 Y=0.232 | ||||||||||||
| 0.15 | -1.924 | 0.074 | 3.55 | -1.622 | 0.389 | 3.59 | -1.628 | 0.359 | 3.63 | -1.673 | 0.268 | 3.67 | |||
| 0.20 | -1.232 | 0.328 | 3.11 | -1.160 | 0.385 | 3.17 | -1.175 | 0.350 | 3.21 | -1.228 | 0.258 | 3.25 | |||
| 0.25 | -0.834 | 0.378 | 2.83 | -0.809 | 0.385 | 2.88 | -0.824 | 0.349 | 2.91 | -0.882 | 0.256 | 2.90 | |||
| 0.30 | -0.549 | 0.383 | 2.62 | -0.530 | 0.383 | 2.67 | -0.547 | 0.347 | 2.70 | -0.600 | 0.261 | 2.76 | |||
| 0.35 | -0.382 | 0.332 | 2.47 | -0.294 | 0.385 | 2.51 | -0.312 | 0.345 | 2.54 | -0.354 | 0.271 | 2.59 | |||
| 0.40 | -0.469 | 0.076 | 2.36 | -0.345 | 0.154 | 2.39 | -0.267 | 0.208 | 2.42 | -0.218 | 0.216 | 2.47 | |||
| 0.45 | -0.550 | -0.154 | 2.27 | -0.389 | -0.049 | 2.30 | -0.301 | 0.012 | 2.32 | -0.223 | 0.043 | 2.36 | |||
| 0.50 | -0.624 | -0.363 | 2.20 | -0.431 | -0.235 | 2.22 | -0.331 | -0.165 | 2.24 | -0.229 | -0.113 | 2.20 | |||
| 0.60 | -0.712 | -0.687 | 2.07 | -0.508 | -0.564 | 2.08 | -0.383 | -0.473 | 2.10 | -0.241 | -0.389 | 2.12 | |||
| 0.70 | -0.728 | -0.857 | 1.96 | -0.538 | -0.759 | 1.97 | -0.401 | -0.673 | 1.99 | -0.270 | -0.613 | 2.00 | |||
| 0.80 | -0.640 | -0.903 | 1.88 | -0.475 | -0.836 | 1.89 | -0.346 | -0.769 | 1.90 | -0.223 | -0.721 | 1.90 | |||
| 0.90 | -0.559 | -0.942 | 1.81 | -0.419 | -0.904 | 1.82 | -0.298 | -0.856 | 1.83 | -0.183 | -0.820 | 1.84 | |||
| 1.00 | -0.485 | -0.976 | 1.74 | -0.368 | -0.965 | 1.76 | -0.254 | -0.933 | 1.76 | -0.148 | -0.912 | 1.78 | |||
| 1.50 | -0.236 | -1.154 | 1.53 | -0.173 | -1.210 | 1.54 | -0.099 | -1.226 | 1.55 | -0.038 | -1.298 | 1.56 | |||
| 2.00 | -0.121 | -1.354 | 1.40 | -0.078 | -1.441 | 1.41 | -0.017 | -1.452 | 1.41 | 0.017 | -1.528 | 1.42 | |||
| 2.50 | -0.065 | -1.551 | 1.30 | -0.018 | -1.633 | 1.31 | 0.042 | -1.647 | 1.32 | 0.066 | -1.725 | 1.33 | |||
| 3.00 | -0.020 | -1.712 | 1.23 | 0.031 | -1.785 | 1.24 | 0.090 | -1.802 | 1.24 | 0.106 | -1.888 | 1.25 | |||
| 3.50 | 0.021 | -1.849 | 1.18 | 0.072 | -1.922 | 1.18 | 0.129 | -1.938 | 1.19 | 0.142 | -2.026 | 1.19 | |||
| 4.00 | 0.058 | -1.956 | 1.13 | 0.111 | -2.043 | 1.13 | 0.156 | -2.059 | 1.14 | 0.163 | -2.151 | 1.15 | |||
| 4.50 | 0.092 | -2.045 | 1.09 | 0.142 | -2.150 | 1.09 | 0.180 | -2.161 | 1.10 | 0.181 | -2.260 | 1.11 | |||
| 5.00 | 0.121 | -2.169 | 1.05 | 0.170 | -2.239 | 1.06 | 0.201 | -2.251 | 1.06 | 0.198 | -2.355 | 1.00 | |||
| 5.50 | 0.148 | -2.249 | 1.02 | 0.195 | -2.317 | 1.03 | 0.220 | -2.332 | 1.03 | 0.213 | -2.442 | 1.05 | |||
| 6.00 | 0.172 | -2.316 | 1.00 | 0.218 | -2.383 | 1.00 | 0.238 | -2.411 | 1.01 | 0.226 | -2.522 | 1.02 | |||
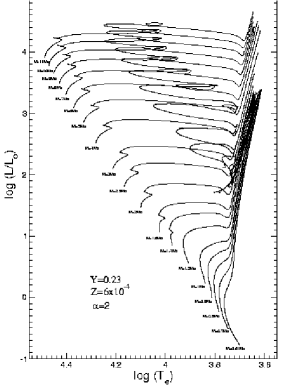
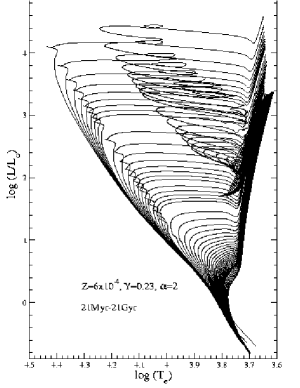
The computed evolutionary models cover with a fine grid the mass range 0.6 to 11 M⊙ for the adopted chemical compositions Z=0.0002 Y=0.230, Z=0.0004 Y=0.230, Z=0.0006 Y=0.230, Z=0.001 Y=0.232, where the amount of original helium has been evaluated by assuming a primordial helium abundance Y and Y/Z 2.5 (see e.g. Pagel & Portinari 1998, Castellani et al. 1999). In all cases we assumed a solar mixture as given by Grevesse & Noels (1993). All the models with evolutionary times smaller than the Hubble time have been followed from the Main Sequence through the H and He burning phases, until the C core ignition or the onset of thermal pulses in the advanced AGB phase. In the case of low mass stars undergoing violent He flashes, stellar structures at the Red Giant Branch (RGB) tip have been used to produce the corresponding Zero Age Horizontal Branch (ZAHB) models, further evolving these models until the onset of thermal pulses. Less massive stars (M0.7 M⊙), whose evolutionary times are longer than the Hubble time, have been evolved up to central H exhaustion. To allow a proper evaluation of isochrones with ages lower than 150 Myr, the Pre-Main Sequence phase of selected low mass models has been included in the isochrones.
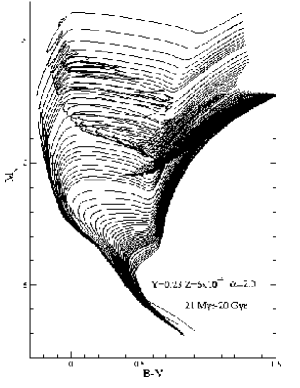
The evolutionary characteristics of the models have already been described in the literature, and they will not be discussed here. We only notice that the mass of the He core at the central helium ignition appears in good agreement with the results of Dominguez et al. (1999). On the basis of evolutionary tracks, cluster isochrones in the age range 20 Myr to 20 Gyr have been evaluated for the four choices about the cluster metallicity; for Z=0.001 models are calculated for two different values: 2.0 and 2.3. Figure 5 shows, as an example, the HR diagram for Z=0.0006 =2.0; isochrones for the two metallicities are also shown in the (Mv, B-V) plane.
Detailed tables for both tracks and isochrones are available at the URL http://astro.df.unipi.it/SAA/PEL/Z0.html (and at the CDS). For each mass or for each isochronal age, these tables give the luminosity and effective temperature, followed by the visual magnitude and colors in the Johnson and infrared Cousins bands, as derived by adopting the model atmospheres by Castelli (1999). In addition one finds for the four adopted chemical compositions, tables with the distribution of ZAHB models as produced by a 0.8 M⊙ progenitor giving for the various HB masses the luminosity, temperature, V magnitude and B-V color, together with files reporting the HB and AGB evolution of all these models. This procedure gives ZAHB corresponding to ages in the range 10 to 14 Gyr, depending on the metallicity. As usual, the small dependence of these ZAHB luminosities on age can be neglected. A detailed investigation on the effect of age on ZAHB luminosities has been published by Cassisi & Caputo (2002).
To permit a detailed comparison among different evolutionary computations, the website contains files listing the structural evolution of three selected models (M=0.9, 2.0 and 4.0 M⊙) for all the selected chemical compositions. For each mass, a file lists the sequence number of the model, its age, central abundance by mass of H or He, luminosity, effective temperature, central temperature and density, the maximum off-center temperature and its location, the mass of the convective core, He core and convective envelope and, in the last four columns, the fraction of the total luminosity released by pp, CNO and He nuclear burning and by the gravothermal energy.
The evolutionary sequences for old clusters with ages greater than 6 Gyr closely follow theoretical predictions discussed in Cassisi et al. (1998, 1999). Here we take advantage of the finer grid of metallicities to present in Fig.5, left panel, an improved calibration of the Turn Off magnitudes as a function of the cluster age covering the whole range 0.0002 Z 0.001. The right panel in Fig.5 gives the calibration of the ZAHB magnitude taken at logTe=3.83, i.e., near the central region of the RR Lyrae instability strip as a function of the cluster metallicity. A linear best fit through these data, taking into account an enhancement of [/Fe]0.3, gives:
a result well within current observational constraints (e.g. Chaboyer et al. 1998):
or by Carretta et al. (2000):
Unfortunately, the large uncertainties in the empirical relations do not permit a solution to the problem of a possible over-luminosity of present theoretical predictions.
As well known (see e.g. Stetson et al. 1996, Salaris & Weiss 1997, Cassisi et al. 1998, 1999) TO and ZAHB magnitudes can be combined to calibrate the difference in magnitude (MV) between the Turn-Off (TO) and the helium burning HB phase as an age indicator, independently of both cluster distance and reddening. As discussed in Paper I, for ages 6 Gyr the difference between the bright end of the main sequence (MT) and the bottom luminosity of the clump of He burning giants can provide an observational parameter that is able to derive from the CM diagram at least a rough estimate of the age independently on the cluster distance (see e.g. Castellani et al. 1999). Table 2 gives the V magnitude of the main sequence termination (MT) and the difference (MV) in visual magnitude between the clump and MT as a function of the age in the range 150 Myr to 6 Gyr for all the metallicities investigated in this paper. MT and the clump magnitude have been evaluated at the maximum luminosity reached just after the overall contraction (H exhaustion) and at the minimum luminosity of the He clump region, respectively. For each age, the original mass of stars populating the He burning clump is also shown. In the case of old globulars, our calibration gives ages in reasonable agreement with the ages recently determined by Salaris & Weiss (2002). However, with respect to Salaris & Weiss the present isochrone database has the additional advantage of including ages much lower than the typical globular clusters ages, down to about 20 Myr.


4 Comparison with previous results
A discussion of the differences between the present and Girardi et al. (2000) evolutionary models has already been given in Paper I (see also Castellani et al. 2000), whereas the existing differences between Girardi et al. and Yi et al. (2001) have been discussed in Gallart et al. (2003). Fig.6 shows a comparison between selected isochrones in the theoretical (logL/L⊙, logTe) plane for Z=0.001. A broader discussion on the main characteristics of the most updated extended sets of evolutionary models available in the literature can be found in Appendix A.
Inspection of data in Fig.6 (left panel) shows that in the range of the largest ages (age10 Gyr, mass at the TO M0.85M⊙) isochrones without element diffusion, e.g. in Girardi et al. (see also Salasnich et al. 2000), for any given TO luminosity give larger cluster ages and larger TO temperatures than diffusion isochrones. One finds a good agreement with the models of Yi et al. along the MS and SGB as a result of the quite similar input physics adopted to compute H burning models; the differences in temperatures in the upper portion of the RGB branch likely originate from different assumptions about the mixing length parameter .
Differences in temperatures between our models and Yi et al., both allowing for element diffusion, originate from different assumptions about the mixing length parameter , and one finds that our large age isochrones with = 2.0 agree well with the ones of Yi et al. along the MS and SGB as a result of the quite similar input physics adopted to compute H burning models.
For lower ages, one notes that the TO.s of the 3 Gyr isochrones with (Girardi et al. 2000, Yi et al. 2001) or without (present computations) overshooting appear rather similar, with negligible differences between our and the Girardi et al. results. The reasons for this are twofold: the overshooting values adopted by Yi et al. and Girardi et al. are lower than those originally adopted in the Padua isochrones (see e.g. Bertelli et al. 1986), moreover for 1.0M/M1.5 the overshooting efficiency is further reduced, and for M/M1.0 the overshooting amount is set to zero to avoid the development of a small central convective zone in the solar model which would persist up to the present age of 4.6 Gyr. Note that the difference in TO temperature between models with and without overshooting does not scale as expected with the assumptions on , due perhaps to different treatments of the superadiabatic convection/inclusion of undershooting. As already discussed in Castellani et al. (2000) Girardi et al. models give fainter He burning clumps. We conclude that, due to the reduced extension of the convective cores of the stars populating clusters with Z0.001 and ages larger than or of the order of 3 Gyr, these clusters cannot provide any evidence for or against overshooting.
Evidence for efficient overshooting can however be found in younger clusters, with ages around 1 Gyr, as shown in the right panel of Fig.6; one finds that at this age overshooting pushes the model beyond the Red Giant transition, and the overshooting signature will be represented by the reduced extension and population of the RG branch. We identify this prediction as the most robust test for overshooting, as already discussed in the seminal paper by Barbaro & Pigatto (1984). However such a test is sensitively dependent on the cluster metallicity. A similar comparison of available isochrones reveals, for instance, that clusters at Z=0.004 with ages greater than about 1.5 Gyr, as the ones discussed in the recent paper by Woo et al. (2003), do not provide information about the overshooting efficiency.
5 Final remarks
In this paper we present and discuss canonical stellar evolutionary models produced for a grid of chemical compositions covering the range of Population II stars. For each given metallicity, we adopted a mixing length calibrated to reproduce the observed color of red giant branch in galactic globulars. On this basis we make available evolutionary tracks and cluster isochrones covering the range of ages 20 Myr to 20 Gyr. The difference in magnitude between the top MS (the Blue Sequence) and He burning structures has been finally calibrated in terms of the cluster age for globular and open clusters. Due to the wide range in age, this calibration can be applied not only to population II clusters in the Galaxy but also to intermediate and young, low metallicity clusters in dwarf galaxies and in the Magellanic Clouds. VandenBerg, Bolte & Stetson (1990) cautioned that uncertainties in input physics and/or model atmospheres make it unlikely that the predicted color difference between RG and TO is quantitatively correct. The discussion presented in this paper shows that a correct description of this parameter appears now within the theoretical possibilities as a result of the recent improvement in both input physics and atmospheric models.
Acknowledgements.
We warmly thank Steve Shore and Pier Giorgio Prada Moroni for a careful reading of the manuscript and the anonymous referee for very useful comments. Financial support for this work was provided by the Ministero dell’Istruzione, dell’Università e della Ricerca (MIUR) under the scientific project “Stellar observables of cosmological relevance” (V. Castellani & A. Tornambè, coordinators).Appendix A Stellar evolutionary models
Due to the relatively large number of stellar models available in the literature, we discuss the current situation. Theoretical predictions concerning stellar structures and their evolution depend on the adopted microphysics describing the behavior of the stellar plasma as well as on the assumptions about the efficiency of physical processes such as convection, microscopic diffusion, and overshooting. The comparison with observations, which is the final goal of evolutionary computations, requires a third ingredient: the model atmospheres needed to translate theoretical luminosities and effective temperatures into magnitudes and colors.
| Models | Present | Yi et al. 2001 | Girardi et al. 2000 | Geneva | VandenBerg et al.2000 |
|---|---|---|---|---|---|
| Mass Range [M⊙] | 0.6-11 | 0.4-5 | 0.15-7 | 0.8-120 | 0.5-1.0 |
| Metallicity (Z) | * | * | |||
| Evo.Phases | H+He | H | H+He | H+He | H+He |
| 1.9-2.3 | 1.74 | 1.68 | 1.6 | 1.89 | |
| Diffusion | Thoul et al. 1994 | Thoul et al. 1994* | NO | NO | NO* |
| Overshooting | NO* | 0.2 Hp | 0.25 Hp | 0.20Hp | - |
| EOS | OPAL96+Str.1998* | OPAL96+Yale | Padua+MHD | Geneva* | Victoria |
| Rad. Opacity | OPAL96+Alex.1994* | OPAL96+Alex.1994 | OPAL92+Alex.1994 | OPAL92+Kur.1991 | OPAL96+Alex.1994 |
| Nucl.Reactions | NACRE* | Bahcall&P.1992 | Caug.&Fow.1988 | Caug.&Fow.1988 | Bahcall&P.1992 |
| El. Conduction | Itoh et al.1983 | Hubb.Lampe1969* | Hubb.Lampe 1969 | Hubb.Lampe1969 | Hubb.Lampe1969 |
| Neutrinos | Itoh et al.1996 | Itoh et al.1989 | Munakata et al.1985 | Itoh et al.1989 | Itoh et al.1996 |
| Model Atm. | Castelli et al.1999 | Lejeune et al.1999* | Castelli et al.1999* | Lejeune et al.1999 | Vand.& Clem2003* |
Current stellar models differ in a variety of choices concerning these inputs, producing small but significant differences in the results. Table A1 summarizes the main features of the sets of models (tracks and isochrones) available in the literature, which, to our knowledge, cover a wide range in chemical composition and stellar masses/isochrones ages. The quoted models obviously do not exhaust the rich and composite scenario of updated stellar evolutionary calculations; for example several authors calculated sets of tracks/isochrones for ancient populations or for very low mass stars (see e.g. Straniero et al. 1997, Chabrier & Baraffe 1997, Cassisi et al. 2000, Vandenberg et al. 2000) or analyzed the characteristics of sets of intermediate mass stars (see e.g. Dominguez et al. 1999, Bono et al. 2000). In the table we add only models by VandenBerg et al. (2000) for low mass stars, as an example of evolutionary grids for old ages.
The table shows in the first three lines the range of masses, the range of metallicities (Z) and the evolutionary phases covered by the quoted models. The following three lines give information on the treatment of the macroscopic mechanism, listing the adopted values of the mixing length parameter governing the efficiency of superadiabatic convection () and indicate whether or not diffusion and/or overshooting have been taken into account. The following five lines give the sources of the adopted physical inputs, listing in order the sources for the Equation of State (EOS), radiative opacity, cross sections for nuclear reactions, the evaluation of the electron conduction in degenerate matter and the production of cooling neutrinos. The adopted atmospheric models are listed in the last row. Asterisks in the table mark the data that require some additional information.
Present models: computations presented in this paper for the
metallicity range Z= 0.0002 to 0.001 do not include overshooting.
However, the optional occurrence of overshooting has
been presented and discussed in Paper I for the cases Z=0.004 and
0.008. OPAL96 EOS (Rogers et al. 1996) and OPAL96 Radiative Opacity
(Iglesias & Rogers 1996) when needed have been implemented with
an updated version of the EOS of Straniero (1988) and with low
temperature opacities from Alexander & Fergusson (1994),
respectively. Reaction rates are from the NACRE collaboration (Angulo
et al. 1999).
Yi et al.: computations with different choices about the overabundance
of “” elements ([/Fe]= 0.0, 0.3, 0.6) are
presented. For the conductive opacity Hubbard & Lampe (1969) is
adopted for log (in g/cm3) and Canuto (1970) for
log(in g/cm3). Diffusion is taken into account only
for He. Magnitudes and colors are available as calculated by adopting
two different atmospheric models: either from an update of Green et
al. (1987) or from Lejeune et al. (1998) and Westera et al. (1999).
Girardi et al.: enhanced models are presented elsewhere
(Salasnich et al. 2000) for some metallicity values. The
original Padua EOS has been implemented with MHD (Mihalas et al.
1990 and references therein) for temperatures lower than 107 K.
For a critical analysis of the adopted
color transformations in several photometric systems see Girardi
et al. (2002).
Geneva: we refer to a series of papers from Schaller al. (1992) to
Mowlavi et al.(1998).
VandenBerg et al.: in more recent models (VandenBerg et al. 2002) both
gravitational settling and radiative acceleration are
taken into account. We quoted VandenBerg et al. (2000)
because in VandenBerg et al. (2002) HB models are not calculated. The
original helium abundance is
assumed following the formula: Y=0.235 + 2Z. Computations for
models with an overabundance of“” elements ([/Fe]=0.3, 0.6)
are presented too. The color transformations adopted in
the paper are quoted as “VandenBerg 2000, in preparation”;
VandenBerg & Clem (2003) is probably the correct reference for
the published paper.
References
- (1) Alexander D.R.& Ferguson J.W., 1994, ApJ 437, 879
- (2) Angulo C.,Arnould M., Rayet M., et al. (NACRE Collaboration) 1999, Nucl. Phys.A 645, 3
- (3) Bahcall J.N.& Pinsonneault M., Basu S., 2001, ApJ 555, 990
- (4) Barbaro G.& Pigatto L., 1984, A&A 136, 355
- (5) Bertelli G., Bressan A., Chiosi C. & Angerer K., 1986,A&AS 66, 191
- (6) Bertelli G., Nasi E., Girardi L., et al. 2003, ApJ 125, 770
- (7) Bono G., Caputo F., Cassisi S., Marconi M. et al., 2000, ApJ 543, 955
- (8) Brocato E. & Castellani V., 1993, ApJ 410, 99
- (9) Brocato E., Castellani V., Raimondo G. & Walker A.R. 1999, ApJ 527, 230
- (10) Brocato E., Castellani V.,Di Carlo E., Raimondo G.& Walker A. R., 2003, AJ 125, 3111
- (11) Canuto V., 1970, ApJ, 159, 641
- (12) Carraro G., Vallenari A., Girardi L., & Richichi, A. 1999, A&A, 343, 825
- (13) Carretta E. & Gratton R. 1997, A&AS 121, 95
- (14) Carretta E., Gratton R., Clementini G. & Fusi Pecci F. 2000, ApJ 533, 215
- (15) Cassisi S. & Caputo F. 2002, MNRAS 333, 825
- (16) Cassisi S., Castellani V., Degl’Innocenti S. & Weiss A. 1998, A&AS 129, 267
- (17) Cassisi S., Castellani V., Degl’Innocenti S., Salaris M. & Weiss A., 1999, A&AS 134,103
- (18) Cassisi S., Castellani V., Ciarcelluti P.,Piotto G. & Zoccali M., 2000, MNRAS 315, 679
- (19) Castellani V., Chieffi S., Tornambe A. & Pulone L., 1985, ApJ 296, 204
- (20) Castellani V. & Degl’Innocenti S., 1999, A&A 344, 97
- (21) Castellani V., Degl’Innocenti S. & Marconi M. 1999, MNRAS 303, 265
- (22) Castellani V., Degl’Innocenti S., Girardi L. et al. 2000, A&A, 354, 150
- (23) Castellani V., Degl’Innocenti S. & Prada Moroni P.G. 2001, MNRAS 320, 66
- (24) Castellani V., Degl’Innocenti S., Prada Moroni P.G. & Tordiglione V. 2002, MNRAS 334, 193
- (25) Castellani V., Degl’Innocenti S., Marconi M., Prada Moroni P.G. & Sestito P., 2003,A&A 404,645
- (26) Castelli F., Gratton R. G., & Kurucz R. L., 1997, A&A 318, 841
- (27) Castelli F. 1999, A&A, 346, 564
- (28) Caughlan G.R. & Fowler W.A., 1988, Atom. Data Nucl. Data Tables 40, 283
- (29) Chaboyer B.,Demarque P., Kernan P. J. & Krauss L. M., 1998, ApJ, 494, 96
- (30) Chaboyer B., Green E. M., & Liebert J. 1999, AJ, 117, 1360
- (31) Chaboyer B., 2001, in ASP Conf. Ser. Vol. 245, “Astrophysical Ages and Times Scales” von Hippel T., Simpson C. & Manset N. eds., San Francisco: Astronomical Society of the Pacific, p.162
- (32) Chabrier G. & Baraffe I., 1997, A&A 327, 1039
- (33) Ciacio F., Degl’Innocenti S. & Ricci B. 1997, A&AS 123, 449
- (34) Degl’Innocenti S., Dziembowski W.A, Fiorentini G. & Ricci B. 1997, Astrop. Phys. 7, 77
- (35) Dominguez I, Chieffi A., Limongi M. & Straniero O.,1999, ApJ 524, 226
- (36) Ferraro F. R., Messineo M., Fusi Pecci F. et al. 1999, AJ 118, 1738
- (37) Gallart C., Zoccali M., Bertelli G. et al.,2003, AJ 125, 742
- (38) Girardi L., Bressan A., Bertelli G. & Chiosi C. 2000, A&AS 141, 371
- (39) Girardi, L., Bertelli, G., Bressan, A. et al. 2002, A&A 391, 195
- (40) Gratton R., Fusi Pecci F., Carretta E. et al., 1997, ApJ 491, 749
- (41) Green E., Demarque P., & King C. 1987, The Revised Yale Isochrones and Luminosity Functions (New Haven: Yale Univ. Obs.)
- (42) Grevesse N. & Noels A., 1993 in “Origin and Evolution of the elements”, ed. N. Prantzos, E. Vangioni-Flam, M. Casse(̀Cambridge Univ. Press, Cambridge), p.15.
- (43) Haft M., Raffelt G. & Weiss A., 1994, ApJ 425, 222
- (44) Harris, W.E., 2003, updated version of Harris W.E., 1996, AJ, 112, 1487 at the URL http://physwww.physics.mcmaster.ca/
- (45) Hubbard W.B. & Lampe M., 1969, ApJS 163, 297
- (46) Iglesias C.A. & Rogers F.J., 1996, ApJ 464, 943
- (47) Itoh N., Mitake S., Iyetomi H. & Ichimaru S., 1983, ApJ 273, 774
- (48) Itoh N., Adachi T., Nakagawa M. & Kohyama Y., 1989, ApJ 339, 354
- (49) Itoh N., Adachi T., Nishikawa A. & Kohyama Y., 1996, ApJ 470, 1015
- (50) Kraft R.P., Sneden C., Langer G.E. et al. 1995, AJ 109, 2586
- (51) Kurucz R.L., 1991, in “Stellar atmospheres: beyond classical models, NATO ASI Ser. C 341, Crivellari L. Hubeny I., Hummer D.G. (eds.).
- (52) Lejeune T., Cuisinier F., & Buser R., 1998, A&A, 130, 65
- (53) Maeder A. & Zahn J.P., 1998, A&A 334, 1000
- (54) Marconi M., Caputo F., Di Criscienzo M. & Castellani M.,2003, astro-ph/0306356, ApJ, in publication
- (55) Mateo M. 1998,ARA&A 36, 435
- (56) Mihalas D., Hummer D.G., Mihalas B.W.& Däppen W., 1990, ApJ 360, 300
- (57) Monelli M., Pulone L., Corsi C.E. et al., 2003, AJ, 126, 218
- (58) Mowlavi N., Schaerer D., Meynet G. et al. 1998, A&AS 128, 471
- (59) Munakata H. Kohyama Y. & Itoh N., 1985, ApJ 296, 197
- (60) Palacios A., Talon S., Charbonnel C. & Forestini M., 2003, A&A 399, 603
- (61) Pagel B.E.J. & Portinari L. 1998, MNRAS 298, 747
- (62) Richard O., Michaud G., Richer J., et al., 2002, ApJ 568, 979
- (63) Richer J., Michaud G., Rogers F. et al., 1998, ApJ 492, 833
- (64) Rood, R. T., Carretta, E., Paltrinieri B. et al., 1999, ApJ 523,752
- (65) Rosenberg A., Saviane I., Piotto G., & Aparicio A., 1999,122, 3219 AJ 118, 2306
- (66) Rey S.C., Yoon S.J., Lee Y.W., Chaboyer B. & Sarajedini A., 2001, AJ
- (67) Rogers F. J. & Iglesias C.A., 1992, ApJS 79, 507
- (68) Rogers F.J., 1994 in IUA Colloq. 147, in Chabrier G., Schatzman E.L. eds., ”The equation of state in astrophysics”, Cambridge University Press, Cambridge, p. 16
- (69) Rogers F.J., Swenson F.J. & Iglesias C.A., 1996, ApJ 456, 902
- (70) Rutledge G.A., Hesser J.E. & Stetson P.B., 1997, PASP 109, 907
- (71) Salaris M., Chieffi S. & Straniero O., 1993, ApJ 414, 580
- (72) Salaris M. & Cassisi S., 1996, A&A 305, 858
- (73) Salaris M. & Weiss A., 1997, A&A 327, 107
- (74) Salaris M. & Weiss A., 1998,A&A 335, 943
- (75) Salaris M. & Weiss A., 2002, A&A 388, 492
- (76) Salasnich B., Girardi L., Weiss A. & Chiosi C. 2000, A&A 361, 1023
- (77) Schaller G., Schaerer D., Meynet G. & Maeder A. 1992, A&AS 96, 269
- (78) Stetson P. B., VandenBerg D. A. & Bolte M., 1996, PASP 108, 560
- (79) Straniero O., Chieffi S. & Limongi M., 1997, ApJ 490, 425
- (80) Straniero O., 1988, A&AS 76, 157
- (81) Suntzeff N. B., Schommer R. A., Olszewski E. W., & Walker A. R., 1992, AJ 104, 1743
- (82) Thoul A., Bahcall J. & Loeb A. 1994, ApJ 421, 828
- (83) Yi S., Demarque P., Kim Y-C. et al., 2001, ApJ 533, 670
- (84) Walker A.R., 1994, AJ 108, 555
- (85) VandenBergh, D.A., Bolte M. & Stetson P.B. 1990, AJ 100, 445
- (86) VandenBerg D., Richard O., Michaud G. & Richer J., 2002, ApJ 571, 487
- (87) VandenBerg D. & Clem J., 2003, AJ 126, 778
- (88) Westera P., Lejeune T. & Buser R. 1999 in “Spectrophotometric Dating of Stars and Galaxies”, ASP Conference Proceedings, Vol. 192, p.203, Hubeny I., Heap S. and Cornett R. eds.
- (89) Woo J.-H., Gallart C., Demarque P. Yi S. & Zoccali M., 2003, AJ 125, 754
- (90) Zinn R. & West M.J. 1984, A&AS 55, 45
- (91) Zinn, R. 1985, ApJ, 293, 424