The profiles of the 3 to 12 m PAH features11affiliation: Based on observations with ISO, an ESA project with instruments funded by ESA Member States (especially the PI countries: France, Germany, the Netherlands and the United Kingdom) and with the participation of ISAS and NASA. .
Abstract
We present spectra of the 3.3 m and 11.2 m PAH features of a large number of stellar sources, planetary nebulae, reflection nebulae, H II regions and galaxies, obtained with ISO-SWS. Clear variations are present in the profiles of these features. Most of the sources show a symmetric 3.3 m feature peaking at 3.290 m, while only very few show an asymmetric 3.3 m feature peaking at a slightly longer wavelength. The profiles of the 11.2 feature are distinctly asymmetric. The majority of the sources has a 11.2 feature peaking between 11.20 and 11.24 , with a very steep blue rise and a low tail-to-top ratio. A few sources show a 11.2 feature with a peak position of 11.25 , a less steep blue rise and a high tail-to-top ratio. The sources are classified independently based on the 3.3 and 11.2 m feature profiles and peak positions. Correlations between these classes and those based on the 6–9 m features (Peeters et al., 2002a) are found. In particular, sources with the most common profiles in the 6–9 m region also show the most common 3.3 and 11.2 m feature profiles. However, the uncommon profiles do not correlate with each other. Also, these classifications depend on the type of object. In general, H II regions, non-isolated Herbig AeBe stars and YSO’s show the same profiles for all 3-12 m features. Many planetary nebulae and Post-AGB stars show uncommon feature profiles. The 3 galaxies in our sample show the same profiles as the H II regions for all but the 11.2 feature, being similar to that of evolved stars. The observed pronounced contrast in the spectral variations for the CH modes (3.3 and 11.2 bands) versus the CC modes (6.2, 7.7 and 8.6 bands) is striking : the peak wavelengths of the features attributed to CC modes vary by 15–80 cm-1, while for the CH modes the variations are 4–6.5 cm-1. We summarize existing laboratory data and theoretical calculations of the modes emitting in the 3–12 region of PAH molecules and complexes. In contrast to the 6.2 and 7.7 components which are attributed to PAH cations, the 3.3 feature appears to originate in neutral and/or negatively charged PAHs. We attribute the variations in peak position and profile of these IR emission features to the composition of the PAH family. The variations in FWHM of the 3.3 feature remains an enigma while those of the 11.2 can be explained by anharmonicity and molecular structure. The possible origin of the observed contrast in profile variations between the CH modes and the CC modes is highlighted.
1 Introduction
The infrared spectra of a wide variety of sources are dominated by strong emission features at 3.3, 6.2, 7.7, 8.6 and 11.2 m (3040, 1615, 1310, 1160, 890 cm-1), commonly called the unidentified infrared (UIR) emission features (cf., Gillett et al., 1973; Geballe et al., 1985; Cohen et al., 1986). These features have been detected and studied in a large number of stellar sources – planetary nebulae (PNe), reflection nebulae (RNe), H II regions, Young Stellar Objects (YSO) and galaxies – indicating that the emitters of these features are surprisingly widespread and extremely stable, and therefore form a very important component of the interstellar medium.
The UIR features are generally attributed to Polycyclic Aromatic Hydrocarbons (PAHs) or PAH related molecules (Allamandola et al., 1989; Puget & Léger, 1989), although the exact molecular identification remains uncertain. Compelling evidence suggests that the features are due to a complex mixture of ionized and neutral, possibly substituted/complexed PAHs of many different sizes (Schutte et al. (1993); Bakes & Tielens (1994); Boulanger et al. (1998); Bakes et al. (2001); Hony et al. (2001), hereafter HVP01, Verstraete et al. (2001); Pech et al. (2002); Peeters et al. (2002a), hereafter PHV02, Hudgins & Allamandola (2004)). Therefore the overall appearance of the features including the profiles, relative strengths and peak positions, are determined by a large number of PAH related parameters, which are determined by local conditions and the PAH history.
High-resolution spectroscopy, as obtained with the Infrared Space Observatory (ISO, Kessler et al., 1996) and with current ground-based IR instruments, has revealed a richness of widespread variations in the relative strength and profiles of the features from source to source and within sources (Verstraete et al. (1996); Tielens et al. (1999); Maillard et al. (1999); Joblin et al. (2000); HVP01; Vermeij et al. (2002); PVH03: Goto et al. (2003); Madden et al. (2003); Song et al. (2003a, b); Bregman & Temi (2004); Peeters et al. (2004a, b); Galliano et al., in prep.). PHV02 have classified the sources in their sample according to the peak positions of the CC modes at 6.2, 7.7 and 8.6 m independently (Fig. 17 of PHV02 and Fig. 4, panels b and c, this paper). Interestingly, correlations in the features’ profiles were found and three main classes with significantly different feature profiles were identified. Most sources in their sample are in class ( hereafter). Sources with features peaking at significantly longer wavelengths were referred to as class ( hereafter). The two sources in their sample showing a 6.3 m feature exhibit neither a 7.7 m complex nor a 8.6 m feature. Instead, both sources show a broad emission feature at 8.22 m. These sources are referred to as class ( hereafter). Furthermore, the observed 6–9 m PAH spectrum was found to depend on the type of object and linked to local physical conditions.
To extend our insight of the PAH family and its relationship with the local physical conditions, we investigated the profiles of the CH modes at 3.3 and 11.2 m in the ISO-SWS spectra of a wide variety of sources. In Sect. 2 our sample and the observations are presented; the data reduction, the decomposition of the spectra and the influence of extinction are discussed. In Sect. 3, the 3.3 and 11.2 m features are first classified according to their profile and the relations between the classifications of all major features in the 3–12 m range are investigated, as well as their correlation with object type. Subsequently, variations in features associated with CH and CC modes are compared. In Sect. 4, the spectral characteristics of PAHs in the 3–12 range as measured in the laboratory and calculated by quantum chemical theories are summarized. The implications of the spectroscopic and observational conclusions made in this paper are discussed in Sect. 5. Finally, in Sect. 6 our main results are summarized.
2 The data
2.1 The sample
For this study, we take the sample of PHV02, which included 57 different objects, all showing UIR bands, and reduce it to those spectra with sufficient signal-to-noise (S/N) in the 3.3 and/or 11.2 m regions (Table 1). In addition, we excluded HD 100546 which exhibits crystalline silicates (Malfait et al., 1998) and hence the 11.2 emission band is a combination of PAH emission and crystalline silicate emission. This reduced sample includes 49 sources from a wide variety of objects, ranging from RNe, (compact) H II regions, YSO, Post-AGB stars, PNe to galaxies.
2.2 Observations and reduction
All spectra in the sample were obtained with the Short Wavelength Spectrometer (SWS, de Graauw et al., 1996) on board ISO, using the AOT01 scanning mode at various speeds or the AOT06 mode, with a resolving power () of 500-1500.
The data were processed with the SWS Interactive Analysis package IA3 (de Graauw et al., 1996) using calibration files and procedures equivalent with pipeline version 7.0 or later. Further data processing consisted of bad data removal and rebinning with a constant resolution, as described in Peeters et al. (2002b).
In case of high fluxes, the spectra can suffer from memory effects. Here, this only applies to the 11.2 m feature. At the time the data reduction was done, no memory correction tool was available and the average of the up and down scans is taken. The influences of memory effects is investigated as described in PHV02 and are found not to alter the 11.2 m feature profile significantly.
| Source | PAH features | Object type | ||||
|---|---|---|---|---|---|---|
| 3.3a | 6.2a,b | 7.7a,b | 8.6a,b | 11.2a | ||
| IRAS 10589-6034†? | A | A | A | A | A | compact H ii region |
| IRAS 12063-6259† | A | A | A | A | A | compact H ii region |
| IRAS 15384-5348† | A | A | A | A | A | compact H ii region |
| IRAS 15502-5302† | A | A | A | y | y | compact H ii region |
| IRAS 18116-1646†? | A | A | A | A | A | compact H ii region |
| IRAS 18032-2032† | A | A | A | A | A | compact H ii region |
| IRAS 18317-0757† | A | A | A | A | A | compact H ii region |
| IRAS 18434-0242△,† | A | A | A | A | compact H ii region | |
| IRAS 19442+2427△,† | A | A | A | A | A | compact H ii region |
| IRAS 21190+5140 | A | A | A | A | A | compact H ii region |
| IRAS 22308+5812 | A | A | A | A | A | compact H ii region |
| IRAS 23030+5958 | A | A | A | A | A | compact H ii region |
| IRAS 23133+6050 | A | A | A | A | A | compact H ii region |
| W3A 02219+6125△,† | A | A | A | A | A | compact H ii region |
| OrionBar D2 | B1 | A | A | A | A | H ii region |
| OrionBar D5 | A | A | A | A | A | H ii region |
| OrionBar D8 | A | A | A | A | A | H ii region |
| OrionBar H2S1 | A | A | A | A | A | H ii region |
| OrionBar BRGA | A | A | A | A | A | H ii region |
| Orion PK1†,♭ | A | A | A | A | A | H ii region |
| Orion PK2†,♭ | A | A | A | A | A | H ii region |
| G327.3-0.5† | A | A/B1 | A | A | A | H ii region |
| IRAS 02575+6017†,♭ | A | A | A | A | A | H ii region +YSO |
| GGD-27 ILL†,♭ | AV | A | A | A | A | star forming region |
| S106 (IRS4)†,♭? | A | A | A | A | A | YSO |
| IRAS 03260+3111 | A | A | A | A | A | Herbig AeBe star |
| BD+40 4124 | A | A | A | A | A | Herbig AeBe star |
| CD-42 11721†? | A | A | A | A | A | Herbig AeBe star |
| CD-42 11721(off)†? | A | A | A | A | A | Herbig AeBe star |
| HD 97048△ | A | A | AB | A | A | Herbig AeBe star |
| HD 179218 | BV | B1/2 | B | B | y | isolated Herbig AeBe star |
| NGC 7023 I | A | A | A | A | A | RN |
| NGC 2023 | A | A | A | A | A | RN |
| MWC 922△ | B1 | B1 | A | y | emission-line star | |
| CRL 2688 | A | C | C | C | y | Post-AGB star |
| HD 44179△ | B2 | B2 | B | B | B | Post-AGB star |
| HR 4049⋄ | B | B2 | B | B | B | Post-AGB star |
| IRAS 16279-4757 | A | A | A | A | A | Post-AGB star |
| IRAS 13416-6243⋄ | B | C | C | C | y | Post-AGB star |
| IRAS 21282+5050 | A | A | AB | A | A(B) | PN |
| BD+30 3639△ | A | B1 | B | B | A(B) | PN |
| Hb5 | A | A | A | B | PN | |
| He 2-113 | A | B2 | B | B | B | PN |
| IRAS 07027-7943 | A | B2/3 | B | B | y | PN |
| IRAS 17047-5650△ | A | B1 | B | B | B | PN |
| NGC 7027△ | A | A | B | B | A(B) | PN |
| circinus† | y | A | A | A | B | Seyfert 2 galaxy |
| M 82†?,♭ | A | A | A | A | A(B) | Starburst galaxy |
| NGC 253♭ | A | A | A | A | A(B) | Seyfert galaxy |
a: Central wavelength is given in ; b: from PHV02. y: Feature is present but too weak and/or too noisy to classify; ♮: Source with an unusual 8.6 feature (see PHV02, Peeters et al., 2004c); △: Sources suffering from memory effects at 11 ; †: Silicate absorption (9.7 ) present; ♭: Water ice absorption around 3 m present; ⋄: Up- and down-scans disagree around 3.3 m feature, but profile clearly of class ; ◁: Strong [NeVI] present on top of the 7.6 feature hampers the classification; V: Classification by Van Kerckhoven (2002).
2.3 The continuum
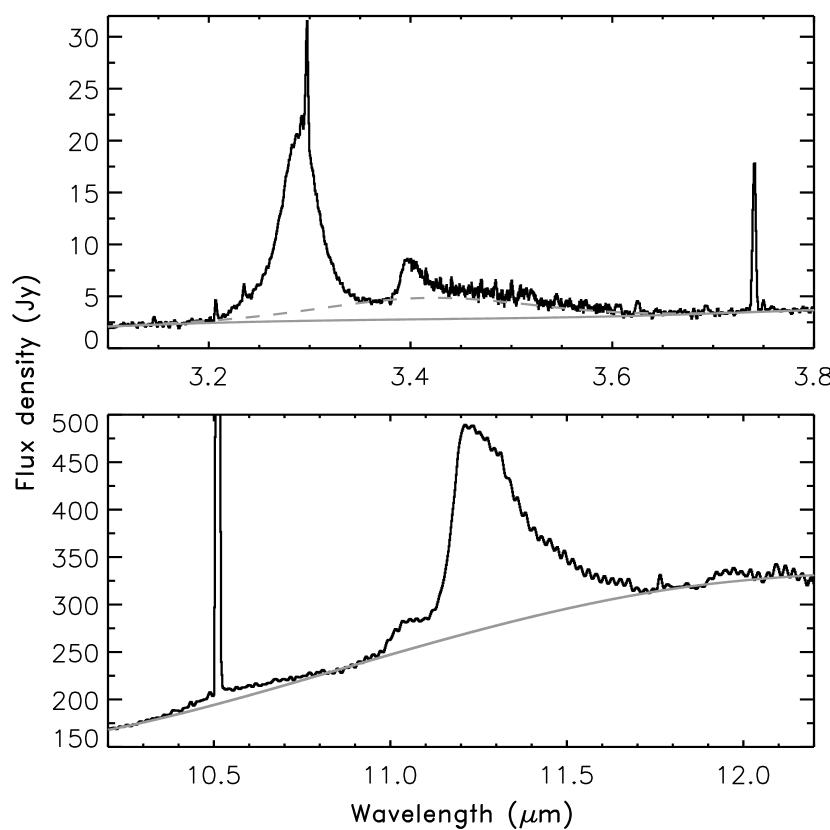
To study the feature profiles in different sources, we subtract a local continuum. This continuum determination is somewhat arbitrary. A local spline continuum or a polynomial of order 2 is fitted to the spectra in a wide wavelength region around the features (Fig. 1). In the 3.3 m region, the resulting plateau underlying the 3.3 PAH band, from about 3.2 to 3.6 m, was subtracted after the subtraction of the continuum, using a Gaussian with peak position 3.42 m and a Full Width at Half Maximum (FWHM) of 0.242 m. For the 11.2 m feature, the plateau and the continuum are fitted together using a single spline. For a review on the plateaus which underly many of the UIR bands, see e.g. Peeters et al. (2004a). To assess the sensitivity of the resulting profiles to the continuum or plateau choice, two extreme fits were defined and subtracted. In general, the influence of the continuum and/or plateau determination on the profile is very small and hence does not change the classification/profiles of the sources.
2.4 Extinction
The data are not corrected for extinction. The influence of extinction on the 3.3 and 11.2 m feature profiles is investigated as described in PHV02. The extinction is found to be quite gray over the short wavelength regions and thus has no significant influence on the profiles of the features.
Seven sources show water ice absorption around 3 m (see Table 1). The 3.3 m feature is situated in the red wing of the water band and, hence, its profile could be influenced. By drawing a local spline continuum (Fig. 1), we compensate to some extent the effect of the ice absorption and in the following we assume the ice absorption has no influence on the profile that we derive. This is corroborated by the fact that in our analysis those sources that exhibit clear ice absorption do not show any systematic deviations in the 3.3 emission band.
3 The feature profiles
3.1 The 3.3 m feature
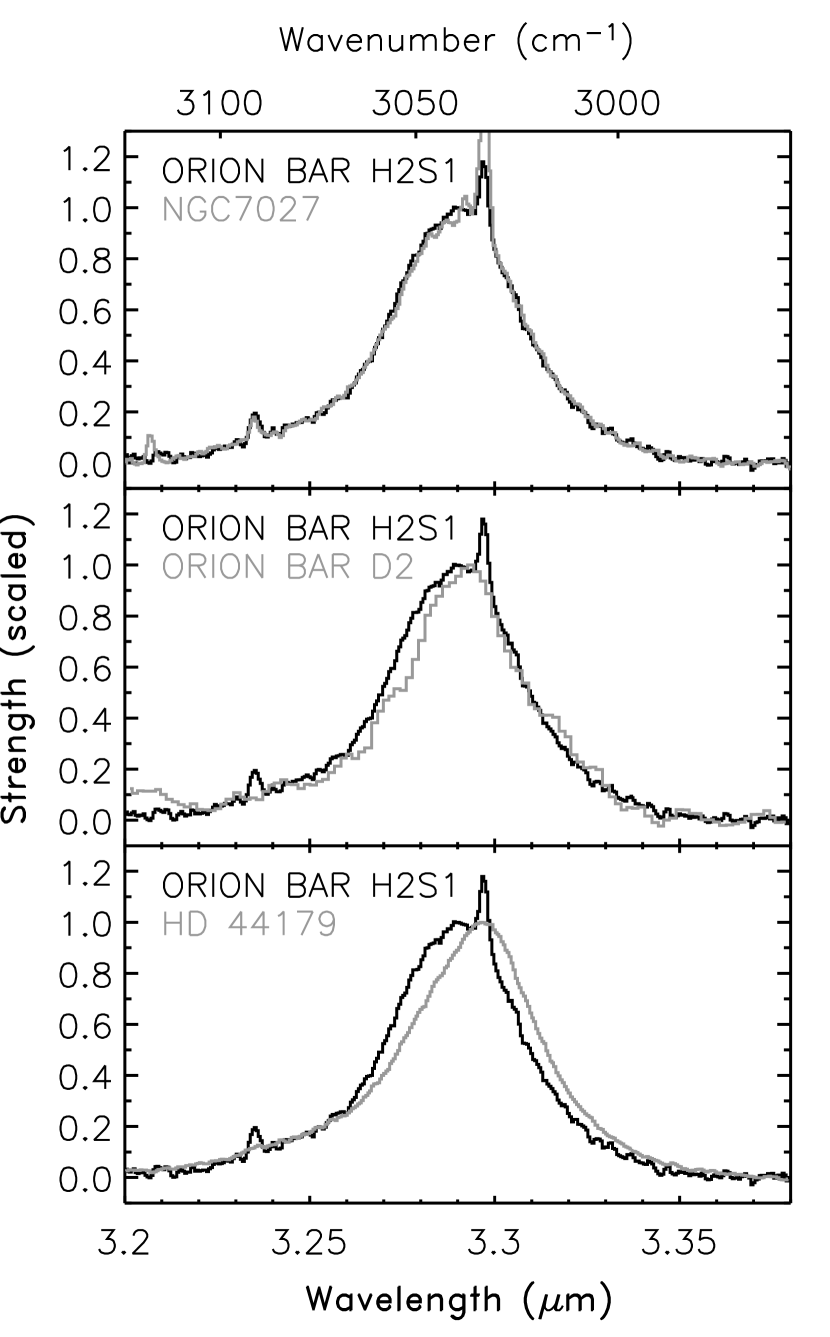
Nearly all sources in our sample show a pronounced 3.3 m feature. The similarity of most observed 3.3 m feature profiles is very striking. The top panel in Fig. 2 shows this profile for two quite different object types, the Orion Bar H2S1 (HII regions) and NGC7027 (PN). Only six sources in our sample show deviations in their 3.3 m features (see Table 1 and Fig. 2, middle and bottom panels).
Based on the profile of the 3.3 m feature, the sources can be classified into three classes, designated as , and (Tables 1 and 2). Class , containing most sources, has a symmetric profile with a peak position of 3.290 m and a FWHM of 0.040 m (Fig. 2, top panel). Class and have asymmetric profiles with peak positions of 3.293 and 3.297 m respectively, both with a FWHM of 0.037 m. The profile of class , represented by HD 44179, is redshifted with respect to class , and has a less steep blue wing (Fig. 2, bottom panel). The profile of class , represented by the Orion Bar D2, is intermediate; its red wing is similar to the profile, but the blue wing is clearly shifted to longer wavelengths and the peak position is slightly to the red of the profile (Fig. 2, middle panel). The up- and down-scans of HR 4049 and IRAS 13416-6243 disagree around the peak and the spectrum of HD 179218 is noisy. Therefore, we can not distinguish between class or . However, we can say their profiles do not resemble the class profile but belong to either or , indicated as .
3.2 The 11.2 m feature
As a consequence of the selection requirements in Sect.2.1, the 11.2 band profile is not studied for the class sources and only 5 sources of class are included in this sample (Table 1).
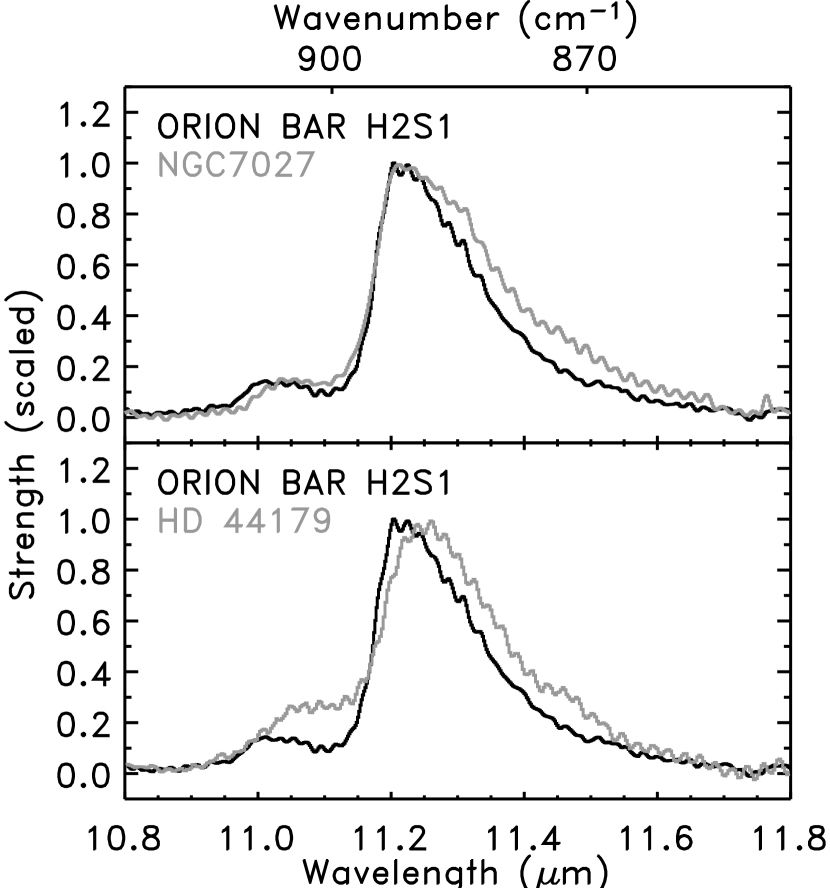
All sources in this reduced sample show a pronounced 11.2 feature, sometimes preceded by a weak feature at about 11.0 . The emission profiles of the 11.2 feature are distinctly asymmetric with a steep blue rise and a red tail. A definite range in peak positions and in the strength of the red wing when normalized so that the profile’s peak intensity equals 1 (denoted as tail-to-top ratio) is present in our sample. Perusing the derived profiles, we recognize 2 main classes, which we will designate by and (Table 2, Fig. 3). First, the majority of the 11.2 bands peak between 11.20 and 11.24 , show a very steep blue rise, and have a low tail-to-top ratio (Fig. 3, top panel, black profile). This group will be referred to as class . Within this class, the peak position and the top of the profiles vary slightly. Class represents sources with a peak position of 11.25 , a less steep blue rise (compared to class ) and a high tail-to-top ratio (Fig. 3, bottom panel). A few sources (class ) clearly belong to class in term of peak position and steepness of the blue wing, but have a tail-to-top ratio similar to class (Fig. 3, top panel, gray profile).
| Class | peak wavelength | FWHM | profile | |||
|---|---|---|---|---|---|---|
| m | cm-1 | m | ||||
| 3.290 | 3039 | 0.040 | symmetric | |||
| 3.293 | 3037 | 0.037 | asymmetric | |||
| 3.297 | 3033 | 0.037 | asymmetric | |||
| 11.20-11.24 | 889.6-892.9 | 0.17 | asymmetric | |||
| 11.20-11.24 | 889.6-892.9 | 0.21 | asymmetric | |||
| 11.25 | 888.9 | 0.20 | asymmetric | |||
3.3 Feature profile correlations
Comparing the classifications of the main PAH bands (Table 1), we find i) 34 (out of 49) sources where all classified features belong to either class A or class B or class C, of which 31 are class A and 3 are class B, ii) 6 sources where all classified features except the 3.3 feature belong to either class A or class B or class C and iii) 2 sources where all classified features except the 11.2 feature belong to either class A or class B or class C. Concluding, we can see that in this large sample of sources, the longer wavelength feature profiles correlate slightly better with each other than with the 3.3 feature.
To illustrate the observed variations in the class profile
correlations, a few examples can be given. HD 44179 and HR 4049 have
class profiles, considering all features. BD+30 3639, however, has
6–9 m features of class and 3.3 and 11.2 m features of
class . Other sources, as IRAS 17047-5650 and He 2-113, have 3.3
m features of class , but class for the longer
wavelength features. Of the two sources of class , one
(IRAS 13416-6243) has a 3.3 m feature of class and the
other (CRL 2688) of class . In contrast, within the 6–9
m range, spectral class also (almost) invariably
implies and and vice versa. The 11.2 m
classes follow, in this respect, more the 6–9 m trend than
the 3.3 m behaviour.
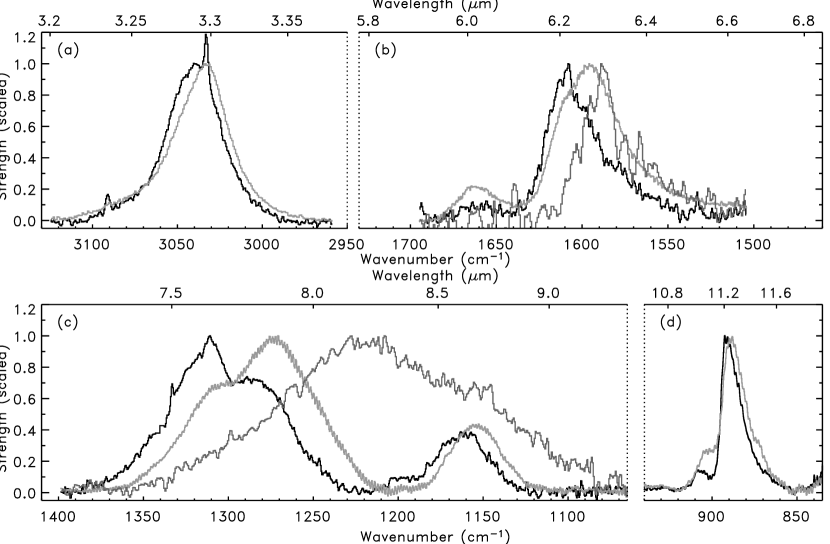
Perusing the spectra, it is striking that the variations in the 6–9
m region are much more pronounced than those of the 3.3 or 11.2
m features (cf., Fig 4; Table
2 and Table 3 of PHV02). Specifically the
maximum peak position separation in wavenumber space varies in going
from class A to B by about 20, 80 and 15 cm-1 for the 6.2, 7.7
and 8.6 m features, respectively, and only by about 6.5 and 4.0
cm-1 for the features at 3.3 and 11.2 m, respectively.
From an astronomical point of view, correlations between the classes
and the different object types are also found. Almost all H II regions, non-isolated Herbig AeBe stars and YSO’s in our sample are in
class , considering all features. An interesting exception is the
Orion Bar position D2, showing a feature and class
6–12 m features. The galaxies in our sample are in class ,
considering all features, except for the 11.2 m feature, which is
of class or . Most PNe have 6–9 m
features of class , a 3.3 m feature of class
and a 11.2 m feature of class or . The PN
Hb5 has a 11.2 m feature of class while the other
bands belong to class . The Post-AGB stars in our sample are
spread over the classes. IRAS 16279-4757 is in class considering
all features. IRAS 21282+5050 has a 11.2 m feature of class
while the other bands belong to class . The two
extreme metal poor binary system Post-AGB stars, HD 44179 and HR 4049,
are in class considering all features. The same is true for the
isolated Herbig AeBe star HD 179218, although its 11.2 m feature
is too weak/noisy to be classified. Thus, in conclusion, the
correlation between profile class and object type is much tighter in
the 6–9 m region than in the 3.3 and 11.2 m
regions.
4 The infrared emission features and PAHs
The 3.3 and 11.2 m PAH bands arise from the radiative relaxation of CH stretching and CH out-of-plane bending modes of highly vibrationally excited polycyclic aromatic hydrocarbons. This is in contrast with the nature of the 6.2 and 7.7 PAH features which originate from vibrations mainly involving CC stretching motions. Thus, while one would expect strong global correlations amongst all of the bands that arise from the same family of molecules, when comparing the behavior of bands involving CH modes with those involving CC modes, subtle but important differences in behavior are expected. These differences reflect not only differences in local conditions, but also structural differences within the emitting family itself, and in the case of the 3.3 m band emission from a distinctly different subset of the emitting PAH population.
While discussing the dependence of the precise position of any vibrational mode, one should keep in mind that the vast majority of the laboratory data available to address each of these bands has been measured in absorption, not emission. In the astrophysical case, where PAH spectra are measured in emission instead of absorption, the extent of molecular excitation also influences peak position and profile. The interstellar spectrum arises from the combined emission of a complex mixture of vibrationally excited PAHs. In emission, each individual line should have an approximately 30 cm-1 FWHM, consistent with the natural linewidth expected from each emitting molecule (Allamandola et al., 1989). This natural linewidth arises from intramolecular vibrational energy redistribution, not the blending of individual rotational lines in the emitting molecules which remain rotationally cool throughout the excitation/emission process (e.g. Brenner & Barker, 1992; Cook & Saykally, 1998). Due to the high internal energy content of the emitting molecules, a 10 to as much as 40 cm-1 peak position redshift is intrinsic to the emission process depending on the internal excitation and the emitting feature wavelength (Flickinger et al., 1991; Brenner & Barker, 1992; Colangeli et al., 1992; Joblin et al., 1995; Cook et al., 1998; Wagner et al., 2000).
4.1 The CH stretching mode and the 3.3 band
As with all fundamental vibrational frequencies, the precise position of the 3.3 band depends on many factors including charge state, molecular size, structure, molecular heterogeneity, and so on. Each of these factors which influence fundamental band position are discussed below.
Charge state :
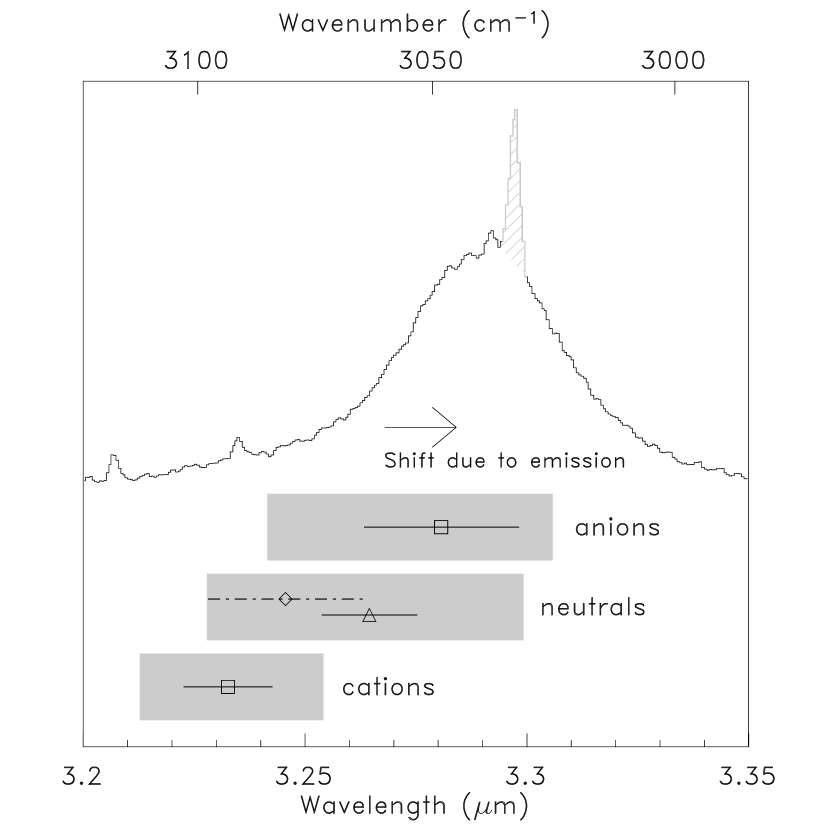
The strongest constraint concerns charge state of the PAHs responsible for the interstellar 3.3 m emission band. In the Astrochemistry Laboratory at NASA Ames, we now have the experimental infrared spectra of over 100 isolated PAHs in their neutral as well as positively charged states. This spectral database is comprised of PAHs with a number of carbon atoms, NC, between 10 and 50. These data are supplemented with theoretical spectra which extend the size to NC=96. The number of PAHs for which anion spectra are available is considerably smaller, currently 27. Analysis of these spectra shows that the CH stretching frequencies are sensitive to PAH charge as well as size (Hudgins et al., in prep.). This is illustrated in Fig. 5, which compares the interstellar emission feature from NGC 7027 (class A3.3) to the charge specific CH stretch regions for the entire Ames sample. Fig. 5 shows that the CH stretch in PAH anions spans the range from 3085 to 3025 cm-1 (3.24 to 3.30 m), neutral PAHs from 3094 to 3042 cm-1 (3.23 to 3.29 m), and PAH cations from 3112 to 3073 cm-1 (3.21 to 3.25 m). The symbol within each range indicates the average position for the PAHs in the Ames database. These are 3048, 3081, 3063 and 3093 cm-1 (3.28, 3.24, 3.26 and 3.23 m) for the anionic forms, large neutrals, small neutrals and the cationic forms respectively.
PAH cations seem least likely to contribute to the 3.3 feature. First, Fig. 5 shows they require the largest redshift possible (40cm-1) to overlap only the blue wing of the feature. Second, PAH cations have inherent weak emission in the 3.3 region, i.e. the CH band of cations is suppressed by a factor 50 to 100 compared to that of neutral PAHs (Langhoff, 1996). Lastly, the 3.3 and 11.2 bands are well correlated and behave differently then the 6.2 and 7.7 bands which are dominated by PAH cations (Hony et al., 2001). In contrast, Fig. 5 shows that the CH stretches for neutral PAHs, when redshifted due to the high internal energy content, fall directly under the most intense portion of the interstellar 3.3 m band envelope while the PAH anions require a small redshift to fall underneath the 3.3 band envelope. The breadth and small variance of the interstellar 3.3 m emission band likely arises because the CH stretching position (in absorption) for the vast majority of isolated, neutral and anionic PAHs falls between 3085 to 3025 cm-1. With the 10 to 40 cm-1 redshift inherent in emission, this range becomes 3075 to 2985 cm-1 (3.25 to 3.35 m), a range which straddles the wavelength region of this feature listed in Table 2.
Size :
PAH size is particularly important in the case of the interstellar 3.3 m band since this feature originates from the smallest members of the emitting PAH population (Allamandola et al., 1989; Schutte et al., 1993). PAHs containing between roughly 25 to 70 carbon atoms contribute most of the emission in this feature, with the species between NC 25 to 50 dominant. This is in contrast to the situation for the longer wavelength emission features which arise from increasingly larger, and overlapping members of the interstellar PAH population.
Interestingly, within the size range of the current Ames sample, there appears to be a bimodal distribution of the frequencies for the neutral species (see Fig. 5). For the neutral PAHs, the CH stretch for the smallest members of the sample is centered near 3060 cm-1 (3.27 m), while the larger members have frequencies centered at 3090 cm-1 (3.24 m). The origin of the bimodal distribution is not clear from the current sample.
Edge Structure :
PAH edge structure is also important. If the periphery of an individual PAH is not regular, the local environment, that each CH bond samples, can perturb the individual stretching frequencies. Thus, for a large molecule with long straight edges there is little interaction between the stretching motions of CH groups on adjacent rings and the FWHM of the dominant peak in the region is 18 cm-1 (0.019 m at 3.3 m). On the other hand, if a similarly large molecule that has jagged edges with many “notches” and “bay regions”, CH groups on opposing sides of these gaps interact, perturbing their stretching motions. As a result, the FWHM of the CH stretching feature in such a species is substantially broadened and may be as wide as 70 cm-1 (0.074 m) or more (Hudgins et al., in prep.).
Heteroatom substitution :
Mattioda et al. (2003) have investigated the spectra of 11 N-substituted PAHs, spanning the NC range from 9 to 21, and found that nitrogen substitution does not influence the CH stretching band frequency. N substitution does influence other PAH vibrational transitions (PHV02; Mattioda et al., 2003, Hudgins, Bauschlicher, & Allamandola, in prep.)
4.2 The CH out-of-plane bending modes
The aromatic CH out-of-plane bending features in the 11 to 15 spectral region are a good diagnostic for the classification of the aromatic ring edge structures. Indeed, the positions and intensities of the bands in this spectral region reflect the type and number of adjacent CH groups on the peripheral rings of the PAH structure (Bellamy, 1958; Allamandola et al., 1985; Cohen et al., 1985; Léger et al., 1989; Roche et al., 1989; Witteborn et al., 1989; Allamandola et al., 1999; Hudgins & Allamandola, 1999, HVP01). Our current understanding is illustrated in Fig. 6 which schematically compares the average interstellar emission spectrum with the wavelength regions associated with different CH adjacency classes for neutral and ionised, isolated PAHs. Inspection of this Figure shows that, while the ranges for matrix-isolated neutral PAHs do not differ substantially from those reported in the literature, ionisation produces some notable changes in region boundaries (Hudgins & Allamandola, 1999). Taking into account the roughly 0.1 red-shift in the peak wavelength of 11.2 PAH band in emission relative to their position in absorption, the following conclusions are drawn (Hudgins & Allamandola, 1999, HVP01) : (i) The weak interstellar emission band sometimes observed on the short wavelength side of the dominant 11.2 band and peaking near 11.0 falls in the region attributable to the solo-CH modes of PAH cations; (ii) The peak of the 11.2 interstellar band falls squarely within the region for the solo-CH modes of neutral PAHs and at the extreme long wavelength end of the range for solo cationic modes; (iii) The variable red wing of the interstellar 11.2 band likely carries a contribution from the duet-CH modes of PAH cations, particularly those with condensed structures whose features tend to fall near the lower extreme of the characteristic region shown in Fig. 6.

4.3 The CC stretching modes
The CC stretching modes occur in the 6–9 m range. Within this range, the band at the longer wavelengths have a mixed CC stretch and CH in-plane-bending vibration character. All CC modes are very weak relative to the CH modes in neutrals, but become the dominant bands in ions (Szczepanski & Vala, 1993; Langhoff, 1996; Hudgins et al., 1994; Kim et al., 2001). Hence, we will focus here on the CC modes in cations. The peak position of the pure CC stretch is influenced by molecular size, structure, and molecular heterogeneity (see e.g. PHV02). Extensive laboratory and theoretical quantum mechanical studies have shown that a peak as blue as 6.2 m does not occur for pure-C PAH cations in the (interstellar) size range 20-100 C-atoms. Substitution of N deep in the fused ring system induces strong IR activity of the CC modes at the highest frequencies within this range and bands around 6.2 m do become intense (PHV02, Hudgins, Bauschlicher & Allamandola, in prep.). This is the result of the delocalisation of the charge across the entire PAH as a result of incorporating N in the ring. While there is presently no corroborating experimental or theoretical evidence, a similar behavior may occur for large PAHs with uneven and irregular edge structures, PAH clusters and/or PAH complexes with metals. For the longer wavelength modes, both pure-C PAH cations as well as N-substituted PAH cations can show prominent bands near the interstellar 7.6 m position. The origin of the 7.8 m band is more enigmatic, however, and no good match with laboratory species exists.
5 Discussion
From the wealth of medium resolution IR spectra, it is clear that the major PAH features show clear variations in profile and peak position. Large variations are found in profiles of the features in the 6–9 region while smaller ones are found in those of the 3.3 and 11.2 features. Furthermore, the 3.3 feature is very invariant under highly variant physical conditions. The different profile classes are linked with each other and with object type; this correlation, however, is more apparent in the 6–9 region than in the 3.3 and 11.2 regions.
5.1 The observed trends
Tokunaga et al. (1991) recognized two types of 3.3 m features based on spectra taken with a aperture. The profile, peak position and width of their type 1 agree well with class defined here. Their type 2 has a similar peak wavelength compared to our classes , but is much narrower, with a FWHM of 0.020 m. Most sources of their sample belong to Type 1 while Type 2 is associated with only 3 sources (HD 44179, Elias 1, WL 16). The 3.3 PAH band in the ISO-SWS spectra (obtained through an aperture of x) of their Type 1 sources belongs to class while those of HD 44179 and Elias 1 belongs to class (see Table 1 and Van Kerckhoven (2002) for Elias 1). Kerr et al. (1999) and Song et al. (2003a) showed, in a detailed spatial study of HD 44179, that the 3.3 m profile varies, going from Type 2 to Type 1 with distance from the central star. Hence, the observed profile will depend on the sampled area on the sky. In particular, the 3.3 m profile of HD 44179 in our sample is observed through an aperture x and thus has an averaged profile of both Type 1 and 2 profiles, thereby explaining its large FWHM compared to the profile found by Tokunaga et al. (1991), Kerr et al. (1999) and Song et al. (2003a). In addition, the Type 1 / class A3.3 profile is not unique to certain object types. Whether the Type 2 profile only occurs in specific sources is currently unknown. However, few sources are found that show a Type 2 or class B3.3 profile. All except one are post-AGB stars (3), isolated HAeBe stars (3) and an emission line star (Molster et al. (2002) classifies MWC 922 as disk-like based upon the spectral energy distribution and its mm continuum flux). Apparently, a circumstellar environment where dust formation is on-going or a protostellar/protoplanetary environment is an essential but not sufficient condition to have Type 2 or class B3.3 profiles. Indeed, some post-AGB stars or HAeBe stars show a Type 1 / class A3.3 profile. The fact that the 3.3 m feature varies considerably less than the other main features and mostly exhibits the A3.3 / Type 1 profile indicates that the conditions that give rise to the B3.3 and/or Type 2 profiles are more easily lost than those that give rise to the B (and C) types for the other bands. Song et al. (2003b, 2004 in prep.) and Miyata et al. (2004) also reported a varying 8.6 and 11.2 profile in HD44179, with a peak position going to shorter wavelengths with distance from the star and hence going from class B to class A. Note that also the 3.3 feature also shifts bluewards with distance from the star indicating that these three PAH feature are correlated in this source. Similar as for the 3.3 feature, the observed profile will depend on the sampled area on the sky. In addition, class A profile is not unique to certain object types.
Tokunaga et al. (1991) noted that the central stars of the few sources showing a Type 2 profile, all had relatively low effective temperatures ( K), suggesting a correlation between stellar effective temperature and PAH feature profiles. However, both profile types are found within HD 44179 (Kerr et al., 1999; Song et al., 2003a). At the same time, some objects in our sample have a relatively low stellar temperature, e.g. IRAS 03260+3111 (Jaschek et al. 1964), but still show an A3.3 class profile. This demonstrates that the effective temperature cannot be the sole cause of the variations in the 3.3 m feature profile. Van Kerckhoven (2002) and PHV02 have reached similar conclusions for the longer wavelength features.
Since variations are seen within objects, it may be that the local radiation field, , influences the profiles of the feature. However, no link between and the different classes of the 3.3 and 11.2 features is found. Indeed, for both features individually, the range in of the sample sources classified as class straddles that of class and class sources. Analogously, PHV02 found no relation between and profiles of the 6–9 PAH emission features. Hence, we can conclude that G0 alone cannot be the factor determining the observed variation in the main PAH emission features from source to source (observed through a large aperture).
5.2 The origins of the variations in the 3.3 and 11.2 CH emission features
In the framework of the PAH hypothesis, the profiles and thus also the variations in the profiles reflect the present molecular ensemble and the excitation conditions. In the following, we examine if we can isolate any effect which is clearly reflected in the observed variations of the profiles.
5.2.1 Anharmonicity
The profiles are very characteristic for anharmonic broadening in highly vibrationally excited molecules (Barker et al., 1987; Kim et al., 2001; Verstraete et al., 2001; Pech et al., 2002). Due to cross-coupling between different modes, the peak position of an IR band will shift towards lower frequencies. Integration over the energy cascade, leads then to a red shaded profile. The red wing can be further enhanced due to emission from vibrationally excited levels (e.g. vibrational hot bands, ) which are generally shifted towards the red due to the anharmonicity of the vibrational potential of the mode. These anharmonicities can be quite different for different modes. Anharmonicity parameters for a few small PAHs have been estimated from laboratory studies on the temperature dependence of the peak wavelength and width of the absorption bands (Joblin et al., 1995) and from the difference between low temperature absorption measurements and infrared multi-photon dissociation studies of trapped PAH ions (Oomens et al., 2003).
The effects of anharmonicity have been studied theoretically (Verstraete et al., 2001; Pech et al., 2002). These studies show that the general characteristics of the interstellar 3.3, 6.2 and 11.2 m bands are well understood in the framework of highly excited PAHs. However, these models cannot explain the large shift observed in the 6.2 m band between classes , , and . Such a shift can only reflect a chemical/structural modification of the emitting PAHs, for example due to the incorporation of N (PHV02; Hudgins, Bauschlicher, & Allamandola, in prep.).
The calculated 3.3 profiles of Pech et al. (2002) show that an increase in excitation – either through a decreased size or an increase in internal energy – shifts the peak position towards the red and simultaneously increases the FHWM (note that the calculated 3.3 profile has a larger asymmetry factor than observed in space). Our class profiles and the Type 2 profiles peak at longer wavelengths but have smaller FWHM compared to class / Type 1 profiles. Thus, the variation in profiles between classes / Type 1 and either or Type 2 can not be due to anharmonicity.
Perusing the Pech et al. (2002) 11.2 model profiles, we notice that an increase in excitation – either through a decreased size or an increase in internal energy – does increase the strength of the red wing but can not shift the peak position or change the blue rise. In their study of the 11.2 m band, Pech et al. (2002) focused on IRAS 21282+5050, a class A(B)11.2 source and indeed the A(B)11.2 profile can be interpreted as originating from the same PAH population that gives rise to the A11.2 profile excited to higher internal energy. In contrast, the difference between A11.2 and B11.2, with the band as a whole displaced, are not readily explained within the anharmonicity model.
5.2.2 Composition
The 3.3 and 11.2 CH bands are likely due to the presence of a family of PAH molecules and hence, the variation in peak position and profile of the CH modes likely represents a small but significant difference in the population of emitting species. The variation in the peak position of the 3.3 and 11.2 m band, measured in the laboratory or quantum-chemically calculated, is much larger (0.02 m; 20 cm-1 and 0.3 m; 20 cm-1 respectively) than observed in space ( 0.007 ; 6 cm-1 and 0.05 m; 4 cm-1 respectively). Although the convolution of the size distribution with the excitation conditions can lead to a different dispersion for the peak positions (compared to absorption bands measured in the lab), it is likely that only a small subset of the PAHs studied by these means contribute to the observed emission from space.
5.2.3 Molecular edge structure
The 3.3 feature :
If we assume that the variation in the FWHM of the 3.3 feature between class A3.3 / Type 1 and either B3.3 or Type 2 is mainly influenced by the molecular edge structure, this observed variation in FWHM (and hence in class) implies that the PAH family present in class B3.3 and Type 2 sources are dominated by more compact PAH molecules compared to the PAH family present in class A3.3 / Type 1 sources (Sect. 4.1 and Table 2). Since the molecular structure of the PAH molecules can be deduced based on the relative strengths of the CH out-of-plane bending modes (HVP01) and assuming that the PAHs responsible for the 3.3 band have similar molecular structure as those for the 11.2 band (although these features arise from the emission of a different subset of PAHs), we can test the dependence of the FWHM of the 3.3 feature on molecular structure. Let’s consider the following sources : HD 44179 belonging to and ; NGC 7027, member of and and the IRAS 18317 representing classes and . HVP01 found that NGC 7027 is dominated by large, compact PAHs with straight edges and IRAS 18317 by smaller or irregular PAHs. Although these two sources represent the extremes in the observed intensity ratio in their sample and hence the extremes in molecular structure, they both belong to . In addition, the relative strengths of the CH out-of-plane bending modes of HD 44179 are comparable to NGC 7027 and hence their molecular structure is similar (HVP01). However, their 3.3 features belong to different classes. Therefore, we can conclude that the molecular edge structure is likely not the main cause of the variation in the FWHM of the 3.3 feature.
The 11.2 feature :
The little variance of the CH out-of-plane bending modes may be an inherent property of interstellar PAHs. Within the subset of PAHs studied in the laboratory or quantum chemically, the peak position of the solo modes in neutral and cation PAHs falls very closely to the observed interstellar peak position of 11.2 m, with the neutral PAHs dominating the emission (see Fig. 8 in HVP01). Now, possibly, any molecular structure variations, which lead to shifts in the 6–9 m CC bands, may be inherently accompanied by modification of the CH peripheral structure which turn CH solo’s into duo’s or trio’s.
Duet CH’s of compact PAH cations may contribute to the red wing of the
11.2 band
(Sect. 4.1 Hudgins & Allamandola, 1999, HVP01). Hence,
it is possible that the observed variation in the 11.2 band
reflects variation in the contribution of these cationic duet
modes. This would imply that and objects have
more compact PAH cations with duets. Analysis of the pattern of
emission features in the CH out-of-plane bending modes region (i.e.
10–15 , HVP01) reveals that evolved stars are dominated by large
compact structures while H II regions are dominated by irregular
structures and hence is consistent with this conclusion.
5.2.4 Carbon isotope effects
Based upon laboratory studies, shifts in the peak positions of the interstellar IR emission features have been attirbuted to 13C isotope substitution (Wada et al., 2003). We note that, while this might be important in some extreme circumstellar environments (such as the Red Rectangle), this cannot be a general explanation for the observed shifts. First, not all the features shift in the same way at all times. Second, we see pronounced variations in material which is interstellar in origin and where isotope subsitution should be minimal. The observed variations within a single H II region or reflection nebula present, of course, a case in point (Joblin et al. in prep. Bregman & Temi, 2004).
To summarise, the variation in peak position is likely due to the presence of a mixture of PAH molecules whose composition changes. Both anharmonicity and molecular structure can explain variation in the FWHM of the 11.2 feature. In contrast, the variation in the FWHM of the 3.3 feature between class A3.3 / Type 1 and Type 2 remains an enigma although it might be the result of a change in composition of the PAH family. The larger FWHM of our class B3.3 likely originates from the average (through a large aperture) of Type 2 and Type 1 / class A3.3 profiles with a dominating Type 2 contribution.
5.3 The different behaviour of the CH modes versus the CC modes
Perusing the spectra, it is striking that the variations in the 6–9 m region are much more pronounced than those of the 3.3 or 11.2 m features (cf., Fig 4; Table 2). This implies that variations in the features assigned to CC modes are significantly larger than those assigned to CH modes. Here we discuss what could be the root of this dichotomy.
5.3.1 Charge state
Experimentally and quantum chemically, it is well established that the 6–9 m CC modes are dominated by cations while the 3.3 m CH stretching mode can be due to neutrals and anions (Fig.5 Sect.4.1, Szczepanski & Vala, 1993; Langhoff, 1996; Hudgins & Allamandola, 1999; Kim et al., 2001, Mattioda et al., in preparation). There is some observational support that this dichotomy between the CC and CH stretching modes, also extends to the 11.2 m CH out-of-plane bending mode (HVP01). Specifically, the strength of the astronomical 11.2 m mode correlates well with the 3.3 m CH stretching band and not with the 6.2 m CC stretching band. The difference in spectral variations between CH and CC modes may merely reflect that they probe different parts of the interstellar PAH population. For example, the chemical modification process might be mainly operative on cations and not on neutrals. In that respect, because ionisation and neutralisation of interstellar PAHs occurs on a very rapid timescale, this would imply a similar fast chemical exchange. Such a fast process would also allow for spatial variations within a source. It should be noted that it is unlikely that this rapid behaviour is connected with the incorporation on N in PAH rings. However, functionalized PAHs, PAH clusters or PAH-metal complexes may be formed and broken on a similar timescale (Van Kerckhoven, 2002).
5.3.2 Heteroatom substitution and complexes
Substitution of nitrogen in the ring can explain variation in the 6.2 m band position. However, it does not influence the peak position of the CH modes nor does it influence the peak positions of the 7.7 complex in a systematic way. However, as mentioned above, it is unlikely that N-incorporation deep within a PAH can occur on such a rapid timescale as to explain the spatial variations within a source. Complexes of PAHs with each other or with metal atoms might also cause the spectral variation in the 6–9 range. However, the influence of complexation on the CH modes still has to be investigated in the laboratory.
5.3.3 Size
The very small variation of the 3.3 feature with respect to the CC modes and to the CH out-of-plane bending modes, is likely also related to distinct subsets of emitting PAH molecules. Indeed, the 3.3 feature originates from the smallest members of the emitting PAH population while the PAH features in the 6–12 region originates from somewhat larger PAHs in the population (Schutte et al., 1993). This would indicate that photo-chemistry is not the driving force behind the observed spectral variation since smaller PAHs will be much more susceptible to unimolecular dissociation following photon absorption and hence larger variations would be expected for the 3.3 feature than for higher wavelength features, in contradiction to what is observed. In addition, this might suggest that while the larger PAHs are modified, the smaller ones are destroyed. This would leave only the most stable small PAHs to emit the 3.3 feature, while a mixture of modified larger PAHs survive to give rise to the higher wavelength features.
5.3.4 Molecular edge structure
As already mentioned, any molecular structure variations, which lead to shifts in the 6–9 m CC bands, may be inherently accompanied by modification of the CH peripheral structure which turn CH solo’s into duo’s or trio’s.
To summarise, several parameters can cause the difference in the amount of variation between the CH and CC modes. However, further laboratory studies are required to determine which of these parameters(s) controls the spectral characteristics of PAHs in space. Based on the rough correlation of most of the band profiles one can stipulate that the appearance of the UIR emission features is determined by a few physical parameters alone. However, there are several sources which do not follow these correlations. This implies that the behavior cannot be understood in terms of a single parameter.
6 Conclusions
Based on ISO-SWS observations, we have studied the profiles of the 3.3 and 11.2 PAH features of a wide variety of sources and found that clear variations are present. Both features shift in peak position and show different profiles from source to source. Comparing the 3.3, 6–9 and 11.2 m classifications, we recognise a correlation between them. In general, an classification in 6–9 m region also implies an and . However, this seems not true for the and classifications; and do not necessarily correlate with each other or with or . In addition, these variations depend on the type of object considered. Apparently, a circumstellar environment where dust formation is on-going or a protostellar/protoplanetary environment is an essential but not sufficient condition to have peculiar 3.3 or 11.2 profiles. Noteworthy is the fact that the three galaxies in our sample show the same profile as the HII regions, except for the 11.2 profile which ressembles that of some evolved stars.
Spatial variations of the profiles within a source indicate that specific profiles are not unique to certain object types and that the observed profile depends on the aperture. Nevertheless, the average (or predominant) profile (as observed with ISO-SWS which has an aperture of x) present within a source does depend on object type.
However, the most striking aspect of the features in the 3–12 regions is the pronounced contrast in the profile variations between the CH modes and the CC modes. Specifically, the peak position in wavenumber space varies by about 20, 80 and 15 cm-1 for the 6.2, 7.7 and 8.6 m features, respectively, and only by about 6.5 and 4.0 cm-1 for the features at 3.3 and 11.2 m, respectively.
We summarise existing laboratory data and theoretical calculations of the modes emitting in the 3–12 region of PAH molecules. In contrast to the 6–9 region which arise from PAH cations, the 3.3 band appears to originate mainly in neutral and/or negatively charged PAHs.
We attribute the variations in peak position of the 3.3 and 11.2 feature to the presence of a mixture of PAH molecules, whose composition changes. The variations in FWHM of the 3.3 feature remains an enigma – although might result from the change in composition of the PAH family – while those of the 11.2 can be explained by anharmonicity and molecular structure. The possible origin of the observed contrast in profile variations between the CH modes and the CC modes is highlighted.
The overall good agreement that can be achieved between the IS spectra and the spectral characeristics of free PAHs strongly supports the PAH model and allows these spectra to become a probe of local conditions. However, it is clear that some features of the major band profiles and the minor bands cannot be accounted for by ”classical” PAHs. Other PAH related species such as PAH clusters, heteroatom PAHs and PAH-metal complexes should also be considered.
References
- Allamandola et al. (1999) Allamandola, L. J., Hudgins, D. M., & Sandford, S. A. 1999, ApJ, 511, L115
- Allamandola et al. (1985) Allamandola, L. J., Tielens, A. G. G. M., & Barker, J. R. 1985, ApJ, 290, L25
- Allamandola et al. (1989) Allamandola, L. J., Tielens, A. G. G. M., & Barker, J. R. 1989, ApJS, 71, 733
- Bakes & Tielens (1994) Bakes, E. L. O. & Tielens, A. G. G. M. 1994, ApJ, 427, 822
- Bakes et al. (2001) Bakes, E. L. O., Tielens, A. G. G. M., & Bauschlicher, C. W. 2001, ApJ, 556, 501
- Barker et al. (1987) Barker, J. R., Allamandola, L. J., & Tielens, A. G. G. M. 1987, ApJ, 315, L61
- Bellamy (1958) Bellamy, L. 1958, The infra-red spectra of complex molecules, 2nd ed. (New York: John Wiley & Sons, Inc.)
- Boulanger et al. (1998) Boulanger, F., Boisssel, P., Cesarsky, D., & Ryter, C. 1998, A&A, 339, 194
- Bregman & Temi (2004) Bregman, J. & Temi, P. 2004, A&A, in press
- Brenner & Barker (1992) Brenner, J. & Barker, J. R. 1992, ApJ, 388, L39
- Cohen et al. (1986) Cohen, M., Allamandola, L., Tielens, A. G. G. M., et al. 1986, ApJ, 302, 737
- Cohen et al. (1985) Cohen, M., Tielens, A. G. G. M., & Allamandola, L. J. 1985, ApJ, 299, L93
- Colangeli et al. (1992) Colangeli, L., Mennella, V., & Bussoletti, E. 1992, ApJ, 385, 577
- Cook & Saykally (1998) Cook, D. J. & Saykally, R. J. 1998, ApJ, 493, 793
- Cook et al. (1998) Cook, D. J., Schlemmer, S., Balucani, N., et al. 1998, Jour. Phys. Chem. A, 102, 1465
- de Graauw et al. (1996) de Graauw, T., Haser, L. N., Beintema, D. A., et al. 1996, A&A, 315, L49
- Flickinger et al. (1991) Flickinger, G. C., Wdowiak, T. J., & Gomez, P. L. 1991, ApJ, 380, L43
- Geballe et al. (1985) Geballe, T. R., Lacy, J. H., Persson, S. E., McGregor, P. J., & Soifer, B. T. 1985, ApJ, 292, 500
- Gillett et al. (1973) Gillett, F. C., Forrest, W. J., & Merrill, K. M. 1973, ApJ, 183, 87
- Goto et al. (2003) Goto, M., Gaessler, W., Hayano, Y., et al. 2003, ApJ, 589, 419
- Hony et al. (2001) Hony, S., Van Kerckhoven, C., Peeters, E., et al. 2001, A&A, 370, 1030
- Hudgins & Allamandola (2004) Hudgins, D. M. & Allamandola. 2004, in Astrophysics of Dust, eds. Witt, A. N. , Clayton, G. C. , & Draine, B. T., Astronomical Society of the Pacific, in press
- Hudgins & Allamandola (1999) Hudgins, D. M. & Allamandola, L. J. 1999, ApJ, 516, L41
- Hudgins et al. (1994) Hudgins, D. M., Sandford, S. A., & Allamandola, L. J. 1994, J. Phys. Chem., 98, 4243
- Jaschek et al. (1964) Jaschek, C., Conde, H., & de Sierra, A. C. 1964, Observatory Astronomical La Plata Series Astronomies, 28, 1
- Joblin et al. (2000) Joblin, C., Abergel, A., Bregman, J., et al. 2000, ISO beyond the peaks: The 2nd ISO workshop on analytical spectroscopy. Eds. A. Salama, M.F.Kessler, K. Leech & B. Schulz. ESA-SP, 456, 49
- Joblin et al. (1995) Joblin, C., Boissel, P., Leger, A., D’Hendecourt, L., & Defourneau, D. 1995, A&A, 299, 835
- Kerr et al. (1999) Kerr, T. H., Hurst, M. E., Miles, J. R., & Sarre, P. J. 1999, MNRAS, 303, 446
- Kessler et al. (1996) Kessler, M. F., Steinz, J. A., Anderegg, M. E., et al. 1996, A&A, 315, L27
- Kim et al. (2001) Kim, H. S., Wagner, D. R., & Saykally, R. J. 2001, Phys. Rev. Lett., 86, 5691
- Langhoff (1996) Langhoff, S. R. 1996, Jour. Phys. Chem., 100, 2819
- Léger et al. (1989) Léger, A., D’Hendecourt, L., Boissel, P., & Desert, F. X. 1989, A&A, 213, 351
- Madden et al. (2003) Madden, S., Galliano, F., & Jones, A. 2003, in Astrophysics of Dust, Colorado, 2003. Ed. by A. N. Witt.
- Maillard et al. (1999) Maillard, J. P., Joblin, C., Mitchell, G. F., Vauglin, I., & Cox, P. 1999, The Universe as Seen by ISO, ESA SP, 427, 707
- Malfait et al. (1998) Malfait, K., Waelkens, C., Waters, L. B. F. M., et al. 1998, A&A, 332, L25
- Mattioda et al. (2003) Mattioda, A. L., Hudgins, D. M., Bauschlicher, C. W., Rosi, M., & Allamandola, L. J. 2003, Jour. Phys. Chem., 107, 1486
- Miyata et al. (2004) Miyata, T., Kataza, H., Okamoto, Y. K., et al. 2004, A&A, 415, 179
- Molster et al. (2002) Molster, F. J., Waters, L. B. F. M., Tielens, A. G. G. M., & Barlow, M. J. 2002, A&A, 382, 184
- Oomens et al. (2003) Oomens, J., Tielens, A. G. G. M., Sartakov, B. G., von Helden, G., & Meijer, G. 2003, ApJ, 591, 968
- Pech et al. (2002) Pech, C., Joblin, C., & Boissel, P. 2002, A&A, 388, 639
- Peeters et al. (2004a) Peeters, E., Allamandola, L. J., Hudgins, D. M., Hony, S., & Tielens, A. G. G. M. 2004a, in Astrophysics of Dust, eds. Witt, A. N. , Clayton, G. C. , & Draine, B. T., Astronomical Society of the Pacific, in press
- Peeters et al. (2002a) Peeters, E., Hony, S., Van Kerckhoven, C., et al. 2002a, A&A, 390, 1089
- Peeters et al. (2002b) Peeters, E., Martín-Hernández, N. L., Damour, F., et al. 2002b, A&A, 381, 571
- Peeters et al. (2004b) Peeters, E., Spoon, H. W. W., & Tielens, A. G. G. M. 2004b, ApJ, submitted
- Peeters et al. (2004c) Peeters, E., Tielens, A. G. G. M., Boogert, A. C. A., Hayward, T. L., & Allamandola, L. J. 2004c, A&A, submitted
- Puget & Léger (1989) Puget, J. L. & Léger, A. 1989, ARA&A, 27, 161
- Roche et al. (1989) Roche, P. F., Aitken, D. K., & Smith, C. H. 1989, MNRAS, 236, 485
- Schutte et al. (1993) Schutte, W. A., Tielens, A. G. G. M., & Allamandola, L. J. 1993, ApJ, 415, 397
- Song et al. (2003a) Song, I., Kerr, T., McCombie, J., & Sarre, P. 2003a, MNRAS, 346, L1
- Song et al. (2003b) Song, I., McCombie, J., Kerr, T., Couch, P., & Sarre, P. 2003b, in Astrophysics of Dust, Colorado, 2003. Ed. by A. N. Witt.
- Szczepanski & Vala (1993) Szczepanski, J. & Vala, M. 1993, Nature, 363, 699
- Tielens et al. (1999) Tielens, A. G. G. M., Hony, S., Van Kerckhoven, C., & Peeters, E. 1999, in ESA SP-427: The Universe as Seen by ISO, Vol. 427, 579
- Tokunaga et al. (1991) Tokunaga, A. T., Sellgren, K., Smith, R. G., et al. 1991, ApJ, 380, 452
- Van Kerckhoven (2002) Van Kerckhoven, C. 2002, PhD thesis, Katholieke Universiteit Leuven (Belgium)
- Vermeij et al. (2002) Vermeij, R., Peeters, E., Tielens, A. G. G. M., & van der Hulst, J. M. 2002, A&A, 382, 1042
- Verstraete et al. (2001) Verstraete, L., Pech, C., Moutou, C., et al. 2001, A&A, 372, 981
- Verstraete et al. (1996) Verstraete, L., Puget, J. L., Falgarone, E., et al. 1996, A&A, 315, L337
- Wada et al. (2003) Wada, S., Onaka, T., Yamamura, I., Murata, Y., Tokunaga, A. T. 2003, A&A, 407, 551
- Wagner et al. (2000) Wagner, D. R., Kim, H., & Saykally, R. J. 2000, ApJ, 545, 854
- Witteborn et al. (1989) Witteborn, F. C., Sandford, S. A., Bregman, J. D., et al. 1989, ApJ, 341, 270