eurm10 \checkfontmsam10 \pagerange1–8
Black Hole Growth & the –Bulge Relations
Abstract
We present the black hole mass–bulge velocity dispersion relation for a complete sample of 75 soft X-ray selected AGNs. We find that the AGNs with highest accretion rates relative to Eddington lie below the – relation of broad line Seyfert 1s, confirming the Mathur et al. (2001) result. The statistical result is robust and not due to any systematic measurement error. This has important consequences towards our understanding of black hole formation and growth: black holes grow by accretion in well formed bulges. As they grow, they get closer to the – relation for normal galaxies. The accretion is highest in the beginning and dwindles as time goes by. Our result does not support theories of the – relation in which the black hole mass is a constant fraction of the bulge mass/ velocity dispersion at all times or those in which bulge growth is controlled by AGN feedback.
in Galactic Nuclei††editors: Th. Storchi Bergmann, L.C. Ho & H.R. Schmitt, eds.
1 Introduction
The observation of a tight correlation between the velocity dispersion of the bulge in a galaxy and the mass of its nuclear black-hole was a surprising discovery over the last few years ([Gebhardt et al. 2000a, Ferrarese & Merritt 2000, Merritt & Ferrarese 2001])). Even more surprisingly, the above relation for normal galaxies was also found to extend to active galaxies ([Gebhardt et al. 2000b, Ferrarese et al. 2001]). A lot of theoretical models provide explanations for the – relation in the framework of models of galaxy formation, black hole growth and the accretion history of active galactic nuclei ([Haenhnelt 2003, Haehnelt et al. 1998], [King 2003]). To understand the origin of the – relation, and to discriminate among the models, it is of interest to follow the tracks of AGNs on the – plane.
Mathur et al. (2001) suggested that the narrow line Seyfert 1 galaxies (NLS1s), a subclass of Seyfert galaxies believed to be accreting at a high Eddington rate, do not follow the – relation. Here we present our results based on a complete sample of 75 soft X-ray selected AGN.
Note also that NLS1s are interesting objects as they occupy one extreme end of the “eigenvector 1” relation of AGNs ([Boroson 2003]). The most widely accepted paradigm for NLS1s is that they accrete at close to the Eddington rate and have smaller black hole masses for a given luminosity compared to BLS1s. Finding their locus on the – plane is therefore a worthwhile experiment anyway as we will either find that they occupy a distinct region compared to BLS1s or that they don’t. The first option is interesting for our understanding of black hole growth. On the other hand if we find that NLS1s follow the – relation like the BLS1s, it has important implications towards our understanding of the AGN phenomenon. We already have good evidence for smaller BH masses of NLS1s, at a fixed luminosity. If they follow the – relation, it would imply that NLS1s preferentially reside in galaxies with bulges of smaller velocity dispersion. This would be direct evidence for the dependence of AGN properties on their large scale galactic environment.
2 The – relation
We use luminosity and FWHM(H) as surrogates for black hole mass and FWHM([OIII]) as a surrogate for the bulge velocity dispersion. See Grupe & Mathur (2004; Paper I here on-wards) for the details of sample selection and for the validity of our method to estimate and .
Figure 1 shows that BLS1s and NLS1s occupy two distinct regions in the – plane. For a given velocity dispersion NLS1s tend to show smaller smaller black hole masses than BLS1s. If true, this is an important result. We emphasize that this is a statistical result; errors on both and are large (figure 1). As discussed in Paper I, this is not due to systematically underestimating BH masses of NLS1s. Moreover, BH mass estimates using two completely different methods give the same result: in Mathur et al. 2001, was determined by fitting accretion disk models to SEDs and in Czerny et al. 2001, power-spectrum analysis was used.

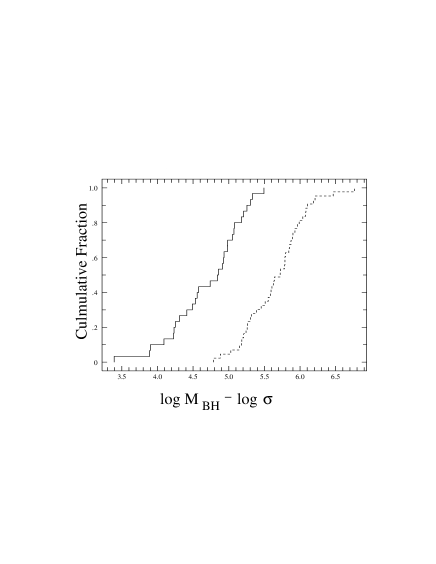
In Paper I we also scrutinize the use of FWHM([OIII]) as a surrogate for the bulge velocity dispersion. Clearly, there is a large scatter in the relation. The important thing to note, however, is that there is no systematic difference for the two classes BLS1s and NLS1s. We also explore possible problems specific to NLS1s, like strong FeII emission and [OIII] asymmetry, and find these do not affect the result either. We thus conclude that BLS1s and NLS1s occupy distinct regions in the – plane. This is clearly seen from figure 2 which plots the cumulative distribution of the ratio log(/) for BLS1s and NLS1s. The two classes are significantly different, with formal Kolmogorov-Smirnov (K-S) test probability of being drawn from the same population .
In Paper I, we interpret this result in terms of black hole growth: black holes grow significantly by accretion in well formed bulges and they reach the – relation eventually as the growth is complete. This scenario is consistent with the models of Miralda-Escudé & Kollmeier (2004) and also with the suggestion of NLS1s being young AGNs (Mathur 2000). While our statistical result is robust, the same is not obvious about its interpretation. This is because some NLS1s lie on/ very close to the – relation (figure 1, Mathur et al. 2001, [Bian & Zhao 2003]). Two NLS1s in Ferrarese et al. (2001) also lie on – relation. If we are to interpret the observations in terms of black hole growth by the highly accreting NLS1s, why have some NLS1s already reached their “final” mass?
The first hint towards the resolution of the above conflict came from the observations of Williams, Mathur & Pogge (2004). In Chandra observations of NLS1s, they found a significant fraction with flat X-ray spectra, and with low accretion rate relative to Eddington (ṁ). In the framework of the black hole growth scenario, such objects may then be the ones close to the – relation, as they would have already gone through their high ṁ state and their black holes accumulated most their mass.
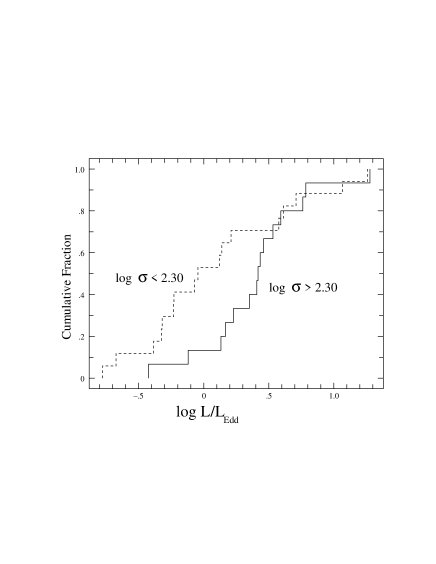
To test this hypothesis, we divided our NLS1 sample in two parts, with low and high values of with a boundary at log=2.3. The choice of the boundary came from visual inspection of figure 1, where it appears that the NLS1s with log below this value tended to be much closer to the – relation. Figure 3 compares the distribution of for the two samples. The K-S cumulative distribution for the two samples is significantly different with the formal K-S test probability of being drawn from the same population P=0.05. Consistently, we also find that the low NLS1s have flatter X-ray spectra.
The above results show that NLS1s are a mixed bag, some with steep but some with flat and some with large ṁ and some with small. The objects with large ṁ are the ones which lie below the – relation of dead black holes and black holes with low ṁ. Thus the interpretation presented in Paper I appears to be secure: black holes grow in mass substantially in their highly accreting phase. As they grow, they approach the – relation for normal galaxies. The mass growth in a low accretion phase, as in BLS1s and also in some NLS1s, appears to be insignificant. Any theoretical model attempting to explain the – relation will have to explain the above observations.
3 Further Tests
Needless to say, it is vital to measure and accurately to confirm the above result. Black hole mass estimates based on H widths are quite secure, but the same cannot be said about estimates of based on [OIII] widths. Even if FWHM([OIII]) is not a good surrogate for the nature of our result is such that would then have to be different for BLS1s and NLS1s, and this is most likely not the case as discussed in Paper I. Moreover, there is no observational result to support such a difference. If NLS1s had larger outflows, then they could have disturbed their narrow-line regions more compared to BLS1s. Again, there are no observations supporting such a case; on the contrary, absorbing outflows are seen less often in NLS1s (Leighly 1999). Larger in NLS1s does not necessarily imply larger effective radiation pressure. On the contrary, in objects with large soft X-ray excesses, like NLS1s, the absorbed radiation is actually much smaller (Morales & Fabian 2002). There is also general lore that highly accreting sources with large ṁ should have large outflows. While low efficiency accretion must lead to outflows (as in ADIOS, Blandford & Begelman 1999), the same is not true for efficient accretion as in bright Seyferts and quasars. Large outflows are observed in highly accreting sources like broad absorption line quasars, but that depends upon the ratio of gas supply to Eddington accretion rate, and is not inherent to the accretion process itself (R. Blandford, private communication).
Bulge velocity dispersion is usually measured with CaII triplet line and this technique has been used to measure in two NLS1s (Ferrarese et al. 2001). However, for many of the NLS1s in our sample, the CaII lines fall in the water vapor band in the Earth’s atmosphere. In many NLS1s for which CaII line is accessible from ground, CaII is observed in emission rather than in absorption (Rodriguez-Ardila et al.2002). This makes use of CaII absorption features to determine difficult for the targets of interest. We plan to use two different methods for alternative estimates of : (1) use of the CO absorption band-head at 2.29 microns to measure directly; and (2) high resolution imaging of the NLS1 host galaxies to measure surface brightness distribution of bulges. One can then use the fundamental plane relation to determine . Alternatively, we will determine the bulge luminosities and find the locus of NLS1s on the -LBulge relation. Once again, the objective is to find out if there exists a statistical difference in the ratio of black hole mass to bulge luminosity for the two populations of BLS1s and NLS1s. We plan to use all these methods to fully understand the role of accretion in black hole growth, and to determine the locus of highly accreting AGNs on the –bulge relations.
References
- [Bian & Zhao 2003] Bian, W., & Zhao, Y., 2003, MNRAS in press, astro-ph/0309701
- [Blandford & Begelman 1999] Blandford, R. & Begelman, M. 1999, MNRAS, 303, L1
- [Boroson 2003] Boroson, T.A., 2003, ApJ 585, 647
- [Ferrarese & Merritt 2000] Ferrarese, L., & Merritt, D., 2000, ApJ, 539, L9
- [Ferrarese et al. 2001] Ferrarese, L., Pogge, R.W., Peterson, B.M., et al. 2001, ApJ, 555, L55
- [Gebhardt et al. 2000a] Gebhardt, K., Bender, R., Bower, G., Dressler, A., Faber, S.M., et al., 2000, A&A, 539, L13
- [Gebhardt et al. 2000b] Gebhardt, K., Kormendy, J., Ho, L.C., Bender, R., Bower, G., et al., 2000, ApJ, 543, L5
- [Grupe & Mathur 2004] Grupe, D., & Mathur, S. 2004, ApJL, in press.
- [Haenhnelt 2003] Haehnelt, M., 2003, Classical and Quantum Gravity, 20, S31
- [Haehnelt et al. 1998] Haehnelt, M.G., Natarajan, P., & Rees, M.J., 1998, MNRAS, 300, 817
- [King 2003] King, A., 2003, ApJL, 596, L27
- [Leighly 1999] Leighly, K.M., 1999, ApJS, 125, 317
- [Mathur 2000] Mathur, S., 2000, MNRAS, 314, L17
- [Mathur et al. 2001] Mathur, S., Kuraszkiewicz, J., & Czerny, B., 2001, New Astronomy, Vol. 6, p321
- [Merritt & Ferrarese 2001] Merritt, D., & Ferrarese, L., 2001, ApJ, 547, 140
- [Miralda-Escudé & Kollmeier 2003] Miralda-Escudé, J. & Kollmeier, J.A., 2004, ApJ, in press.
- [Morales & Fabian 2002] Morales, R. & Fabian, A. 2002 MNRAS 329, 209
- [Rodriguez-Ardila et al. 2002] Rodriguez-Ardila, A., Viegas, S.M., Pastoriza, M.G., & Prato, L., 2002, ApJ, 565, 140
- [Tremaine et al. 2003] Tremaine, S., Gebhardt, K., Bender, R., et al., 2003, ApJ, 574, 740
- [Williams, Mathur & Pogge 2004] Williams, R., Mathur, S. & Pogge, R., 2004, ApJL, in press.