The cosmic evolution of low-luminosity radio sources from the SDSS DR1
Abstract
In this paper we constrain the evolution in the comoving space density for low-luminosity (typically FRI) radio sources as a function of cosmic epoch by matching deep radio surveys (WENSS, FIRST and NVSS) with the Sloan Digital Sky Survey (SDSS). This results in 1014 matched radio sources covering an effective area of 0.217 sr, 686 with W Hz-1 sr-1, which is an order of magnitude larger than any previous study at these luminosities. Using the non-parametric test we show that low-luminosity radio sources evolve differently to their more powerful, predominantly FRII, counterparts. Indeed, we find that the lower luminosity population is consistent with a constant comoving space density with redshift, as opposed to the strong positive evolution for the more powerful sources.
keywords:
galaxies: active - galaxies: luminosity function - radio: galaxies1 Introduction
The evolution of radio-loud active galactic nuclei (AGN) has been a difficult quantity to pin down for all but the most powerful sources up to moderate redshifts. These sources appear to trace the most massive galaxies at all cosmic epochs (e.g. Jarvis et al., 2001; Willott et al., 2003) and so understanding their evolution is of strategic importance to astronomy. Further, radio sources make particularly useful probes of galaxy and AGN evolution because radio emission is not affected by dust obscuration. The evolution in the space density of the radio source population is therefore a crucial element in our understanding of the AGN phenomena.
It has been suggested that the radio AGN population is composed of different types of objects. The more powerful sources show a high surface brightness at the ends of a double lobed structure (Fanaroff-Riley type II; hereafter FRII; Fanaroff & Riley 1974) whereas the less powerful sources have high surface brightness nearest their centres (FRI). It is now well established that the FRII radio sources evolve strongly between (Longair 1966; Dunlop & Peacock 1990) with a decrease in the comoving space density of since . However, very little is known about the lower-luminosity FRI radio sources. Various groups have tried to understand how the lower-luminosity radio sources evolve with redshift. The conclusions drawn from these studies vary. For instance, Jackson & Wall (1999) find evidence for possible negative evolution. Laing, Riley & Longair (1983) find, from 17 sources in the complete 3CRR sample, evidence for no-evolution. Similarly, a study by Waddington et al. (2001) of 72 sources also suggests little evidence of evolution in the space density between z = 0 and z = 1 in the low-luminosity regime. However, Snellen & Best (2001) find, from two objects in the Hubble Deep Field and the flanking fields, evidence for positive evolution. This fundamental discrepancy arises because of the observational difficulty in establishing a large complete flux-density-limited radio sample at faint fluxes due to the vast overall increase in radio source counts.
The problem of small number statistics can now be overcome with large multiwavelength surveys. The advent of the large radio surveys such as the 325 MHz Westerbork Northern Sky Survey (WENSS); the Faint Images of the Radio Sky at Twenty-cm (FIRST) and the 1.4 GHz NRAO VLA Sky Survey (NVSS) along with large scale optical surveys such as the Sloan Digital Sky Survey Data Release 1 (SDSS DR1) allow us to probe the low-luminosity radio source population in a statistically complete manner. These surveys, when combined, provide the most efficient method of investigating the evolution of the faint radio source population as a function of cosmic epoch. The limiting factors are the flux-density limits of the radio surveys and the depth of the optical data. The WENSS and FIRST surveys can probe a radio source with W Hz-1 sr-1 (roughly at the FRI/FRII break luminosity) at a flux limit of mJy up to . The most limiting constraint comes from an upper limit in the optical flux from the SDSS (we adopt ).
In this paper we investigate the evolution in the comoving space density of low-luminosity radio sources with cross-matched catalogues formed from the WENSS, FIRST and NVSS radio surveys and the recently released photometric survey SDSS DR1. In §2 we describe the selection of the radio sources and their matching to the SDSS DR1. §3 contains details of the calculation of the photometric redshifts. In §4 the evolution in the comoving space density of radio sources is tested via the statistic. In §5 we present the results and §6 is a summary of our conclusions.
We define radio spectral index as , where is the flux-density at frequency . We assume throughout that and a , cosmology.
2 Sample Selection
We select a sample area that is sufficiently large to increase the number of low-luminosity, predominantly FRI, radio sources from tens to about 1000. We choose the continuous area of the northern SDSS DR1 sample which is bounded by FIRST at a declination of 64∘ and WENSS at 38∘. The shaded are in Fig. 1 shows the resulting area of our survey, covering 713 square degrees (0.217 sr).
2.1 Radio source selection
We wish to select radio galaxies where the optical light is dominated by the host galaxy, rather than quasars, and the radio emission may undergo Doppler beaming effects along the line-of-sight (e.g. Jarvis & Rawlings 2000). Therefore, we start with the low-frequency WENSS radio survey that will preferentially select optically thin steep spectrum lobe emission rather than optically thick flat spectrum (possibly beamed) emission.
The WENSS radio sources are matched to NVSS and FIRST radio surveys, bounded by the SDSS DR1 photometric survey. We summarise each of these surveys only briefly here - details can be found at each of their respective websites and references therein.
The WENSS survey (Rengelink et al. 1997; http://www.strw.leidenuniv.nl/wenss/) covers 3.14 sr north of +30∘ declination at 325 MHz with resolution of 54” and a flux-density completeness limit of approximately 18 mJy (5). We choose a conservative flux-density limit of 40 mJy which provides the limit for this survey. The NVSS radio survey (Condon et al. 1998; http://www.cv.nrao.edu/nvss/) is a 1.4 GHz continuum survey covering 10.3 sr of sky north of -40∘ declination. The completeness limit is about 2.5 mJy and the images have a 45” resolution and a nearly uniform sensitivity. The FIRST survey (Becker, White & Helfand 1995; White et al. 1997; http://sundog.stsci.edu) is at 1.4 GHz and covers 2.75 sr at -10 declination with resolution of 5” and a 1 mJy source detection threshold.

2.2 Radio source matching
We cross-match the WENSS and NVSS catalogue positions taking all matches with positional offsets of 40” as candidate radio detections. (We use the low-resolution NVSS survey over FIRST to determine 1.4 GHz flux-densities as some of the flux may be resolved out by the higher-resolution FIRST survey.) Increasing the distance to 45” increases the number of matched targets by only 1%. At this distance the probability of choosing a NVSS source within an arbitrary position is 2% whereas for the WENSS catalogue this is 0.8%, so we expect the contamination to be at the level of and the 40” offset is considered optimal.
We calculate the radio spectral index, , for each source using the flux-density at frequencies 325 MHz and 1.4 GHz from the matched radio sources in the low-resolution WENSS and NVSS surveys respectively. In order to select against quasars and other non-lobe dominated sources we choose 0.5.
The NVSS coordinates of this cross-matched sample are further matched to the high resolution radio galaxy catalogue, FIRST. Again we choose a positional offset of 40”. We do this for two reasons: (i) the increased resolution of FIRST allow us to improve the positional accuracy of the matched WENSS-NVSS catalogue, thus reducing the number of mis-identified sources with the photometric survey and (ii) the FIRST survey image cutouts allow an accurate visual check on the matching procedure to the SDSS DR1. The matched WENSS-NVSS-FIRST yield a total of 7898 matched radio targets in the sample area to be then matched to the photometric survey.
2.3 Photometric matching
We cross-match the SDSS DR1 catalogue with the FIRST matched positions, with positional offsets of 5”. We use the SDSS modified Petrosian magnitudes (Petrosian, 1976; Strauss et al., 2002). In this magnitude system the aperture size depends on the shape of the galaxy’s radial surface brightness profile but not its amplitude. The disadvantage of this system is that the photometric measurements become increasingly noisy for fainter than around 20. The other option is to use SDSS model magnitudes which are less noisy for the faint galaxies but have serious systematics for galaxies 20. The SDSS DR1 quote point spread function magnitude limits (95% detection repeatability for point sources) of 22.0, 22.2, 22.2, 21.3, 20.5 in respectively with the errors in the magnitudes 3%. For Petrosian magnitudes the reported errors are considerably larger than this. To ensure our sample is complete, and to minimise the photometric errors, we take a colour cut of 21. This effectively limits our analysis to z 1, assuming the host galaxies are typically (McLure et al. 2004) - which makes it the most limiting factor in the survey. Additionally, we use the SDSS morphological classification and select only non-stellar sources thus selecting against quasars.

We overplot the optical matches from SDSS DR1 onto the radio images from FIRST. In most cases the radio source is unambiguous. However, careful visual inspection of the images reveals that 8% of the sources with optical identifications within 1’ are not easily associated with a core of a radio galaxy. The majority of these cases are due to multiple identifications along the radio axis, which presumably arises from the well known alignment effect of the optical and radio emission (e.g. Eales et. al. 1997; Best, Röttgering & Longair, 2000; Inskip et al. 2002). As the narrow-line luminosity is correlated with radio luminosity (e.g. Willott et al. 1999) then this effect will be most prominent in the more powerful FRII subset. Thus we are confident that the survey as a whole is 90% complete, and the low-luminosity sources - which are our main concern in this paper - have a higher completeness. These selections result in 1014 radio sources with associated photometric data.
We incrementally alter the search radius of the optically matched FIRST and SDSS DR1 radio sources from 5 arcsec to 2 arcsec in order to investigate the effect on the contamination of mis-identified sources and the completeness of the sample. Ivezić et al. (2002) discuss this problem in detail. These authors find that with a 1 arcsec search radius the sample is 72% complete and 1.5% contaminated. Increasing the search radius to 3 arcsec results in 99% completeness and 9% contamination. We expect the contamination in our survey to be significantly less than that found by Ivezić et al. as the matching of each radio source is visually inspected by overplotting the SDSS DR1 photometric data on maps of the FIRST radio sources, whereas the Ivezić et al. study was automated.
3 Photometric redshifts
Redshift information is crucial in determining the evolution in the comoving space density of radio sources. Gaining spectroscopic redshift information for all of the radio sources in our sample would be extremely time consuming on any telescope. However, the five-band photometry from the SDSS DR1 allows us to use photometric redshifts to make reasonably accurate estimates of the whole sample. We use two publicly available codes to do this. The first is Hyperz (Bolzonella, Miralles & Pell, 2000), which uses galaxy templates and various degrees of reddening to determine the most likely redshift. We assume a priori that the host galaxies of our radio sources are either elliptical galaxies or bulge dominated spirals (e.g. McLure et al. 2004), and as such only use the corresponding template spectra.
The second code (ANN; Collister & Lahav 2004) estimates photometric redshifts by employing neural networks which require a large training set of galaxies for which the redshifts are already known. Collister & Lahav demonstrate the effectiveness of their method using SDSS DR1 and compare it to the Hyperz technique. They find that when a large training set is available the ANN technique is more robust than Hyperz method with smaller random and systematic errors.
We use the large sample of galaxies with spectroscopic redshifts and five-band photometry from the SDSS DR1, which comprises galaxies. In Fig. 2 we show the accuracy of the ANN technique for targets in our sample with spectroscopic measurements. The random error on the photometric redshifts is typically at . Inspection of Fig. 2 reveals a slight systematic error. We discuss the effect of this systematic underestimate of the photometric redshifts in §4.
Beyond the errors in the ANN analysis become larger, predominantly due to the fact that the majority of the galaxies observed in the spectroscopic training sample have . The relative dearth of high-redshift sources in the spectroscopic training set fainter than this limit means that ANNz is not the ideal photometric redshift code for this region of parameter space. Therefore we use Hyperz estimates for sources with .
4 The V/Vmax statistic
In order to assess the evolution in the comoving space density of radio sources we use the non-parametric method (Schmidt 1968; Rowan-Robinson 1968). This technique is useful as we do not have to make any a priori assumptions as to the form of any evolution. It also allows us to easily incorporate additional selection criteria. Indeed this is critical for this study as we have an optical magnitude limit of mag.
Under the null hypothesis of a uniform distribution, the value of will be uniformly distributed between 0 and 1. For such a sample the mean value is , where is the number of objects in the sample. A value of indicates that the sources are biased towards larger distances, or an increasing space density with redshift; whereas indicates a deficit of high-redshift sources, or a decline in the space density evolution. The total fraction of sources for which Vmax is set by the optical selection criteria is 35%. This is split into 13% of the low-luminosity sources and 83% of the high-luminosity sources.
| () | |||||
|---|---|---|---|---|---|
| 23-23.5 | 55 | 0.43 | 0.04 | 0.11 | 0.42 |
| 23.5-24 | 125 | 0.42 | 0.03 | 0.18 | 0.43 |
| 24-24.5 | 241 | 0.52 | 0.02 | 0.31 | 0.52 |
| 24.5-25 | 265 | 0.45 | 0.02 | 0.45 | 0.46 |
| 25-25.5 | 192 | 0.54 | 0.02 | 0.66 | 0.53 |
| 25.5-26 | 86 | 0.62 | 0.03 | 0.79 | 0.63 |
| 26-26.5 | 31 | 0.70 | 0.05 | 0.96 | 0.72 |
| 26.5-27 | 13 | 0.62 | 0.08 | 0.91 | 0.64 |
To incorporate the additional optical selection into the statistic we need to know the redshift at which the galaxy fades to mag. This is found by fitting the multi-colour data with various galaxy templates generated from the GISSEL96 synthetic galaxy spectra library of Bruzual & Charlot (2003). We use ten different templates of an evolving elliptical galaxy, with the redshift given by the photometric redshift techniques described in § 3. The spectral fit to the data is minimised with a simple fitting routine and subsequently inspected by eye (this also acted as a further consistency check of the photometric redshifts). We find 95% of the sources are well fitted by at least one of the galaxy templates. The templates are then used to determine the redshift at which the source would drop out of the sample as a consequence of both cosmological dimming and -correction, and this is used as the if it is found to be lower than the determined from the radio data alone.
We conduct the test with and without those sources with poor fits to the multi-colour data. The inclusion of the sources with poorer fits leads to a decrease in the estimate by at W Hz-1 sr-1, and at higher luminosities, thus we do not deem it to be an important uncertainty in our analysis. As well as the statistical errors, due to the size of the sample which decrease as , we investigate three other sources of error. First, the redshift estimate for each radio source has an associated uncertainty which is principally dependant on the magnitude errors and hence is a function of redshift. We use Monte-Carlo methods to assess the size of this source of error. We derive 1000 samples drawn from the true sample based on Gaussian deviations of the reported redshift error. Second, we re-derive the statistic for the sample after correcting for the systematic photometric underestimate seen in Fig. 2. Finally - as we discuss in §2 - we investigate the effect of contamination of mis-identified sources on the statistic by altering the search radius of FIRST-SDSS DR1 matched sources. We re-derive the statistic for search radii of 2, 3 and 4 arcsec separations.
5 Results
In Fig. 3 and Table 1 we show the mean statistic in 8 bins of radio luminosity in the range W Hz-1 sr-1. For each bin we provide the mean redshift . The 1 error bars are the statistical errors derived from the sample size. As we discussed above the statistic is affected by the errors in the estimates of the redshift. Overplotted in Fig. 3 are the results of the Monte Carlo simulations at 68%, 95% and 99% confidence (dark to light shading respectively) based on Gaussian deviations about the reported redshift. We also re-derive the statistic for the sample after correcting for the systematic underestimate seen in Fig. 2. These adjusted estimates are provided in the last column of Table 1 and are shown as open triangles in Fig. 3.
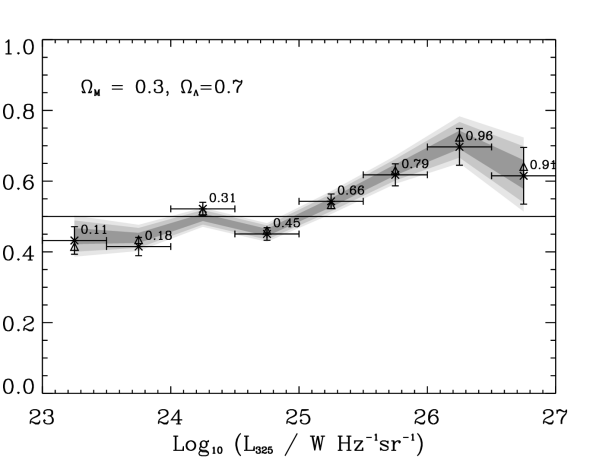
The 5% of objects that cannot be satisfactorily fit with the galaxy templates change the estimate by 0.02 at most. An inspection of the confidence limits in Fig. 3 suggests that the errors that arise from the uncertainty in the redshift are less significant than the statistical errors. Further, the systematic photometric error leads to a change in of . We note the latter two sources of error have the combined effect of moving the statistic towards = 0.5 for the W Hz-1 sr-1 sample and away from it for the higher luminosity sample.
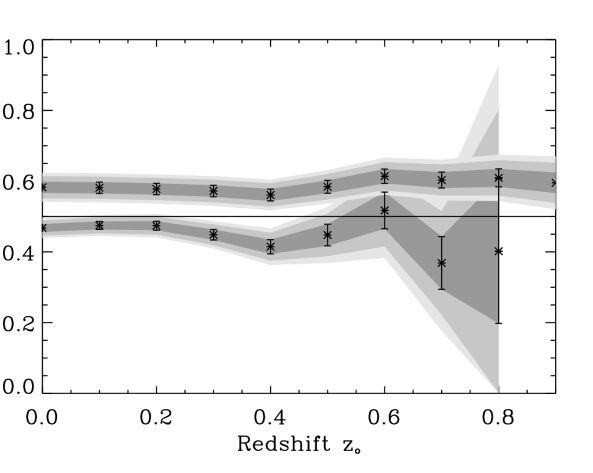
The only evidence () for a strong positive evolution comes from the powerful radio sources with W Hz-1 sr-1. It has long since been established that these powerful, predominantly FRII sources, exhibit positive evolution (i.e. 0.5). However, the lower-luminosity population does not follow this trend. In contrast to the strong evolution indicated by the FRII sources, the lower luminosity sample shows little evidence for evolution up to . This dichotomy is illustrated further in Fig. 4 and Table 2, where we show the banded statistic, which enables us to see the evolution in the statistic as a function of redshift (see Avni & Bahcall 1980) for two bins in radio luminosity [ W Hz-1 sr-1 (upper) and W Hz-1 sr-1 (lower)]. This result remains unchanged if we alter the search radius of the optically matched FIRST and SDSS DR1 radio sources.
Table 3 shows the same banded statistic in the W Hz-1 sr-1 bin as in Table 2 but for search radii of 4, 3 and 2 arcsec. The banded statistic remains consistent in each of the separations but the relative levels of completeness fall to 80%, 68% and 57% for 4, 3 and 2 arcsec separations respectively. However, due to the consistency in the completeness seems to be uniform in all bins.
The evidence for the lack evolution in the low-luminosity sources is broadly consistent with a radio survey by Waddington et al. (2001) which uses 72 sources, 42 of which have accurate spectroscopic redshifts. Examination of their Fig. 10 suggests no significant evolution of sources at which is consistent with our lowest luminosity bin of W Hz-1 sr-1 shown in Fig. 3.
Jackson & Wall (1999) found that for 26 sources at the lower luminosity, = 0.3140.057. If we calculate the mean statistic for our low-luminosity and high-luminosity sources over all redshifts we find that the sample with W Hz-1 sr-1 yields = 0.470.01 for 686 sources. The sample W Hz-1 sr-1 has a = 0.58 0.02. This is obviously calculated over a large range in redshift which may not be informative regarding the evolution. Indeed two samples with different do not necessarily have different evolutions (Anvi & Bahcall 1980). However it does indicate that the low-luminosity sources are consistent with little or no evolution and that the Jackson & Wall (1999) values are ruled out at . A direct comparison between such studies and the one presented here is made difficult because of the small sample size so that the samples may be drawn from completely different distributions.
We also note that our results are consistent with Snellen & Best (2001) as their two sources are at W Hz-1 sr-1 and as such are at the cross-over point between the lower and higher luminosity sources in our analysis.
| () | () | |||
|---|---|---|---|---|
| 0.0 | 0.47 | 0.01 | 0.58 | 0.02 |
| 0.1 | 0.47 | 0.01 | 0.58 | 0.02 |
| 0.2 | 0.47 | 0.01 | 0.58 | 0.02 |
| 0.3 | 0.45 | 0.01 | 0.57 | 0.02 |
| 0.4 | 0.41 | 0.02 | 0.56 | 0.02 |
| 0.5 | 0.45 | 0.03 | 0.58 | 0.02 |
| 0.6 | 0.52 | 0.05 | 0.61 | 0.02 |
| 0.7 | 0.37 | 0.07 | 0.60 | 0.02 |
| 0.8 | 0.40 | 0.20 | 0.61 | 0.03 |
| 0.9 | - | - | 0.60 | 0.03 |
6 Summary and discussion
We have conducted the first large scale analysis of the evolution in the comoving space density of radio sources at the faint end of the radio luminosity function. We match steep spectrum sources from the WENSS, NVSS and FIRST radio catalogues to the SDSS DR1 photometric catalogue which results in 1014 sources with redshift information accurate to at . Of these sources 686 sources have W Hz-1 sr-1 and 328 have W Hz-1 sr-1. For the powerful sources, assumed to be predominantly FRII radio sources, we are in good agreement with previous work based on spectroscopically complete radio samples (e.g. Dunlop & Peacock 1990; Willott et al. 2001). However, for the lower luminosity population, we find that the comoving space density remains approximately constant with increasing redshift, and thus these objects do not follow the trend of their more powerful counterparts.
This is in rough agreement with what one would expect by combining the information from both the radio luminosity function derived from a brighter, complete flux-density limited sample (e.g. Willott et al. 2003) and the low-frequency source counts. We rule out a strong negative evolution, as suggested by Jackson & Wall (1999) at . We also find no evidence for a significant increase in the comoving space density of the sources with W Hz-1 sr-1. However, it is difficult to assess the significance of any possible dichotomy in the evolution of the low-luminosity and the high-luminosity sources with our sample alone, as we probe completely different ranges in redshift, due to redshift – luminosity degeneracy inherent to flux-density limited samples. In comparison to the combined 3CRR, 6CE and 7CRS samples of Willott et al. (2001) which covers a combined area of sr with virtually complete redshift information, and has many powerful radio sources at , our analysis shows that the lower-luminosity population is unlikely to have evolved in such a dramatic way. Whether this is due to the evolution in comoving space density correlating with radio luminosity or with FRI/FRII morphology is impossible to determine with the resolution of the FIRST survey used in this analysis. Access to further high-resolution radio data would fully resolve this issue.
| 4” | 1 | 3” | 1 | 2” | 1 | |
|---|---|---|---|---|---|---|
| 0.0 | 0.47 | 0.01 | 0.47 | 0.01 | 0.48 | 0.01 |
| 0.1 | 0.48 | 0.01 | 0.48 | 0.01 | 0.49 | 0.02 |
| 0.2 | 0.48 | 0.01 | 0.48 | 0.02 | 0.48 | 0.02 |
| 0.3 | 0.45 | 0.02 | 0.45 | 0.02 | 0.45 | 0.02 |
| 0.4 | 0.42 | 0.02 | 0.41 | 0.02 | 0.40 | 0.03 |
| 0.5 | 0.45 | 0.03 | 0.41 | 0.04 | 0.42 | 0.04 |
| 0.6 | 0.52 | 0.06 | 0.45 | 0.06 | 0.42 | 0.07 |
| 0.7 | 0.35 | 0.09 | 0.25 | 0.10 | 0.23 | 0.13 |
| 0.8 | 0.74 | 0.29 | - | - | - | - |
Acknowledgements
LC and MJJ are funded by PPARC PDRAs. The authors would like to thank the referee, Jim Dunlop, for a careful reading of the manuscript and helpful comments. We thank Steve Rawlings and Garret Cotter for useful discussions and Adrian Collister for providing the source code of ANN. This publication makes use of the material provided in the WENSS, FIRST, NVSS and SDSS DR1 surveys. The WENSS project is a collaboration between the Netherlands Foundation for Research in Astronomy and the Leiden Observatory. NVSS and FIRST are funded by the National Astronomy Observatory (NRAO) and is a research facility of the U.S. National Science foundation and use the NRAO Very Large Array. Funding for the creation and distribution of the SDSS Archive has been provided by the Alfred P. Sloan Foundation, the Participating Institutions, the National Aeronautics and Space Administration, the National Science Foundation, the U.S. Department of Energy, the Japanese Monbukagakusho, and the Max Planck Society. Further details of the SDSS survey can be found on http://www.sdss.org/.
References
- (1) Avni Y., Bahcall J. N, 1980, ApJ, 235, 694
- (2) Becker, R.H., White, R.L., & Helfand, D.J. 1995, ApJ, 450, 559
- (3) Best P. N., Röttgering H. J. A., Longair, M. S., 2000, MNRAS, 311, 23
- (4) Bolzonella, J.M. Miralles, R. Pell, 2000, A&A, 363, 476
- (5) Bruzual A.G., Charlot S., 2003, ApJ, 344, 1000
- (6) Collister A.A., Lahav O., 2004, astro-ph/0311058
- (7) Condon J.J., Cotton W.D., Greisen E.W., Yin Q.F., Perley R.A., Taylor G.B., Broderick J.J., 1998, AJ, 115, 1693
- (8) Dunlop J.S., Peacock J.A., 1990, MNRAS, 247, 19
- (9) Eales S., Rawlings S., Law-Green D., Cotter G., Lacy M., 1997, MNRAS, 291, 593
- (10) Fanaroff B.L., Riley J.M., 1974, MNRAS, 167, 31
- (11) Jackson C.A., Wall J.V., 1999, MNRAS, 304, 160
- (12) Inskip K.J., Best P.N., Rawlings S., Longair M.S., Cotter G., Röttgering H.J.A., Eales S., 2002, MNRAS, 337, 1381
- (13) Ivezić Z. et al., 2002, AJ, 124, 2364
- (14) Jarvis M.J., Rawlings S., 2000, MNRAS, 319, 121
- (15) Jarvis M.J., Rawlings S., Eales S.A., Blundell K.M., Bunker A.J., Croft S., McLure R.J., Willott C.J., 2001, MNRAS, 326, 1585
- (16) Laing R.A., Riley J.M., Longair M.S., 1983, MNRAS, 204,151
- (17) Longair M.S., 1966, MNRAS, 133, 421
- (18) McLure R. J., Willott C.J., Jarvis M.J., Rawlings S., Hill G.J., Mitchell E., Dunlop J.S., Wold M., 2004, MNRAS, submitted.
- (19) Petrosian V., 1976, ApJ, 209, L1
- (20) Rengelink, R.B., et al., 1997, AAPS, 124, 259
- (21) Rowan-Robinson M.M., 1968, MNRAS, 138, 445
- (22) Schmidt M., 1968, ApJ, 151, 393
- (23) Snellen I.A.G., Best P.N., 2001, MNRAS, 328, 897
- (24) Strauss M.A. et al., 2002, AJ, 124, 1810
- (25) Waddington I., Dunlop J.S., Peacock J.A., Windhorst R.A., 2001, MNRAS, 328, 882
- (26) White, R.L., Becker, R.H., Helfand, D.J., & Gregg, M.D. 1997, ApJ, 475, 479
- (27) Willott C.J., Rawlings S., Blundell K.M., Lacy M., 1999, MNRAS, 309, 1017
- (28) Willott C.J., Rawlings S., Blundell K.M., Lacy M., Eales S.A., 2001, MNRAS, 322, 536
- (29) Willott C.J., Rawlings S., Jarvis M.J., Blundell K.M., 2003, MNRAS, 339, 173