Strong lensing by cluster-sized haloes in dark-energy cosmologies
We study the efficiency of numerically simulated galaxy clusters for producing strong gravitational lensing events in different dark-energy cosmologies with constant and time-variable equation of state and we compare it with “standard” CDM and OCDM models. Our main results are that: (1) the expected abundance of gravitational arcs with large length-to-width ratio depends on the equation of state of dark energy at the epoch of formation of the halo; (2) as found in previous studies, the strong lensing cross section of galaxy clusters is very sensitive to dynamical processes like mergers, whose impact however is different for different cosmologies, being stronger for models in which halos are less concentrated. As expected, the largest differences in the lensing optical depth occur at moderate and high redshift.
1 Introduction
Evidence is mounting that the Universe is spatially flat, has low matter density and is dominated by some form of dark energy, acting as a repulsive gravitational force and responsible for the present phase of accelerated cosmic expansion. (e.g. Riess et al., 1998; Perlmutter et al., 1999; Hawkins et al., 2003; Spergel et al., 2003; Tegmark et al., 2004; Riess et al., 2004). The dark energy generalises the concept of cosmological constant, admitting dynamics and fluctuations. Such a generalisation is necessary attempting to reconcile its value with the known energy scales of particle physics. The minimal extension of a cosmological constant is a self-interacting scalar field (Quintessence, see Peebles & Ratra, 2002, and references therein), already considered before the evidence for cosmic acceleration (Wetterich, 1988; Ratra & Peebles, 1988).
Structure grows earlier in dark-energy than in cosmological-constant models, which makes dark-matter haloes more concentrated (Bartelmann et al., 2002; Weinberg & Kamionkowski, 2003; Dolag et al., 2004). Following earlier analytic work (Bartelmann et al., 2003), we study here with cluster models numerically simulated in eight different cosmologies how earlier structure growth and denser halo cores affect strong lensing by galaxy clusters. Our motivation is three-fold. First, despite recent attempts (Wambsganss et al., 2004; Dalal et al., 2003), it remains to be clarified whether the strong-lensing efficiency of real clusters is reproduced by numerical cluster models or not. Earlier studies found that the expected strong-lensing efficiency of clusters in cosmological-constant models appears to fall short by an order of magnitude of reproducing the observed number of arcs (Bartelmann et al., 1998). We thus wish to quantify the effect on strong lensing of the increased halo core density in dark-energy models. Second, earlier structure growth may have interesting implications for strong cluster lensing in view of the recently-detected clusters at redshifts near unity in which strongly-lensed arcs were found (Hasinger et al., 1998; Gladders et al., 2003; Zaritsky & Gonzalez, 2003; Lidman et al., 2004). Third, we found in a recent study with high time resolution (Torri et al., 2004) that the efficiency of a cluster for strong lensing can substantially be increased during merger processes because of the enhanced tidal field and surface-mass density during different phases of the merger process. Shifting structure growth to earlier redshifts also allows major mergers at higher redshifts and thus potentially much increased arc-formation probabilities.
With these motivations in mind, we use the 17 cluster-sized haloes produced for and described in Dolag et al. (2004) and investigate their strong-lensing properties. Section 2 describes the eight cosmological models used, Sect. 3 the cluster sample, and Sect. 4 the lensing simulations. Results are presented in Sect. 5 and summarised in Sect. 6.
2 Cosmological models
We compare in this paper the efficiency for producing strong lensing events of the sample of numerically simulated clusters previously described in Dolag et al. (2004). We give here a short description of both the cosmological models and the methods used for obtaining the cluster sample and refer the reader to that paper for further details.
All clusters in the sample were simulated in different cosmologies with constant and time-variable equation of state. These are an open Cold Dark Matter (OCDM) and four spatially flat cosmological models, namely a cosmological-constant (CDM) model, a dark energy model with constant equation of state (DECDM), and two quintessence models with markedly different dynamical properties, one with inverse power-law Ratra-Peebles potential (RP, see Peebles & Ratra, 2002, and references therein) and one with SUGRA potential (SUGRA, see Brax & Martin, 2000, and references therein). For the latter three we have used two different normalisations of the perturbation power spectrum, to be discussed later.
In all cases, the matter density parameter today is . In the flat cosmologies, the remaining of the critical density is assigned to the dark energy at present (. The remaining cosmological parameters are , , Gaussian density fluctuations with scale-invariant power spectrum, and no gravitational waves.
The normalisation of the perturbation power spectrum, which we set conventionally through the rms density fluctuation level within spheres of radius, has been chosen as for all the cosmological models in order to match the observed abundance of galaxy clusters. Since the power spectrum normalisation is most important here, affecting the structure statistics and therefore the lensing power, we also normalise the DECDM, RP and SUGRA models to the observed level of anisotropies in the Cosmic Microwave Background (CMB) (e.g. Bennett et al., 2003). In this case, the is generally slightly smaller because of the Integrated Sachs Wolfe (ISW) effect affecting the large scale CMB anisotropies: the reason is the larger time interval in which the cosmic equation of state changes in dark energy scenarios with respect to the cosmological constant case. This enhances the dynamics of the gravitational potentials and raises the ISW power, visible on the large angle tail of CMB anisotropy power spectrum (see Bartelmann et al., 2002, and references therein). We take , and for DECDM, RP and SUGRA, respectively. Note that the reduction is quite important, since we selected our dark energy models in order to highlight the differences among each other and the cosmological constant. If the equation of state is smaller than the cases we consider here, the ISW effect and the reduction to the power spectrum normalisation are smaller. These numbers as well as all the inputs from the linear evolution of cosmological perturbations to the N-body procedure described later are computed using our dark energy oriented cosmological code, based on CMBfast (Seljak & Zaldarriaga, 1996). The code, originally introduced by Perrotta & Baccigalupi (1999), describes the dark energy as a scalar field, numerically integrating its background and linear perturbation dynamics for the most relevant tracking quintessence scenarios, capable to converge to the present phase of cosmic acceleration from a wide range of initial conditions in the early universe (Baccigalupi et al., 2000). This is performed in the general framework of scalar-tensor cosmologies, in which the dark energy may be directly linked with gravity (Perrotta et al., 2000). The outputs of this machinery have been used for other work, allowing in particular to constrain the dark energy equation of state with the modern CMB anisotropy observations (Baccigalupi et al., 2002).
The dark energy cosmologies are characterised by their equation of state parameter , describing the ratio between pressure and density of the Dark Energy. For cosmic expansion to be accelerated today, the parameter must be . In the limit of constant , the dark energy density evolves with redshift proportionally to . That is the case for both the CDM model, whose yields a constant dark energy density, and the DECDM model, which we choose to have . It is useful to note that from the point of view of the Friedmann equation, the curvature term in the OCDM model behaves as a dark energy component with constant (see Bartelmann et al., 2002, and references therein).
For the RP and SUGRA models, is time-dependent. The dark energy is consistently described by means of the quintessence scalar field . The RP and SUGRA quintessence potentials are given by
| (1) |
respectively. The exponential in reflects super-gravity corrections (Brax & Martin, 2000) and induces large variations in the equation of state with respect to the RP case at the epoch of structure formation, even if is the same at present in the two models. Dolag et al. (2004) found indeed that the cluster concentration reflects the dark energy behaviour at the time of collapse, a promising feature in order to reduce the degeneracy between different dark energy models yielding the same amount of acceleration today. In this work we check how this feature affects the statistics of strongly lensed arcs in clusters. Specifically, the tracking RP and SUGRA quintessence models considered here have today, with and , respectively. In the tracking regime, this yields and .
3 Cluster sample
The cluster models used in this study were simulated using a new version of the cosmological code GADGET (Springel et al., 2001), specifically adapted to simulate the formation and evolution of cosmic structures in the dark energy models described earlier (see Dolag et al., 2004).
Each cluster in our sample was obtained using the so-called re-simulation technique, which consists in re-simulating at higher resolution a patch of a pre-existing large-scale cosmological simulation (Tormen et al., 1997). For this work, we selected as a parent simulation an N-body run with particles in a box of (Yoshida et al., 2001; Jenkins et al., 2001). Its background cosmological model is spatially flat with and at the final epoch, identified with redshift zero. The particle mass was , and the gravitational softening was chosen as . From the output of this simulation at , we selected ten spherical regions of radius between and , each containing either one or a pair of dark matter haloes with mass exceeding . We thus obtain a sample of 17 cluster-sized objects.
Each of these regions was re-sampled to build new initial conditions with on average dark-matter particles. The initial conditions from the CDM cosmology were adapted to all the dark energy cosmologies studied here as described in Dolag et al. (2004). The mass resolution of the re-simulation ranges from to per dark-matter particle so as to have each cluster consisting of approximately the same number of particles. The gravitational softening is reduced to a cubic spline smoothing for all particles in the high-resolution region.
We found that our 17 clusters contain on average dark matter particles within their virial radii. The corresponding virial masses range between to .
4 Lensing simulations
Ray-tracing simulations are then carried out with each of the 17 clusters in all eight cosmological models. The technique used in this study was described in detail in several earlier papers (e.g. Bartelmann et al. 1998; Meneghetti et al. 2000).
For all clusters in each cosmological model, we produce snapshots at different redshift between 0 and 1. These are equidistant in time, leading to a time resolution of Myr, which allows the effects of dynamical processes on the cluster cross sections for strong lensing to be resolved, as discussed in Torri et al. (2004).
For each snapshot, we select a cube of Mpc comoving side length, centred on the halo centre and containing the high-density region of the cluster. The particles in this cube are used for producing a three-dimensional density field, by interpolating their position on a grid of cells using the Triangular Shaped Cloud method (Hockney & Eastwood, 1988). Then, we project the three-dimensional density field along the coordinate axes, obtaining three surface density maps , used as lens planes in the following lensing simulations. The total number of lensing simulations is therefore , requiring approximately the same number of computation hours on an IBM-SP4 cluster located at the computer centre of the Max Planck Society in Garching.
The lensing simulations are performed by tracing a bundle of light rays through a regular grid, covering the central quarter of the lens plane. This choice is driven by the necessity of studying in detail the central region of the clusters, where critical curves form, taking into account the contribution from the surrounding mass distribution to the deflection angle of each ray.
Deflection angles on the ray grid are computed using the method described in Meneghetti et al. (2000). We first define a grid of “test” rays, for each of which the deflection angle is calculated by directly summing the contributions from all cells on the surface density map ,
| (2) |
where is the area of one pixel on the surface density map and and are the positions on the lens plane of the “test” ray () and of the surface density element (). Following Wambsganss et al. (1998), we avoid the divergence when the distance between a light ray and the density grid-point is zero by shifting the “test” ray grid by half-cells in both directions with respect to the grid on which the surface density is given. We then determine the deflection angle of each of the light rays by bi-cubic interpolation between the four nearest test rays.
The position of each ray on the source plane is calculated by applying the lens equation. If and are the angular positions of source and image from an arbitrarily defined optical axis passing through the observer and perpendicular to the lens and source planes, this is written as
| (3) |
where and are the angular diameter distances between the lens and the source plane, and between the observer and the source plane, respectively.
Then, a large number of sources is distributed on the source plane. We place this plane at redshift . Keeping all sources at the same redshift is an approximation justified for the purposes of the present case study, but the recent detections of arcs in high-redshift clusters (Zaritsky & Gonzalez, 2003; Gladders et al., 2003) indicate that more detailed simulations will have to account for a wide source redshift distribution.
The sources are elliptical with axis ratios randomly drawn from . Their equivalent diameter (the diameter of the circle enclosing the same area of the source) is . These are distributed on a region on the source plane corresponding to one quarter of the field of view where rays are traced. As in our earlier studies, we adopt an adaptive refinement technique when placing sources on their plane. We first start with a coarse distribution of sources and then increase the source number density towards the high-magnification regions of the source plane by adding sources on sub-grids whose resolution is increased towards the lens caustics. This increases the probability of producing long arcs and thus the numerical efficiency of the method. In order to compensate for this artificial source-density enhancement, we assign a statistical weight to each image for the following statistical analysis which is proportional to the area of the sub-grid cell on which the source was placed.
By collecting rays whose positions on the source plane lay within any single source, we reconstruct the images of background galaxies and measure their length and width. Our technique for image detection and classification was described in detail by Bartelmann & Weiss (1994) and adopted by Bartelmann et al. (1998), Meneghetti et al. (2000, 2001, 2003a, 2003b) and Torri et al. (2004). It results in a catalogue of simulated images which is subsequently analysed statistically.
5 Results
In this Section, we discuss how the lensing properties of the clusters in our sample differ in the different cosmological models.
5.1 Critical curves and caustics

We start by considering the critical curves, along which strongly magnified and highly distorted images form. These are the lines on the lens plane where the determinant of the Jacobian matrix of the lens mapping,
| (4) |
is zero. Since the local magnification is the inverse of the Jacobian determinant, the critical points are ideally characterised by infinite magnification.
Through the lens equation, critical lines are mapped onto the caustics on the source plane. Sources lying close to the caustics therefore have images strongly magnified in the radial or tangential directions, i.e. gravitational arcs. The probability of one cluster to produce highly distorted images is then related to the size and the shape of the critical curves and of the caustics.
In Fig.1 we show some examples of how the critical curves (and of the corresponding caustics) of one of the clusters in our sample change among different cosmological models. The halo has a virial mass ranging between and at redshift . Considering models characterised by the same normalisation of the power spectrum of the primordial density perturbations, it is clearly seen that the two models with dynamical dark energy, i.e. the RP and SUGRA models, and the DECDM model with constant equation of state , interpolate between the CDM and the OCDM model. In particular, the critical curves in the SUGRA model have sizes comparable to those in the DECDM model.
However, it is important to note that the size of the critical curves and of the caustics in dark energy models may be smaller when the CMB normalisation is used, because of the enhanced ISW effect with respect to the CDM case. The larger the required reduction of is, the more the critical curves shrink; in the case considered here, the critical curves tend to have sizes comparable to those in the CDM model or smaller.
5.2 Lensing cross sections
In earlier work, the length-to-width ratio of gravitational arcs was found to be very sensitive to many intrinsic properties of the lenses which depend on cosmology. In fact, numerical simulations showed that order-of-magnitude differences are expected in the number of arcs on the whole sky with length-to-width ratio exceeding a given threshold in different cosmological models (Bartelmann & Weiss, 1994; Bartelmann et al., 1995, 1998). In particular, ten times more arcs are expected in an OCDM than in a CDM model. Modelling clusters using the NFW density profile, which depends on cosmology in contrast to the singular isothermal profile, such a high sensitivity of the abundance of long and thin arcs on cosmology has been confirmed even using an analytic approach (Meneghetti et al., 2003b; Bartelmann et al., 2003).
Therefore, aiming at evaluating the differences between the strong-lensing efficiency of clusters in different cosmological models with dark energy, we focus on the statistical distributions of the arc length-to-width ratios.
The efficiency of one galaxy cluster for producing arcs with a given property can be quantified by means of its lensing cross section. By definition, this is the area on the source plane where a source must be placed in order to be imaged as an arc with that property. As explained in the previous sections, we artificially increase the density of background sources close to the cluster caustics by adopting adaptive grid refinement. Each source is taken to represent a fraction of the source plane. We assign to each source and all of its images a statistical weight which is inversely proportional to the squared resolution of the sub-grid on which the corresponding source was placed. The cells of the sub-grid with the highest resolution have area , and the sources placed on its grid points are given a statistical weight of unity. The absolute lensing cross sections are then determined by counting the statistical weights of the sources whose images have a length-to-width ratio exceeding a threshold . If a source has multiple images with , we multiply its statistical weight by the number of such images. Therefore, the lensing cross section is
| (5) |
where is unity if the -th source has images with and zero otherwise, is the number of images of the -th source satisfying the required condition, and is the statistical weight of the source.
5.2.1 Averaged cross sections
We now discuss the averaged cross sections of our cluster sample. In Fig. 2 we show the lensing cross sections for long and thin arcs, averaged over all 17 clusters, as function of the lens redshift for all eight cosmological models. For each cluster, we use its three projections along the coordinate axes for measuring the cross section. Therefore, the curves displayed in Fig. 2 result from averaging over 51 different curves in each cosmological model.


As expected, the lensing cross sections reflect the differences in the concentration of dark matter halos in different cosmological models. This has been fully discussed in our previous paper (Dolag et al., 2004). It is shown there that the cluster concentration depends on the dark energy equation of state at the cluster formation redshift through the linear growth factor . Assuming the same normalisation of the power spectrum, the lensing cross sections for the OCDM and the CDM models differ by roughly a factor of four, independent of the minimal length-to-width ratio of the arcs, and the cross sections for the other cosmological models with dark energy interpolate between them. Despite the equation of state of the dark energy today is the same for the RP and SUGRA models, their lensing cross sections differ substantially at higher redshift.
For models with the CMB normalisation of the power spectrum, we find lensing cross sections smaller by even more than one order of magnitude compared to the OCDM model. In fact, when the normalisation is reduced because of the Integrated Sachs Wolfe (ISW) effect affecting the large-scale CMB anisotropies in the cosmologies we consider (Bartelmann et al., 2003), not only the formation epoch of our simulated clusters is delayed, but also their evolution up to redshift zero is changed. For example, clusters in the RP and in the SUGRA models have masses at redshift zero which are smaller by roughly and respectively compared to the CDM model.
The cluster sample is still too small for the averaged cross section to be a smooth function of redshift. In fact, the curves exhibit strong peaks which are caused by merger events arising in single clusters. It has recently been shown that during such events, on timescales of some hundreds of Myr, the cluster efficiency for strong lensing is strongly enhanced (Torri et al., 2004), due to the combined effects of the increasing shear and convergence. We will discuss the properties of these peaks in the next subsection, when the lensing cross sections of one individual cluster will be shown.
5.2.2 Individual clusters


In Fig. 2, several peaks can be found in at least all the curves obtained in cosmological models with the same normalisation of the power spectrum. Indeed, in this case, we are comparing the same clusters in different cosmological models and therefore the same dynamical processes cause the cluster lensing efficiencies to peak. However the position and the amplitude of the peaks is strongly dependent on the cosmological model. This becomes clearer by looking at the lensing cross sections of one individual cluster.
In the left panel of Fig.3 we show the lensing cross section for arcs with length-to-width ratio larger than 7.5 of one of the most massive clusters in our sample (). Solid curves refer to models with . Since the cluster forms at different epochs in different cosmological models, the same merger events occur at different redshifts, and consequently the peaks are shifted in time. Initial conditions of our clusters are built such that single halos reach the same evolutionary state at redshift zero in all cosmological models. Therefore, the delay between dynamical processes in different cosmologies shrinks as the redshift decreases.
The offset between the merger histories is clear from the central and the right panel of Fig. 3. In the central panel, the redshift evolution of the redshift derivative of the halo mass within the virial region, defined as the region enclosing 200 times the mean background density, is shown. The mass grows towards redshift zero as the cluster accretes material from its surroundings. Sudden peaks in the curves indicate that large clumps of matter are entering into the virial region. As discussed in Torri et al. (2004), the typical time-scale for an infalling substructure to reach the peri-centre of its orbit is then Gyr, when the passage of the substructure produces a peak in the particle velocity dispersion, as shown in the right panel of Fig. 3. All the most pronounced peaks in the curves representing the lensing cross sections correspond to some peak in the velocity dispersion, which demonstrates our previous assertion about the relation between merger events and maxima in the cluster lensing efficiency.
By comparing the left and the right panels of Fig. 3, we note that we cannot find for all the peaks in the velocity dispersion a corresponding peak in the lensing cross sections. The reason is that peaks at high and low redshift are suppressed by the geometrical lensing efficiency. Indeed, the lensing cross sections drop when the lenses are too close to the observer or to the sources.
It is remarkable that even if the lens is intrinsically not very efficient for lensing, the passage of massive substructures close to the cluster centre can strongly enhance its ability to produce gravitational arcs. For example, in the CDM model the lensing cross section is larger by roughly one order of magnitude while a merger is occurring. Similar increments in the amplitude of the lensing cross section have been found by Torri et al. (2004). This suggests that lensing events are likely to be transient events, characterising peculiar epochs during cluster evolution.
When the CMB normalisation of the power spectrum is adopted, the comparison between the same clusters in different cosmological models is less straightforward. Indeed, changing strongly affects the merging history of the cluster, as shown by the dotted lines in Fig. 3.

We also note that in both the RP and the SUGRA models with CMB normalisation, even when the cluster appears to be dynamically perturbed, the lens still does not become particularly efficient for strong lensing. We verified that in these cases, the substructures producing the peaks in the velocity dispersion are orbiting at large distance from the cluster centre. Indeed, the merger events producing the peaks in the lensing cross sections in the cluster-normalised models are here delayed in time due to the reduced .
5.3 Optical depth
We can now estimate the probability for arc formation of a population of clusters. Given a mass function, , assuming that the typical lensing cross sections for lenses of mass are well represented by the lensing cross sections of our sample , the optical depth is defined as the sum of the lensing cross sections of each lens between the observer and the sources, divided by the area of the source plane. Following this definition,
| (6) |
where is the source redshift, is the cosmic volume, and the factor accounts for the fact that the cluster number density is defined per comoving volume. The former equation applies under the assumption that lensing cross sections do not overlap.
Since we do not know for a continuous range of masses, but only for a discrete cluster sample , we calculate the optical depth as follows:
where is the total number of clusters in our sample. This corresponds to attaching to each halo of mass in the interval a lensing cross section .
The integrand in Eq. 7 is shown in the left panel of Fig. 4 for different cosmologies. The differential optical depth for arcs with length-to-width ratio larger than and for sources at redshift is larger in those cosmological models where lenses form earlier and are thus more concentrated. Moreover, the contribution to the total optical depth comes from clusters in a wider redshift range in these cosmologies. For example, in the high redshift tail, the curves drop to zero at and in the CDM model and in the OCDM models, respectively. Moreover, at , the differential optical depth is still close to its maximum in the OCDM model, while it is decreased below in the CDM. Other cosmologies, like the RP, the DECDM and the SUGRA with cluster abundance normalisation, interpolate between these models, while we obtain substantially smaller optical depths by adopting the CMB normalisation of the power spectrum.
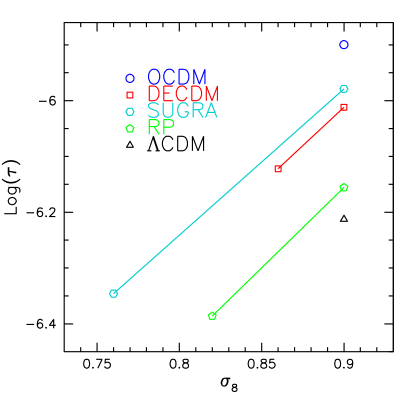
The total optical depth as a function of the normalisation of the power spectrum is shown in the right panel of Fig. 4. Again, we find that when cluster normalisation is used, dark energy models interpolate between CDM and OCDM. When the normalisation is reduced according to the amplitude of large-scale temperature fluctuations in the CMB, the optical depth also decreases as shown by the solid lines in the figure.
The total optical depth changes by a factor of two between the CDM and the OCDM models. This is in disagreement with the previous results of Bartelmann et al. (1998), where one order of magnitude larger optical depths were found in the OCDM compared to the CDM. However, we use here modified method for estimating the optical depth. Moreover, both the mass and in particular the time resolutions of our simulations are considerably larger than in the earlier paper. This allows us to better account for the contribution to the optical depth from all the merger events occurring in the lenses, all of which enhance the cluster efficiency for producing arcs, as shown in the previous sections. The impact of mergers appears to be different in different cosmological models, being larger in those cosmologies where lenses are less concentrated. As a consequence of that, the difference in the number of arcs which is expected to be observed in a CDM and in a OCDM cosmological models is reduced when mergers are accounted for. Indeed, resampling our cross sections for reproducing the same time resolution of Bartelmann et al. (1998), we obtain an optical depth larger by a factor of eight in the CDM compared to the OCDM model, in agreement with (Bartelmann et al., 1998).

This interpretation is also supported by the following simple experiment. We simulate the passage of a clump of matter of mass through the centre of an halo of mass . Both the main cluster clump and the merging substructure are modelled using the pseudo-elliptical Navarro-Frenk-White lens model discussed by Meneghetti et al. (2003b), assuming an ellipticity of the lensing-potential contours of . The lens and source redshifts are kept fixed at and , respectively. Having placed the main halo at the centre of the lens plane, we produce deflection-angle maps for several distances between the merging clumps by moving the substructure along the -axis. Then, we apply the methods discussed in the previous sections for determining how the lensing cross sections evolve as functions of the distance between the colliding halos. Results are shown in Fig. 5. Different line types refer to different cosmological models and all curves are normalised to the cross section of an unperturbed halo of mass .
We note that in this analytic experiment we reproduce well the three peaks in the lensing cross sections which were previously found in numerical lensing simulations by Torri et al. (2004). As discussed there, the first and third peaks are due to the increasing shear in the region between the two merging halos, while the substructure approaches the main cluster clump. The second peak is due to the larger convergence of the lens when the two clumps are perfectly aligned. As anticipated earlier, the growth of the lensing cross sections relative to the unperturbed case is larger by more than in the CDM than in the OCDM model. Other cosmological models with static and dynamical dark energy interpolate between CDM and OCDM, confirming our assertion that mergers have a stronger impact in cosmological models where halos are less concentrated.
Bartelmann et al. (2003) already estimated using analytic models the change of the optical depth relative to the CDM model in different cosmological models with constant equation of state of the dark energy. The only cosmological model we investigated here, which can be directly compared to the results of Bartelmann et al. (2003) is the DECDM model with CMB normalisation. In this particular case, we find an optical depth which is larger by roughly compared to the CDM case, while the analytic models predicted a larger increment, i.e. between and . This inconsistency is again due to the smaller impact of mergers in the DECDM compared to the CDM model.
As discussed earlier, we see larger differences in the differential optical depth among different cosmological models at high redshift. This is better shown in Fig. 6, where we plot the integrated optical depth as a function of redshift, when the contribution from lenses below redshift is neglected. The curves are normalised to the CDM model. The curves show that the deviations from the CDM model become significantly larger at redshifts higher than . Therefore, searching for arcs in high-redshift clusters can be very promising for constraining both the cluster evolution and the equation of state of dark energy.

6 Summary
We have investigated the efficiency of numerically simulated galaxy clusters for producing strong lensing events in different cosmological models with constant and time-variable equation of state of the dark energy, and we have compared it with “standard” CDM and OCDM models. Both the local abundance of galaxy clusters and the observed amplitude of the temperature fluctuations in the CMB have been used for normalising the power spectrum of the primordial density perturbations generating our sample of numerically simulated clusters. In the latter case, the normalisation is reduced for accounting for the increasing ISW effect affecting in different ways the large-scales CMB anisotropies in the cosmologies we considered. When the local cluster-abundance normalisation is used, the initial conditions in the N-body simulations were set up such as to obtain halos having approximately the same evolution at redshift zero.
Our main results can be summarised as follows:
-
•
the lensing cross sections for long and thin arcs averaged over all clusters in our sample reflect the differences in the concentration of dark matter halos in different cosmological models. Halos are more efficient for producing strong gravitational lensing events in those cosmological models where they are more concentrated. Assuming the cluster abundance normalisation of the power spectrum, we find lensing cross sections which are smaller by roughly a factor of four in the CDM compared to the OCDM model, and the other dark energy models interpolate between them. Moreover, despite their present equation of state is the same for the RP and the SUGRA models, their lensing cross sections differ substantially. For those dark energy models where CMB normalisation is adopted, we find lensing cross sections smaller by more than one order of magnitude compared to the OCDM model, indicating that the power spectrum normalisation is a crucial aspect for assessing the relative behaviour of the strong-lensing effect in different dark energy cosmologies.
-
•
We find that the local maxima in the lensing efficiency are caused by merger events occurring in the lenses. In particular, we verify that the peaks in the redshift evolution of lensing cross sections of individual clusters are shifted in time due to the offset between the merger histories in different cosmologies.
-
•
The optical depth for lensing is larger in those cosmological models where lenses form earlier and are thus more concentrated. Moreover, the contribution to the total optical depth comes from clusters in a wider redshift range in these cosmologies.
-
•
Compared to the CDM model, the optical depth in the OCDM model is larger by only a factor of two, in disagreement with the results of previous other work, which found order-of-magnitude differences between these two models. However, the higher time resolution of our simulations allows us to account for the merger events occurring in the lenses, which we verified to have a stronger impact in those cosmological models where lenses are less concentrated.
-
•
When the same normalisation of the power spectrum is adopted, we find that clusters in the dark-energy models we investigated have optical depths within the boundaries set by the CDM and the OCDM models. However, when the CMB normalisation is used, the optical depths become significantly smaller. The differences between the cosmological models are relatively small, but they become larger when the contribution to the lensing optical depths from high redshift clusters is considered.
Based on these results, we conclude that arc statistics is a potentially very powerful tool for constraining the equation of state of dark energy, and for investigating the dynamical evolution of galaxy clusters. In particular, strong lensing events at high redshift represent an important source of information which might be used for discriminating between dark energy models. Further investigations are needed now for fully understanding the impact of mergers on the lensing cross sections and its dependence on cosmology.
Acknowledgements.
The lensing simulations were carried out on the IBM-SP4 machine at the “Rechenzentrum Garching der Max-Planck-Gesellschaft und des IPP” (Garching). The N-body simulations were performed at the “Centro Interuniversitario del Nord-Est per il Calcolo Elettronico” (CINECA, Bologna), with CPU time assigned under an INAF-CINECA grant. K. Dolag acknowledges support by a Marie Curie Fellowship of the European Community program “Human Potential under contract number MCFI-2001-01227.References
- Baccigalupi et al. (2002) Baccigalupi, C., Balbi, A., Matarrese, S., Perrotta, F., & Vittorio, N. 2002, PRD, 65, 063520
- Baccigalupi et al. (2000) Baccigalupi, C., Matarrese, S., & Perrotta, F. 2000, PRD, 62, 123510
- Bartelmann et al. (1998) Bartelmann, M., Huss, A., Colberg, J., Jenkins, A., & Pearce, F. 1998, A&A, 330, 1
- Bartelmann et al. (2003) Bartelmann, M., Meneghetti, M., Perrotta, F., Baccigalupi, C., & Moscardini, L. 2003, A&A, 409, 449
- Bartelmann et al. (2002) Bartelmann, M., Perrotta, F., & Baccigalupi, C. 2002, A&A, 396, 21
- Bartelmann et al. (1995) Bartelmann, M., Steinmetz, M., & Weiss, A. 1995, A&A, 297, 1
- Bartelmann & Weiss (1994) Bartelmann, M. & Weiss, A. 1994, A&A, 287, 1
- Bennett et al. (2003) Bennett, C., Halpern, M., Hinshaw, G., et al. 2003, ApJ in press; preprint astro-ph/0302207
- Brax & Martin (2000) Brax, P. & Martin, J. 2000, PRD, 61, 103502
- Dalal et al. (2003) Dalal, N., Holder, G., & Hennawi, J. F. 2003, ApJ, submitted; preprint astro-ph/0310306
- Dolag et al. (2004) Dolag, K., Bartelmann, M., Perrotta, F., Baccigalupi, C., et al. 2004, A&A, 416, 853
- Gladders et al. (2003) Gladders, M., Hoekstra, H., Yee, H., Hall, P., & Barrientos, L. 2003, ApJ submitted; preprint astro-ph/0303341
- Hasinger et al. (1998) Hasinger, G., Giacconi, R., Gunn, J., et al. 1998, A&A, 340, L27
- Hawkins et al. (2003) Hawkins, E., Maddox, S., Cole, S., Lahav, O., et al. 2003, MNRAS, 346, 78
- Hockney & Eastwood (1988) Hockney, R. & Eastwood, J. 1988, Computer simulation using particles (Bristol: Hilger, 1988)
- Jenkins et al. (2001) Jenkins, A., Frenk, C., White, S., et al. 2001, MNRAS, 321, 372
- Lidman et al. (2004) Lidman, C., Rosati, P., Demarco, R., et al. 2004, A&A, 416, 829
- Meneghetti et al. (2003a) Meneghetti, M., Bartelmann, M., & Moscardini, L. 2003a, MNRAS, 346, 67
- Meneghetti et al. (2003b) Meneghetti, M., Bartelmann, M., & Moscardini, L. 2003b, MNRAS, 340, 105
- Meneghetti et al. (2000) Meneghetti, M., Bolzonella, M., Bartelmann, M., Moscardini, L., & Tormen, G. 2000, MNRAS, 314, 338
- Meneghetti et al. (2001) Meneghetti, M., Yoshida, N., Bartelmann, M., et al. 2001, MNRAS,, 325, 435
- Peebles & Ratra (2002) Peebles, P. & Ratra, B. 2002, Rev. Mod. Phys., 75, 599
- Perlmutter et al. (1999) Perlmutter, S., Aldering, G., Goldhaber, G., Knop, R., et al. 1999, ApJ, 517, 565
- Perrotta & Baccigalupi (1999) Perrotta, F. & Baccigalupi, C. 1999, PRD, 59, 123508
- Perrotta et al. (2000) Perrotta, F., Baccigalupi, C., & Matarrese, S. 2000, PRD, 61, 023507
- Ratra & Peebles (1988) Ratra, B. & Peebles, P. 1988, PRD, 37, 3406
- Riess et al. (2004) Riess, A., Strolger, L.-G., Tonry, J., Casertano, S., et al. 2004, ApJ in press, preprint astro-ph/0402512
- Riess et al. (1998) Riess, A. G., Filippenko, A. V., Challis, P., et al. 1998, AJ, 116, 1009
- Seljak & Zaldarriaga (1996) Seljak, U. & Zaldarriaga, M. 1996, ApJ, 469, 437
- Spergel et al. (2003) Spergel, D., Verde, L., Peiris, H., Komatsu, E., et al. 2003, ApJS, 148, 175
- Springel et al. (2001) Springel, V., Yoshida, N., & White, S. 2001, New Astronomy, 6, 79
- Tegmark et al. (2004) Tegmark, M., Strauss, M., Blanton, M., Abazajian, S., et al. 2004, PRD in press; preprint astro-ph/0310723
- Tormen et al. (1997) Tormen, G., Bouchet, F., & White, S. 1997, MNRAS, 286, 865
- Torri et al. (2004) Torri, E., Meneghetti, M., Bartelmann, M., et al. 2004, MNRAS, 349, 476
- Wambsganss et al. (2004) Wambsganss, J., Bode, P., & Ostriker, J. 2004, ApJL, 606, 93
- Wambsganss et al. (1998) Wambsganss, J., Cen, R., & Ostriker, J. 1998, ApJ, 494, 29
- Weinberg & Kamionkowski (2003) Weinberg, N. & Kamionkowski, M. 2003, MNRAS, 341, 251
- Wetterich (1988) Wetterich, C. 1988, Nuclear Physics B, 302, 668
- Yoshida et al. (2001) Yoshida, N., Sheth, R., & Diaferio, A. 2001, MNRAS, 328, 669
- Zaritsky & Gonzalez (2003) Zaritsky, D. & Gonzalez, A. 2003, ApJ, 584, 691