Mass, Age, and Space Distributions of Star Clusters
Abstract
This article reviews some recent studies of the mass, age, and space distributions of star clusters, with a primary focus on the large population of clusters in the interacting Antennae galaxies. Some of the highlights of these studies are the following: 1. The mass function of the young clusters (with ages yr) has power-law form, , over the observed range of masses, . 2. The age distribution of the clusters declines steeply at all ages, roughly as for mass-limited samples, indicating rapid disruption of most clusters. 3. At least 20% and possibly all stars form in clusters and/or associations, including those that are unbound and short-lived. 4. Many of the clusters that remain bound just after their formation are disrupted on longer timescales by a combination of mass loss by stellar evolution and several stellar dynamical processes. 5. The young clusters have a clumpy space distribution and are located preferentially in regions of high interstellar density, at least when averaged over scales of about a kpc. 6. The positions of the young clusters, however, are not correlated with the local velocity gradients or velocity dispersions in the interstellar medium. There are growing indications that most of these conclusions also apply to the populations of young star clusters in other galaxies, both interacting and quiescent.
Space Telescope Science Institute, 3700 San Martin Drive, Baltimore, MD, 21218, USA
1. Introduction
Some of the most basic properties of star clusters are their masses, ages, and positions. The distributions of these quantities for a population of clusters reveal clues about the processes involved in their formation and disruption. The focus of this article is on the mass, age, and space distributions of the star clusters in the Antennae galaxies. These clusters have attracted attention for several reasons. The Antennae galaxies are the nearest and best-studied pair of merging galaxies, consisting of two large spirals that collided and began to commingle a yr ago. The number of young clusters in the Antennae galaxies is huge, permitting the mass, age, and space distributions to be determined better than in any other galaxies, except perhaps the Milky Way and Andromeda. The ongoing merger is almost certainly responsible in some way for this large population of clusters. Understanding the formation and disruption of clusters in this setting is important because it represents a latter-day example of the hierarchical formation of galaxies, a process that operated even more effectively in the early universe. Thus, despite the apparently special nature of the cluster population in the Antennae galaxies, the lessons we learn from it are likely to have broad implications.
This article is a review of some studies made over the past five years by Rupali Chandar, François Schweizer, Bradley Whitmore, Qing Zhang, and the author (see also the articles in this volume by Chandar and Whitmore). The observational parts of these studies are based on images taken in the broad , , , and narrow H passbands with the Wide Field Planetary Camera 2 (WFPC2) on the Hubble Space Telescope (HST) and described fully by Whitmore et al. (1999). We compare these observations with stellar population models to estimate the ages (), extinctions (), corrected luminosities (), and hence masses () of the clusters. Some of the brightest clusters are spatially resolved in the HST images, but those near the limiting magnitude are indistinguishable from stars. We minimize stellar contamination in our cluster sample by restricting it to objects brighter than the most luminous stars. Since our sample is optically selected, it undoubtly excludes the clusters most heavily obscured by dust. The fraction of missing clusters is hard to estimate but is expected to decline with increasing age.
2. Mass Distribution
Figure 1 shows the luminosity-age distribution of the star clusters in the Antennae galaxies. This is an updated version of a similar diagram based on two reddening-free parameters derived from our broad-band , , , and measurements (Zhang & Fall 1999). The new diagram utilizes the narrow-band H measurements, as well as the broad-band measurements, and provides excellent age discrimination near yr, the age at which the ionizing flux from a stellar population declines rapidly. The vertical striations of the data points in Figure 1 are artifacts caused by a combination of observational errors and abrupt bends in the stellar population tracks in the color space in which the fits are made. These small-scale features in the - diagram should be ignored; only the gross distribution of data points is significant. The diagonal lines in Figure 1 represent the evolutionary tracks of stellar population models of fixed initial mass, and . The horizontal line is close to the maximum stellar luminosity.
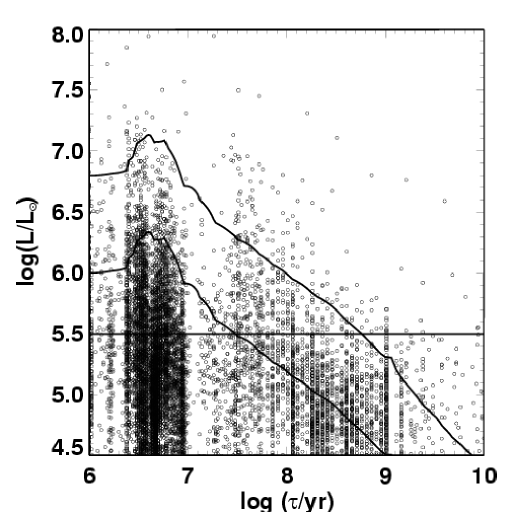
Figure 1 contains much of the available statistical information about the population of star clusters in the Antennae galaxies. For example, the luminosity function, , is obtained by projecting the two-dimensional distribution horizontally along the age axis. We obtain the mass function, , by projecting instead in a diagonal direction, along the stellar population tracks, and counting clusters in the corresponding mass bins. It should be clear from this that the luminosity and mass functions need not have the same or even similar forms. The mass function, while more difficult to determine than the luminosity function (because the ages of the clusters must also be estimated), is the more physically informative of the two. The relationship between the luminosity and mass functions also involves the age distribution, which in turn depends on the formation and disruption histories of the clusters.
Figure 2 shows the mass function of the star clusters in the Antennae galaxies for two intervals of age, yr and yr. It is difficult to estimate for older clusters because only the most massive among them are brighter than the limiting luminosity for stellar contamination (assumed for simplicity to be constant). In Figure 2, we have plotted against , where , defined as the number of clusters per unit , is related to , the number of clusters per unit , by . Evidently, the mass function declines monotonically with increasing mass. It can be represented by a power law of the form , with over the entire observed range, . Moreover, the exponent appears to have little or no dependence on age, at least for yr. (These results confirm the earlier ones from Zhang & Fall 1999.)

The luminosity function of the star clusters in the Antennae galaxies can also be represented, at least in a first approximation, by a power law, , with (Whitmore et al. 1999). The reason the mass and luminosity functions happen to have similar forms in this case is that the age distribution is relatively narrow, most clusters being younger than yr (see below). In the hypothetical limit that all clusters had exactly the same age (and stellar initial mass function), would have exactly the same dependence on that has on .
The power-law form of the mass function of the young clusters in the Antennae galaxies is reminiscent of the mass functions of the molecular clouds and complexes in the Milky Way (MW) and the Large Magellanic Cloud (LMC). These have , with for in the MW (Heyer, Carpenter, & Snell 2001) and for in the LMC (Fukui 2002). Radio CO observations do not yet have enough angular resolution to determine the mass functions of the molecular clouds in more distant galaxies, such as the Antennae. The power-law form of the mass functions of molecular clouds is almost certainly related in some way to the fractal or scale-free structure of the turbulent interstellar medium (ISM), perhaps the result of a density threshold (Elmegreen 2002). The exponent has the property that equal logarithmic intervals of the masses of the clouds or clusters contain the same total mass. Despite some recent progress, there does not yet appear to be a compelling physical explanation for the particular value .
The mass function of the young star clusters in the Antennae and other galaxies is completely different from that of old globular clusters. For the latter, and thus are usually represented by lognormal distributions, with a peak at . It turns out, however, that the low-mass part () is fitted even better by , hence (McLaughlin 1994; Fall & Zhang 2001). Any population of star clusters will be eroded by a variety of disruptive processes, including mass loss by stellar evolution and the evaporation of stars by internal two-body relaxation and external gravitational shocks. Of these, two-body relaxation is by far the dominant mechanism for low-mass clusters over long times ( yr). Several theoretical studies, spanning many years and with increasing realism, have shown that the disruption of clusters would cause their mass function, if initially a power law, to evolve in a Hubble time into one like that of old globular clusters (Fall & Rees 1977; Baumgardt 1998; Vesperini 1998; Fall & Zhang 2001). This result provides a physical basis for the suggestion that most or even all star clusters form by some universal mechanism and that the differences in their observed properties mainly reflect the differences in their ages and/or the sizes of the samples (Elmegreen & Efremov 1997; Larsen 2002; Whitmore 2003).
3. Age Distribution
The age distribution of a population of star clusters contains information about the formation and disruption of the clusters. It can be derived from the two-dimensional - diagram in different ways, depending on the selection criteria of the sample. The most common form of is for a luminosity-limited sample, obtained simply by counting clusters in age bins above the limiting luminosity. This, however, is not straightforward to interpret in dynamical terms because it depends on the fading of the clusters by stellar evolution in addition to their formation and disruption histories. A more physically informative age distribution is that for a mass-limited sample. We obtain this form of by counting the clusters in age bins above one of the stellar population tracks in Figure 1.
Figure 3 shows the age distribution of the star clusters in the Antennae galaxies for both luminosity- and mass-limited samples. The former is somewhat steeper than the latter because it includes a higher proportion of young clusters and a lower proportion of old clusters. In the following, we only consider results from mass-limited samples, for the reasons mentioned above. We find that the age distribution declines rapidly, starting at very young ages. In particular, drops by a factor of at least 10 between yr and yr. The rate of decline has no noticeable dependence on mass, at least for . The age distribution has features corresponding to the vertical striations in Figure 1, which in turn are caused by a combination of observational errors and abrupt bends in the stellar population tracks. If we ignore these small-scale features and force-fit the age distribution by a power law, we obtain . Including the clusters obscured by dust, presumably mostly young, would steepen .

The age distribution in general reflects a combination of birth and death rates. Thus, the narrow peak near yr might be interpreted as the result of a very short and intense burst of cluster formation, possibly triggered by the current interaction between the two Antennae galaxies. This, however, is extremely unlikely for two reasons. First, the Antennae galaxies have been interacting for the past yr, a time much longer than the width of the peak in . Second, the age distribution is similar in different parts of the Antennae galaxies, some of which appear to be interacting more strongly than others (see the article by Whitmore in this volume). Thus, it is almost certain that the steep decline in the age distribution is caused mainly by rapid disruption rather than a recent burst in the formation of the clusters.
The short timescale on which the clusters are disrupted indicates that most of them are not gravitationally bound. In terms of the initial characteristic radius (three-dimensional median radius) and virial velocity , the crossing time for stars orbiting within a bound cluster or protocluster is . We estimate yr for a typical young cluster with , pc, and kms-1. The crossing time is expected to be similar for clusters of different masses and radii because it depends on these quantities only through the mean density, which is determined primarily by the tidal field of the host galaxy. If a protocluster suddenly lost most of its mass by the removal of interstellar matter, it would no longer be gravitationally bound and would expand almost freely, its characteristic radius increasing with age as and its characteristic surface density decreasing as . Thus, after yr, the surface brightness of the cluster (even ignoring the fading by stellar evolution) would be roughly a factor of lower or 5 magnitudes fainter than initially (at yr), and it would then disappear among the statistical fluctuations in the foreground and background of field stars. (Note that the half-light diameters of the youngest clusters are similar to the dimensions of a single WFC pixel, 0.1 arcsec; thus, the expressions above are expected to describe accurately the apparent sizes and surface brightnesses of expanding clusters for , but not for .)
What could cause this high rate of infant mortality among the star clusters in the Antennae and other galaxies? The gravitational binding energy of a massive cluster is only erg, much less than the energy output of a single massive star over its short lifetime. The energy and momentum output from massive stars comes in the form of ionizing radiation, stellar winds, jets, and supernovae. These processes could easily remove much of the ISM from a protocluster, leaving the stars within it gravitationally unbound and expanding freely as argued above, even if the cloud in which they formed was initially bound. The energy and momentum deposited in a protocluster by these processes is approximately proportional to the number of massive stars and hence on average to the mass of the protocluster. Moreover, the associated thermal and outflow velocities are much higher than the escape speed from the protoclusters. Thus, we expect the fraction of disrupted clusters to be roughly independent of mass, consistent with our observations that the shape of the mass function is nearly independent of age, at least for yr, and that the shape of the age distribution is nearly independent of mass, at least for .
These arguments suggest that the survival of a cluster, not its disruption, may be the more difficult fact to explain. Whether a particular cluster survives may depend on “accidental” factors, such as just where and when the most massive stars happen to form within the protocluster. Indeed, the inner, dense cores of protoclusters are more likely to survive than their outer envelopes. As a result, clusters may retain some of their stars and lose others. Because the mass function of the clusters is a power law, roughly independent of age, we cannot distinguish between the case in which every cluster loses 90% of its mass in the first yr and the case in which 90% of the clusters lose all of their mass while the others lose none—or any other case between these extremes. However, we can conclude, irrespective of this ambiguity, that 90% or more of the stars that form in recognizable clusters are dispersed in the field population before they are yr old. The few clusters that manage to survive their infancy are then subject to disruption on longer timescales by a combination of stellar evolution and stellar dynamical processes, as discussed in Section 2.
In connection with the formation and disruption rates of the clusters, it is also interesting to estimate the fraction of stars that are born within clusters (and/or “associations”). We can set a lower limit on this fraction from the observed fraction of H emission closely associated with the clusters in our sample. This fraction is about 20%. This is a lower limit on the fraction of stars born in clusters for several reasons: (1) it includes only those clusters brighter than our stellar contamination limit and hence more massive than ; (2) some of the ionizing radiation from the clusters will escape from their immediate vicinity and cause H emission elsewhere; (3) some clusters will be disrupted even before they stop producing ionizing radiation. Each of these effects alone could increase the fraction by factors of 1–2, and together they could increase it by a factor up to 5. We conclude from this that at least 20% and possible all of the stars in the Antennae galaxies were born in clusters, including the large majority of clusters that were initially unbound.
4. Space Distribution
The space distribution of a population of star clusters, especially when compared with the density and velocity fields of the nearby interstellar medium, have the potential to reveal important clues about the physical processes involved in the the formation of the clusters. We have made such a study for the star clusters in the Antennae galaxies (Zhang, Fall, & Whitmore 2001). This is based on the positions of the clusters in different age groups in our HST images and on the intensity and velocity maps of the galaxies at a variety of wavelengths from other investigations: broad-band radio (6 cm), infrared (60 m and 15 m), optical (8000 Å), ultraviolet (1500 Å), and X-ray (0.1–2.5 keV) continuum emission and narrow-band CO (1–0) 2.6 mm, HI 21 cm, and H 6563 Å line emission.
We find that the clusters have a clumpy space distribution, with an angular autocorrelation function of approximate power-law form, . The cross-correlations between the positions of the clusters and the other maps show, as expected, that the young clusters tend to be associated more with long-wavelength and less with short-wavelength emission than the old clusters. Many of the youngest clusters appear to be embedded in molecular cloud complexes with dimensions up to 1 kpc. Both the surface rates of star and cluster formation, and , as determined by H emission, are correlated with the surface density of the interstellar medium , the sum of the molecular and atomic densities, when averaged on scales of 1 kpc or more. These relations have much scatter, but in the mean, take the approximate forms and . The first, for the star formation rate, is the usual Schmidt-Kennicutt relation; the second, for the cluster formation rate, is new. The observation that and are proportional to each other is, of course, consistent with our claim in the previous section that most or all stars form in clusters (including those that are unbound). On scales smaller than 1 kpc, the scatter becomes so large that the correlations between , , and practically disappear, possibly because the local ISM is depleted by recent star and cluster formation, possibly because the associated feedback by ionizing radiation, stellar winds, jets, and supernovae is also important.
We have also compared the positions of the star clusters in the Antennae galaxies with the local velocity gradients and dispersions in the ISM, as derived from the HI 21 cm and H 6563 Å lines. This is motivated by suggestions that the main trigger for the formation of the clusters might be the motions in the ISM driven by the colliding galaxies. The idea is that the the dynamic overpressure caused by these motions might induce the collapse of clouds that would otherwise be stable or long-lived in a more quiescent environment. We find that some of the young clusters are located in regions with above-average velocity gradients and dispersions. However, this is not statistically true of the population as a whole; the cross correlations between the positions of the clusters of all age groups and the interstellar velocity gradients and dispersions are nearly zero at all angular separations (see Figures 15, 16, and 17 of Zhang et al. 2001). Evidently, the formation of the clusters depends more on the density structure of the ISM than on its velocity structure.
5. Conclusions
Some of the main conclusions of the studies reviewed here are listed below. Strictly speaking, these pertain only to the star clusters in the Antennae galaxies. There is, however, growing evidence that many if not all of these conclusions are more widely applicable and may even be valid, at least approximately, for the majority star clusters in most galaxies (see, e.g., Larsen 2002; Lada & Lada 2003; Whitmore 2003, and references therein).
1. The mass function of the young clusters (with ages yr) has power-law form, , over the observed range of masses, . It is possible, even likely, that the mass function continues to rise toward lower masses. This is similar to the mass functions of the molecular clouds and young (open) star clusters in the Milky Way and the Large Magellanic Cloud, but very different from the mass functions of old (globular) clusters in the Milky Way and other galaxies.
2. The age distribution of the clusters declines steeply at all ages, roughly as for mass-limited samples, indicating rapid disruption of most clusters. In particular, 90% or more of the clusters disappear by an age of yr, when the stars within them have completed fewer than 10 orbits. It is very likely that these clusters are not gravitationally bound, and were disrupted near the times they formed by the energy and momentum input from young stars to the ISM of the protoclusters.
3. At least 20% and possibly all stars form in clusters and/or associations, including those that are unbound and short-lived. However, because most clusters are disrupted while they are very young, the vast majority of stars spend most of their lives as members of the field population. As a result, bound, long-lived clusters contain only a small fraction of the stars in galaxies.
4. Many of the clusters that remain bound just after their formation are disrupted on longer timescales by a combination of mass loss by stellar evolution and several stellar dynamical processes. For low-mass clusters, the most important disruptive process is the evaporation of stars caused by internal, two-body relaxation. Over a Hubble time, this can turn a mass function with an initial power-law form into one like that of old globular clusters, with a peak at .
5. The young clusters have a clumpy space distribution and are located preferentially in regions of high interstellar density, at least when averaged over scales of about a kpc. The correlation between the cluster formation rate and the ISM density is similar to that known previously between the star formation rate and the ISM density, namely .
6. The positions of the young clusters, however, are not correlated with the local velocity gradients or velocity dispersions in the interstellar medium. This somewhat surprising observation places constraints on which physical mechanisms may have been responsible for triggering the formation of the clusters. In particular, the large-scale chaotic motions caused by the collision and merging of the galaxies seems not to be the dominant mechanism.
Acknowledgments.
I am grateful to my collaborators on all the projects reviewed here, and especially to Rupali Chandar and Bradley Whitmore for help in the preparation of this article.
References
- (1) Baumgardt, H. 1998, A&A, 330, 480
- (2) Bruzual, G., & Charlot, S. 2003, MNRAS, 344, 1000
- (3) Elmegreen, B. G. 2002, ApJ, 564, 773
- (4) Elmegreen, B. G., & Efremov, Y. N. 1997, ApJ, 480, 235
- (5) Fall, S. M., Chandar, R., & Whitmore, B. C. 2004, in preparation
- (6) Fall, S. M., & Rees, M. J. 1977, MNRAS, 181, 37P
- (7) Fall, S. M., & Zhang, Q. 2001, ApJ, 561, 751
- (8) Fukui, Y. 2002, in Extragalactic Star Clusters (IAU Symposium 207), ed. D. Geisler, E. K. Grebel, & D. Minniti (San Francisco: ASP), 505
- (9) Heyer, M. H., Carpenter, J. M., & Snell, R. L. 2001, ApJ, 551, 852
- (10) Lada, C. J., & Lada, E. A. 2003, ARA&A, 41, 57
- (11) Larsen, S. S. 2002, AJ, 124, 1393
- (12) McLaughlin, D. E. 1994, PASP, 106, 47
- (13) Vesperini, E. 1998, MNRAS, 299, 1019
- (14) Whitmore, B. C. 2003, in A Decade of Hubble Space Telescope Science (STScI Symposium 14), ed. M. Livio, K. Noll, & M. Stiavelli, (Cambridge: Cambridge Univ. Press), 153
- (15) Whitmore, B. C., Zhang, Q., Leitherer, C., Fall, S. M., Schweizer, F., & Miller, B. W. 1999, AJ, 118, 1551
- (16) Zhang, Q., & Fall, S. M. 1999, ApJ, 527, L81
- (17) Zhang, Q., Fall, S. M., & Whitmore, B. C. 2001, ApJ, 561, 727