GRB 021211 as a Faint Analogue of GRB 990123: Exploring the Similarities and Differences in the Optical Afterglows111Some of the observations reported here were obtained at the MMT Observatory, a joint facility of the Smithsonian Institution and the University of Arizona. Some of the observations reported here were obtained with the Magellan 2 (Landon Clay) telescope at the Las Campanas Observatory. Some of the observations reported here were taken at the WIYN Observatory, a joint facility of the University of Wisconsin-Madison, Indiana University, Yale University, and the National Optical Astronomy Observatories.
Abstract
We present photometry of the optical afterglow of the gamma-ray burst GRB 021211 (catalog ) taken at the Magellan, MMT, and WIYN observatories between 0.7 and 50 days after the burst. We find an intrinsic spectral slope at optical and near-infrared wavelengths of at 0.87 days. The optical decay during the first day is almost identical to that of GRB 990123 (catalog ) except that GRB 021211 (catalog )’s optical afterglow was intrinsically approximately 38 times fainter and the transition from the reverse shock to the forward shock may have occurred earlier than it did for GRB 990123 (catalog ). We find no evidence for a jet break or the cooling break passing through optical frequencies during the first day after the burst. There is weak evidence for a break in the -band decay between 0.89 and 1.87 days which may be due to a jet. The optical and infrared data are consistent with a relativistic fireball where the shocked electrons are in the slow cooling regime and the electron index is . The forward shock appears to have been expanding in a homogeneous ambient medium during the first day after the burst. Our analysis suggests that the jet of GRB 021211 (catalog ) may have a small opening angle and that the total gamma-ray energy is likely to be much less than the canonical value of erg. If this is the case then it is possible that most of the energy of the burst is in another form such as a frozen magnetic field, supernova ejecta, or a second jet component. The host galaxy of GRB 021211 (catalog ) is subluminous and has a star formation rate of at least 1 yr-1.
1 Introduction
The study of gamma-ray bursts (GRBs) took a giant leap forward in 1997 when observations with the Dutch–Italian satellite BeppoSAX identified a fading -ray source inside the error box of GRB 970228 (catalog ) (Costa et al., 1997). This rapid localization of a counterpart allowed the fading optical afterglow (OA) to be seen (Groot et al., 1997; van Paradijs et al., 1997). Later that year Metzger et al. (1997) found a redshift of 0.835 for GRB 970508 (catalog ), which confirmed the cosmological distances of GRBs. Since then the afterglows of several dozen GRBs have been localized. In the cases where the afterglows have been well localized the median redshift is approximately two and there is no evidence for extra-Galactic reddening of more than approximately one mag along the line of sight to the afterglow. Host galaxies have been found for almost every well-localized GRB identified (Bloom et al., 2002).
The FREGATE, WXM, and SXC instruments on board the High Energy Transient Explorer II (HETE-II) satellite detected gamma-ray burst (GRB) GRB 021211 (catalog ) (= HETE trigger H2493) in the constellation Cancer at 11:18:34.03 UT on 2002 Dec. 11 (Crew et al., 2002, 2003). The burst consisted of a single peak with a fast rise and exponential decay profile. The durations were seconds at high energies (85–400 keV) and seconds at low energies (2–10 keV). The energy fluence was erg cm-2 between 7 and 30 keV, and erg cm-2 between 30 and 400 keV giving a hardness ratio of (Crew et al., 2003). The gamma-ray properties of GRB 021211 (catalog ) were not unusual and fit into the long–soft class of bursts (Kouveliotou et al., 1993). The burst was -ray rich with a spectrum that peaked at keV (Crew et al., 2003).
The field of GRB 021211 (catalog ) was observed starting 20.74 minutes after the HETE-II trigger with the Near Earth Asteroid Tracking Camera on the Oschin 48-inch telescope at the Palomar Observatory. These observations led to the announcement of the discovery of the OA (Fox et al., 2003). Observations taken even earlier by Wozniak et al. (2002); Li et al. (2003), and Park et al. (2002) show that the OA faded rapidly, with a power-law slope of approximately 1.6, between approximately 90 seconds and 11 minutes after the burst. After this it faded more slowly, with a power-law slope of 0.82 (Li et al., 2003). Della Valle et al. (2003) found a redshift of for the host galaxy based on four emission lines from the host galaxy.
Wei (2003) finds that the optical decay of GRB 021211 (catalog ) can be explained if the emission before eleven minutes is due to the reverse shock while the emission after that is due to the forward shock. They find that the magnetic field strength is unusually low and propose that this is why GRB 021211 (catalog )’s OA was faint. However, Kumar & Panaitescu (2003) and Panaitescu & Kumar (2004) analyse radio and optical data for GRB 021211 (catalog ) and find that the observations before eleven minutes after the burst are consistent with a reverse shock if the energy density in the magnetic field in the reverse shock is , higher than usual for a GRB. They also find that the local environment around the progenitor is best fit by a homogeneous interstellar medium (ISM) with a low particle density ( to cm-3). Their model suggests that the magnetic field was frozen in during the explosion, and that the magnetic field contains a significant amount of the energy from the explosion.
Della Valle et al. (2003) used deep imaging and spectroscopy to find evidence of a supernova component 27 days after the burst. They find that the optical spectrum is consistent with that of SN1998bw (catalog ) and the Type Ic supernova SN1994I (catalog ). This made GRB 021211 (catalog ) the second GRB—after GRB 030329 (catalog )/SN2003dh (catalog ) (Stanek et al., 2003; Matheson et al., 2003; Hjorth et al., 2003)—for which spectroscopic confirmation of a link between GRBs and supernovae was obtained. Della Valle et al. (2003) find mag for the host galaxy.
In this paper we adopt a cosmology with a Hubble parameter of km s-1 Mpc-1, a matter density of , and a cosmological constant of . For this cosmology a redshift of corresponds to a luminosity distance of 6.64 Gpc and a distance modulus of 44.11. One arcsecond corresponds to 16.06 comoving kpc, or 8.02 proper kpc. The look back time is 7.75 Gyr.
2 The Data
The OA for GRB 021211 (catalog ) is located at R.A. , Dec. (J2000) (Fox et al., 2003), which corresponds to Galactic coordinates of . The reddening maps of Schlegel et al. (1998) give a Galactic reddening of mag in this direction. The corresponding Galactic extinctions are , , , , , , , and mag.
2.1 Optical Photometry
Optical imaging data were obtained on 2002 Dec. 12 UT using the Minicam on the 6.5m Multi-Mirror Telescope (MMT) at the MMT Observatory. The instrumental gain was 2.7 e- ADU-1, the readout noise was 4.5 e- per pixel, and the plate scale was per pixel.
We obtained additional optical imaging data on 2003 Jan. 2 UT using the Low Dispersion Survey Spectrograph 2 (LDSS-2) in its imaging mode on the 6.5m Magellan 2 Landon Clay telescope at the Las Campanas Observatory. The gain was 3.8 e- ADU-1, the readout noise was 10.2 e- per pixel, and the plate scale was per pixel.
Our final set of optical imaging data were obtained on 2003 Jan. 29 UT using Minimosaic on the WIYN 3.5m telescope at Kitt Peak. The gain was 1.5 e- ADU-1, the readout noise was 5.5 e- per pixel, and the plate scale was per pixel.
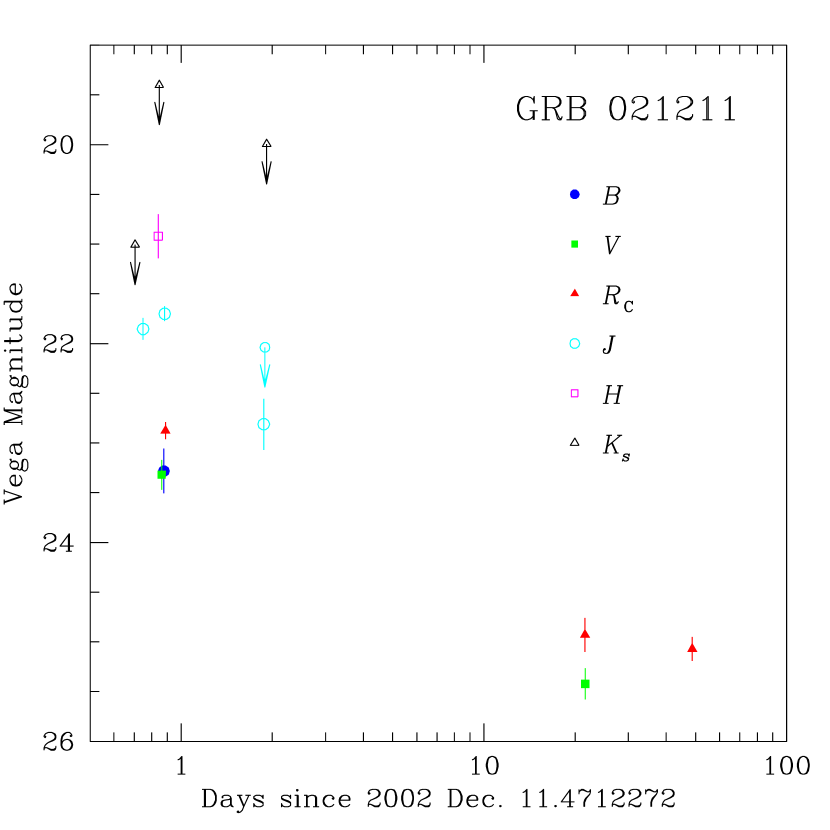
A log of our observations and the photometry of the OA is presented in Table 1. No reddening corrections have been applied to the data in this Table. Figure 1 shows the optical data presented in this paper.
| UT Date | JD 2450000 | (days) | Telescope | Filter | Magnitude | Seeing () | Exptime (s) |
|---|---|---|---|---|---|---|---|
| Dec. 12.17617 | 2620.67617 | 0.70494 | Magellan 1/ClassicCam | 660 | |||
| Dec. 12.22002 | 2620.72002 | 0.74879 | Magellan 1/ClassicCam | 21.85 0.11 | 3720 | ||
| Dec. 12.31163 | 2620.81163 | 0.84040 | Magellan 1/ClassicCam | 20.92 0.22 | 240 | ||
| Dec. 12.31873 | 2620.81873 | 0.84750 | Magellan 1/ClassicCam | 240 | |||
| Dec. 12.33329 | 2620.83329 | 0.86206 | MMT/Minicam | 23.32 0.15 | 500 | ||
| Dec. 12.34816 | 2620.84816 | 0.87693 | MMT/Minicam | 23.28 0.23 | 900 | ||
| Dec. 12.35336 | 2620.85336 | 0.88213 | Magellan 1/ClassicCam | 21.70 0.08 | 4680 | ||
| Dec. 12.35917 | 2620.85917 | 0.88794 | MMT/Minicam | 22.88 0.09 | 900 | ||
| Dec. 13.34512 | 2621.84512 | 1.87389 | Magellan 1/ClassicCam | 22.81 0.26 | 4320 | ||
| Dec. 13.36368 | 2621.86368 | 1.89245 | Magellan 1/ClassicCam | 2400 | |||
| Dec. 13.38875 | 2621.88875 | 1.91752 | Magellan 1/ClassicCam | 210 | |||
| Jan. 2.06488 | 2641.56488 | 21.59365 | Magellan 2/LDSS-2 | 24.93 0.17 | 300 | ||
| Jan. 2.08051 | 2641.58051 | 21.60928 | Magellan 2/LDSS-2 | 25.42 0.16 | 300 | ||
| Jan. 29.27962 | 2668.77962 | 48.80839 | WIYN/Minimosaic | 25.07 0.12 | 600 |
The data were preprocessed using standard techniques for bias and flat-field corrections. Photometry was performed by fitting a point-spread function using the DAOPhot II and AllStar software (Stetson, 1987; Stetson & Harris, 1988). The MMT and Magellan data were calibrated using secondary standard stars from the catalogue of Henden (2002). Each image was calibrated using all of the Henden (2002) secondary standards that could be photometered on that image. A weighted mean of the calibrated magnitudes of each of our detections of the secondary standards was used to determine the photometric zero point for each image. The colour terms in the calibrations were smaller than 5% and did not improve the quality of the calibrations. Therefore they were not applied to the photometry. The WIYN image from 2003 Jan. 29 was very deep, so the secondary standards of Henden (2002) that were in the field of view were saturated. Therefore the zero point for this image was determined by matching stars on the -band image obtained with the MMT on 2003 Dec. 12.
2.2 Infrared Photometry
Infrared imaging data were obtained on 2003 Dec. 12, and 13 UT using the Classic Camera’s NICMOS3 detector on the 6.5m Magellan 1 (Walter Baade) telescope at the Las Campanas Observatory. The gain was 7.5 e- ADU-1, the readout noise was 40 e- per pixel, and the plate scale was per pixel. A dithering sequence with steps of a few arcseconds was used for the individual images. The data were preprocessed in the standard way and the individual images were coadded to produce a final mean image for each epoch. The brightest and faintest % of the pixels at each location in the stack were rejected in order to eliminate cosmic rays and bad pixels that were missed in the preprocessing steps.
Several faint infrared standard stars from the lists of Persson et al. (1998) were observed on each night to determine the photometric zero points of our images. The standard star data were preprocessed in exactly the same manner as the programme data, and aperture photometry was performed on the individual images. The zero-point offset for each standard was computed for each observation of that standard, and a weighted mean zero point was computed from all of the standards in each filter on each night. We found no evidence for significant time evolution in the zero point over the course of a night. Colour terms do not improve the quality of the calibration, so they were not used.
3 Results
3.1 The Optical Light Curve
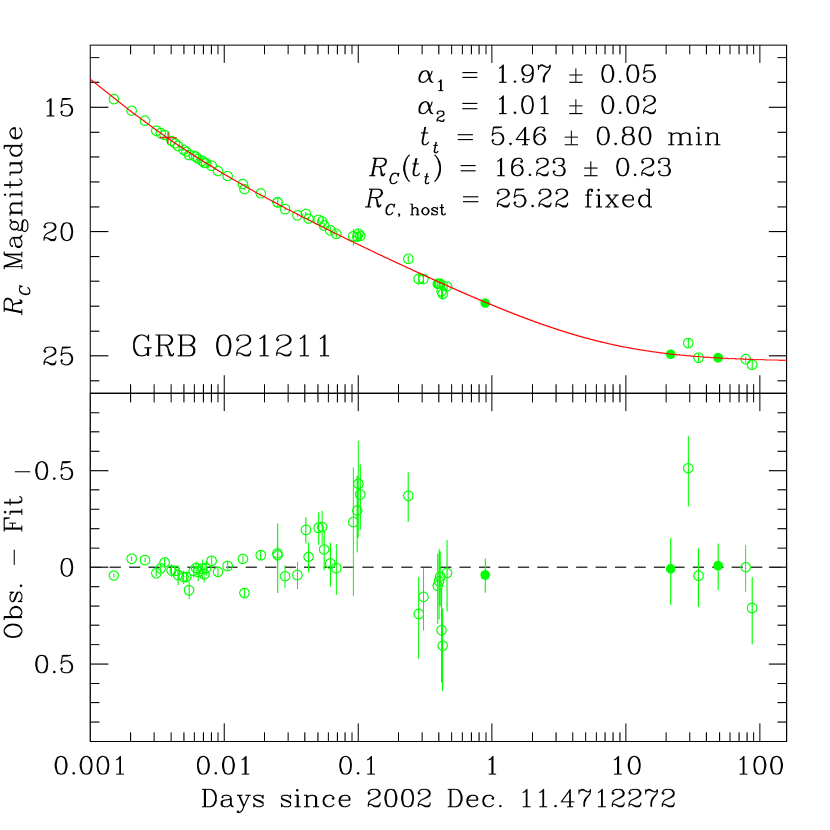
To parameterize the optical decay we combined our -band data with the published data from Fox et al. (2003), Li et al. (2003), Pandey et al. (2003), and Della Valle et al. (2003) (see Figure 2). We fit the data with a double power law of the form
| (1) |
where is the time of the transition from the first to the second power law component, is the flux density in the band at the time of the transition, is the magnitude of the host galaxy, and are the decay slopes before and after the transition respectively. The constant converts flux density to magnitude and is based on the zero points of Fukugita et al. (1995). This formalism assumes that there are two components to the light from the OA. Both components contribute to the total light and each component fades at different rates. We fit a double power law instead of a broken power law because the preferred interpretation of the early behaviour of the OA of GRB 021211 (catalog ) is a reverse shock. Therefore, the OA will contain contributions from both the reverse and forward shocks with the transition time indicating when the contribution from each was equal. A broken power law assumes that there was a sharp transition between the two decay rates. This is (approximately) valid for the transition from a relativistically beamed jet to a non-relativistically beamed jet, but it is not valid for the transition between the OA being dominated by a reverse and forward shock.
We fit Eq. 1 to all of the -band data for the first day. We did not include the supernova component in our fit since its contribution is negligible at these early times. The magnitude of the host galaxy was fixed at mag (Della Valle et al., 2003). Our best fit is shown in Figure 2. We find power law slopes of and ; a transition time of minutes; and a flux density at the transition of mJy, which corresponds to mag. The fit does not change if we allow the host magnitude to be a free parameter. In this case the best fit for is mag. Our fit is formally not good. The chi-square value is 162.1 for 45 degrees of freedom. Reducing this to would require that we have underestimated the errors in the magnitudes by a factor of approximately two. Since we have used multiple data sets it is possible that cross-calibration errors may be present. However, in Sect 3.3 we show that the large residuals are present in fits to individual data sets, so the large chi-square value that we find is not due cross-calibration errors.
The double power law does not include the effects of the synchrotron peak frequency, , moving through the optical. The is expected to happen at early times (–15 minutes). If did pass through the band at approximately the transition time between the forward and reverse shocks it will result in the best-fit slopes and transition time in Eq. 1 being incorrect.
Our late-time Magellan data is consistent with there being no variation in the -band magnitude of the host galaxy between 22 and 49 days after the burst. The only evidence for a supernova bump in the optical decay is the photometry of Della Valle et al. (2003), who find mag at 29 days after the burst, which is approximately 0.5 mag () brighter than the combined OA and host galaxy at that time. It should be noted, however, that the OA of GRB 030329 (catalog ) did not exhibit a strong rebrightening when SN2003dh (catalog ) was near its peak brightness. It is possible that the late-time OA of GRB 021211 (catalog ) behaved in a similar manner. This suggests that the lack of an optical bump may not indicate the lack of a supernova.
We find no evidence for a second break in the optical decay during the first day. Our -band photometry suggests that the decay between 21.2 and 45 hours was . This is steeper than the decay in the band during the first day and may indicate that a break occurred during this time. In § 4.2 we argue that the cooling break is most likely to be at -ray frequencies during this time, so we consider it very unlikely that this apparent steepening of the decay is due to the cooling frequency passing through the band. Therefore it is possible that we are seeing the jet break. However, the band flux density increased by % between 18 and 21.2 hours, so it is also possible that we are seeing a short-term fluctuation in the -band flux density (see § 3.3) and not a break in the decay.
3.2 The Spectral Energy Distribution
We combined our photometry with data drawn from the literature (Fox et al., 2003; Li et al., 2003; Pandey et al., 2003) to construct spectral energy distributions (SEDs) for the OA at several epochs. The optical and infrared magnitudes were converted to flux densities based on the zero points of Fukugita et al. (1995) and Allen (2000). Each data point was corrected for Galactic reddening but not for any reddening that may be present in the host galaxy, or in intergalactic space between us and the host.
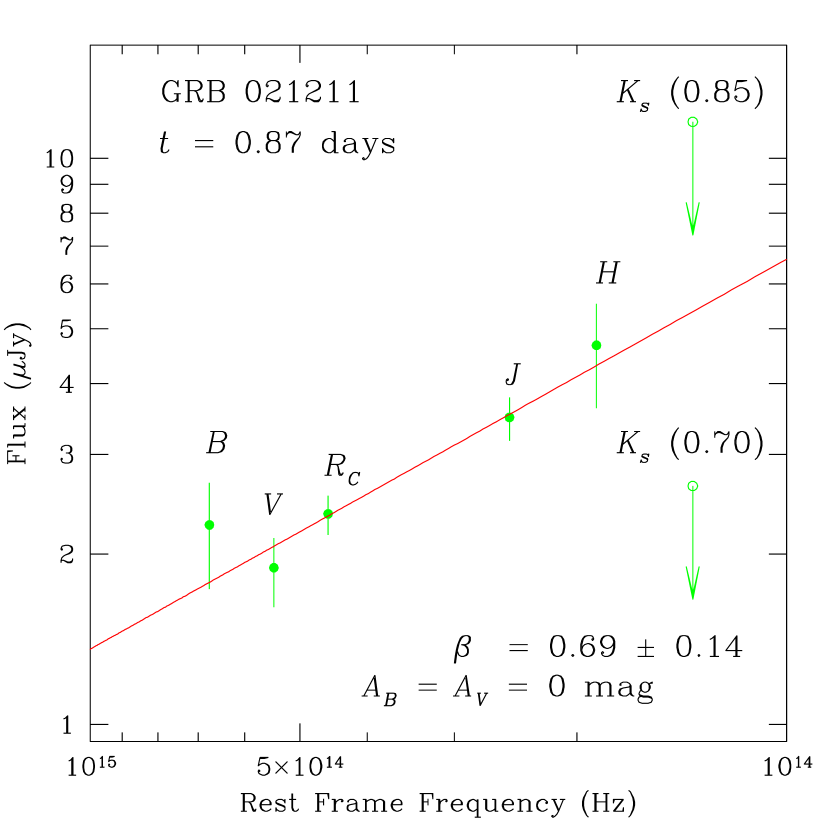
The SED was fit by , where is the flux density at frequency , is the intrinsic spectral index, and is the extragalactic extinction along the line of sight to the burst. The dependence of on has been parameterized in terms of the extinction in the rest-frame band, . We adopted the three extinction laws given by Pei (1992): the Milky Way (MW), the Large Magellanic Cloud (LMC), and the Small Magellanic Cloud (SMC). The fit provides and simultaneously for each of the assumed extinction laws. The unextincted case ( mag) was also considered.
There are enough data to estimate the amount of extinction only at 0.87 days after the burst. We find that our data are consistent with and mag in the host galaxy (). The three extinction laws of Pei (1992) do not provide a statistically better fit for any value of in the host than mag does. In addition, the lack of curvature in the spectrum after correction for Galactic extinction implies that there is very little extinction in the host galaxy along the line of sight to GRB 021211 (catalog ). Therefore we believe that there is negligible extinction affecting this OA in its host galaxy.
To test for dust along the line of sight between us and the host we repeated our fits allowing the redshift of the dust to be a free parameter. In these cases the best fits for each extinction law were for no dust at any redshift in the interval . Therefore, we conclude that the dim nature of the OA of GRB 021211 (catalog ) must be intrinsic to the burst itself and not the result of absorption along the line of sight to the burst.
3.3 Fluctuations in the Decay
Rapid variability has been seen in the early optical decay of several GRB afterglows. GRB 011211 (catalog ) showed fluctuation of approximately 15% over a period of 2.5 hours approximately twelve hours after the burst (Jakobsson et al., 2004; Holland et al., 2002). GRB 021004 (catalog ) exhibited rapid variations in flux density and colour approximately one day after the burst (Bersier et al., 2003; Matheson et al., 2003). Matheson et al. (2003) have also found rapid colour variations in the OA of GRB 030329 (catalog ) approximately 0.75 days after the burst. Figure 2 suggests that there may be small-scale variability in the -band decay of GRB 021211 (catalog ). The anomalous data point at 29 days may be due to light from a supernova (Della Valle et al., 2003), so we will only consider the optical decay before approximately one day after the burst. The residuals about our best-fitting double power law between approximately one minute and one day after the burst are not consistent with zero. We find that the probability of observing these residuals about a smooth decay by chance is . This is sufficient to rule out a smooth decay between approximately 1.5 minutes and one day after the burst. A synchrotron break passing through the band can produce a bump in the light curve similar to those seen during this time. However, it can not produce the multiple bumps that are observed. We can not rule out the possibility that some of the variation seen in the optical decay is due to the passage of the synchrotron break.
To test that this result is not due to a single data set, which would suggest that the fluctuations are an artifact of the data reduction, we computed the probability of observing the residuals about a smooth decay by chance for each data set. The Fox et al. (2003) data have a probability that the residuals were due to chance of . The Li et al. (2003) data have a probability that the residuals were due to chance of . The Pandey et al. (2003) data are consistent with random fluctuations about a smooth decay. It is not possible to determine if the systematic offset of +0.14 mag from the best-fitting smooth decay seen in the Pandey et al. (2003) data is real or an artifact of their data reduction. The offset is consistent with the fluctuations seen in the other data sets, so we have no reason to believe that it is not real.
The upper limit on the -band flux density at 0.70 days is 2.638 Jy ( mag). This is 2.729 Jy (0.77 mag) fainter than the flux density predicted by extending the fitted spectrum at 0.87 days to the band. This suggests that the infrared afterglow has brightened during this time. The -band flux density also appears to have brightened during this time. If the increase in the -band flux density is part of an achromatic fluctuation in the flux density then it predicts mag at 0.705 days. However, the upper limit is mag at this time. This suggests that the infrared fluctuations are not achromatic.
Pandey et al. (2003) report spectral slopes, corrected for Galactic reddening, at three epochs between 0.13 and 0.86 days after the burst. Their slopes are consistent with a constant spectral slope during this time of ( mag) at the 93% confidence level. At days Fox et al. (2003) find () after correcting for Galactic reddening. We find an intrinsic spectral slope of mag ( mag) at days. The only evidence for a change in colour are the data of Fox et al. (2003) who derived their spectral slope from - and -band photometry. When we combine our colour data with that in the literature (Fox et al., 2003; Li et al., 2003; Pandey et al., 2003) we find no evidence for a change in colour between 0.1 and 1.0 days. However, we note that there is too little published data to be able to make any strong statements about colour variations during this time.
4 Physics of the Burst
4.1 Energy Considerations
We computed the isotropic equivalent energy of GRB 021211 (catalog ) using the observed HETE-II fluences listed in Crew et al. (2003). We applied a cosmological correction (Bloom et al., 2001) to the energy in each band in order to correct it to the 20–2000 keV band then averaged the six results. The resulting -corrected isotropic equivalent energy is erg.
We find no evidence for a break in the optical decay due to beaming before approximately one day after the burst. However, Kumar & Panaitescu (2003) note that the radio flux density at 8.5 GHz at 10 days is a factor of 5.4 lower than expected. This discrepancy can be explained if a jet break occurred between one and ten days after the burst. If the steepening of the -band decay that we observe between 21.2 and 45 hours after the burst is due to a jet break then the time of the break is constrained to 0.89 and 1.87 days.
The opening angle of a GRB jet can be estimated using Rhoads (1999) and Sari et al. (1999). This requires a knowledge of the circumburst density, which is not well understood for GRB 021211 (catalog ). Detailed modeling by Kumar & Panaitescu (2003) implies cm-3. If we assume an efficiency of and a jet break between one and ten days the opening half-angle of the jet is . If the Kumar & Panaitescu (2003) density range is correct then GRB 021211 (catalog )’s jet has one of the smallest known half-opening angles. Even if the circumburst density is cm-3 the corresponding jet has at ten day after the burst. The beaming-corrected energies which correspond to the estimated range of jet angles are erg for and day, and erg for and days. These energies are approximately 5 to 400 smaller than the canonical value of Bloom et al. (2003). In order for GRB 021211 (catalog ) to have the canonical energy the jet half-opening angle needs to be . If this is correct then either the jet break will not occur until days after the burst or the ambient density exceeds cm-3. Both of these scenarios are unlikely so we believe that GRB 021211 (catalog ) may have been underluminous at gamma-ray energies.
4.2 The Cooling Frequency and Local Environment of GRB 021211
Most GRBs are well fit by relativistic fireball models with an electron index of –2.5 (van Paradijs et al., 2000). Panaitescu & Kumar (2002) present models for ten GRBs and find a mean electron index of with five GRBs having . This is problematic since electron indices of less than two represent infinite energy in the standard relativistic fireball model (Mészáros, 2002). This problem can be avoided by introducing an upper limit for the electron energy distribution (Dai & Cheng, 2001). Detailed modeling of the acceleration of particles in highly relativistic shocks predict an electron index of approximately 2.3 (Achterberg et al., 2001).
We estimate the electron index for GRB 021211 (catalog ) using the slope of the optical decay, and the spectral index, of GRB 021211 (catalog ) at 0.87 days. The optical decay has a slope of and the dereddened slope of the SED at optical wavelengths is (). We used the relationships of Sari et al. (1998) (for a homogeneous interstellar medium (ISM)) and Chevalier & Li (1999) (for a pre-existing stellar wind) to predict at this time. These predictions are listed in Table 2 for several stages of the evolution of a synchrotron emission spectrum.
| Case | Model | Environment | Comments | ||
|---|---|---|---|---|---|
| 1 | ISM | ||||
| 2 | Wind | ||||
| 3 | ISM | ||||
| 4 | Wind | ||||
| 5 | ISM | Rising spectrum | |||
| 6 | Wind | Rising spectrum | |||
| 7 | ISM | ||||
| 8 | Wind | ||||
| 9 | ISM | ||||
| 10 | Wind | ||||
| 11 | ISM | Rising spectrum | |||
| 12 | Wind | Rising spectrum |
Cases 5, 6, 11, and 12 can be ruled out because they predict a spectrum with an opposite slope to what is observed. Cases 9 and 10 can be ruled out because they predict that the optical decay has a slope of , which is not consistent with the observed slope. The SED at days is barely consistent () with a prediction of (cases 1, 2, 7, and 8) and (case 4). It is, however in good agreement with (case 3). This suggests that GRB 021211 (catalog ) was in the slow cooling regime with the synchrotron frequency, , below the optical and the cooling frequency, , above the optical 0.87 days after the burst.
This conclusion is supported by the detailed modelling of Kumar & Panaitescu (2003). They found that the early- and late-time optical data is consistent with a low-density, homogeneous external medium and inconsistent with a wind-stratified external medium. Our broad band spectral modelling supports this conclusion. However, we are unable to rule out the possibility that the burst expanded into a shocked wind, or into an environment where the equatorial wind is significantly stronger than the polar wind.
If the burst did expand into a homogeneous medium then the observed rate of decay of the OA at days () and case 3 of Table 2 implies that the electron index is and the intrinsic spectral slope at this time is . This is consistent with the dereddened spectral slope at this time () that we determined in § 3.2. Eq. 11 of Sari et al. (1998) implies that the cooling frequency at days in a homogeneous medium is Hz. For the case of a homogeneous ISM Kumar & Panaitescu (2003) find in the forward shock at 11 minutes and an environmental density of cm-3. Using these value we predict that the cooling frequency at days should be approximately Hz, which is in the high-energy regime (approximately 37–370 keV). However, the modeling of Kumar & Panaitescu (2003) suggests that decreases by a factor of two between eleven minutes and ten days after the burst, so locating the location of the cooling frequency is somewhat uncertain. Regardless, the Kumar & Panaitescu (2003) model is inconsistent with being near the optical at this time. Therefore, we do not believe that the cooling break moved through optical frequencies between 0.1 and 1.0 days after the burst.
The emerging picture of the evolution of this burst is a transition from the emission being dominated by the reverse shock to emission being dominated by the forward shock at approximately five minutes after the burst. The reverse shock has an optical decay of , the forward shock has an optical decay of and the spectral index of the forward shock photons is . The spectral and decay slopes imply that the electron index is and are consistent with the local environment dominated by a homogeneous ISM.
5 Discussion
5.1 A Comparison with GRB 990123
The overall shape of the optical decay of GRB 021211 (catalog ) appears to be very similar to that of GRB 990123 (catalog ) (e.g., Holland et al. 2000). To quantify this we fit Eq. 1 to the early-time -band data from Fruchter et al. (1999) and the data used by Holland et al. (2000). The best fit occurs with power law slopes of and , a transition time of minutes, and an -band magnitude at transition of mag. The goodness of fit was . The magnitude of the host was fixed at mag (Holland et al., 2000) since we are interested in determining the slopes and transition time under the assumption that there are two mechanisms (the forward and reverse shocks) contributing to the flux, not the magnitude of the host.
The OA of GRB 990123 (catalog ) made the transition from being dominated by the reverse shock to being dominated by the forward shock faster than the OA of GRB 021211 (catalog ) did. The rest-frame transition times are 2.7 minutes for GRB 021211 (catalog ) and 0.5 minutes for GRB 990123 (catalog ). However, this difference may be nothing more than an artifact of the data. The GRB 990123 (catalog ) data consists of 26 data points from several sources, so there may be a systematic offsets in the photometric calibrations. If we force the GRB 990123 (catalog ) fit to have a rest-frame transition time of 2.7 minutes (the same as GRB 021211 (catalog ) does) then the best fit double power law has and with a goodness of fit of . This is only marginally worse than the best fit with the transition time is a free parameter and the decay slopes are only different from the fit to the GRB 021211 (catalog ) data. This suggests that the overall temporal evolution of the optical decays of both bursts was the same to within the limitations of the data.
These two OAs differ in that GRB 021211 (catalog ) shows strong evidence for rapid variations about a power law decay during the first day while GRB 990123 (catalog ) exhibits no variations (Holland et al., 2000). This may be an artifact of the sampling rate of the GRB 990123 (catalog ) data, or cross-calibration issues. However, f the smooth optical decay of GRB 990123 (catalog ) is real then it may indicate that the circumburst medium around GRB 990123 (catalog ) is smoother than that around GRB 021211 (catalog ) (Wang & Loeb, 2000). Alternately, GRB 021211 (catalog ) may have had additional energy added via refreshed shocks (Panaitescu et al., 1998) while GRB 990123 (catalog ) did not.
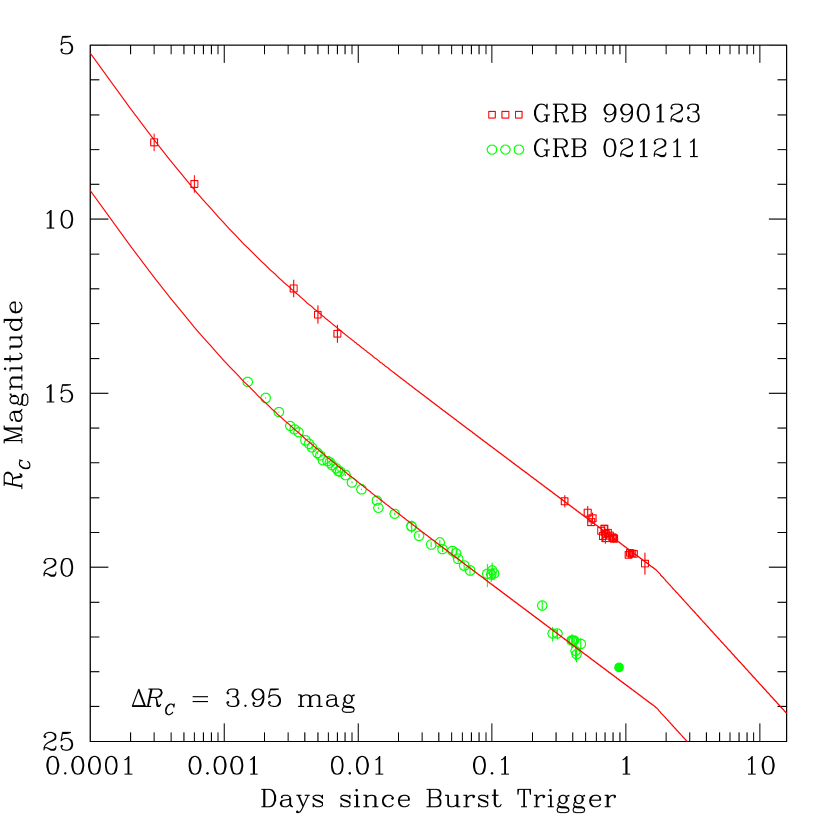
Figure 4 shows the -band data for GRB 990123 (catalog ) with the best-fitting double power law superimposed. The poor temporal coverage of the data makes it difficult to determine the transition time. This Figure also shows the -band data for GRB 021211 (catalog ) with the fit for GRB 990123 (catalog ) superimposed. With the exception of the short-timescale fluctuations the shape of the GRB 990123 (catalog ) fit is in good agreement the optical decay of GRB 021211 (catalog ). The data for GRB 990123 (catalog ) has been adjusted to correct for the difference in redshift between the two GRBs. The fluxes with shifted to match the observed band of GRB 021211 (catalog ) by assuming a power law spectrum with (Holland et al., 2000) for GRB 990123 (catalog ). Next the difference in distance modulus ( mag) was applied. Finally, a correction was applied to compensate for the difference in redshift between the two bursts. After these effects had been taken into account the OA of GRB 021211 (catalog ) was 3.95 mag fainter than the OA of GRB 990123 (catalog ), which corresponds to a difference in intrinsic luminosity of 38 times. Except for the small-timescale fluctuations this difference is approximately constant between approximately 90 seconds and one day after the burst.
The spectra of these two OAs are similar. Holland et al. (2000) used broadband photometry to find for GRB 990123 (catalog ) between zero and three days after the burst. This is almost identical to the value for GRB 021211 (catalog ). Andersen et al. (1999) found from a spectrum taken 48 minutes after the burst. The similarity in the spectra of the two bursts implies that they had similar electron indices.
5.2 The Host Galaxy
The location of the OA in our 2003 Jan. 29 UT WIYN image was determined by a comparison with HST/ACS/WFC images taken on 2003 Dec. 24/25 UT (Fruchter et al., 2002). Our late-time image has a point source with mag at the location of the OA. Fruchter et al. (2002) find that this source is resolved with an intrinsic full width at half maximum of ( proper kpc) once the point-spread function of the ACS is removed. This is beyond the ability of WIYN to resolve so it appears as a point source in our data. The HST/ACS/WFC data give an AB magnitude in the F606W filter of mag, which corresponds to mag. We find mag at days after the burst and mag at 48.8 days.
The colour of the afterglow at days is mag, after correcting for Galactic reddening, which corresponds to a spectral slope of . The data in de Vaucouleurs et al. (1991) suggest that the spectral slope of the Small Magellanic Cloud (SMC) at near-ultraviolet wavelengths is . This is consistent with the observed colour of the OA at similar rest-frame wavelengths 21.6 days after the burst.
However, Della Valle et al. (2003) showed that the OA has a supernova component that reached its maximum light at days after the burst. They find that, at this time, the host and the supernova contribute approximately equally to the light while the OA contributes less than approximately 5% of the light. Their best estimate of the host magnitude is mag. The corresponding absolute rest-frame magnitude of the host is mag.
Lilly et al. (1995) find a typical magnitude of mag for blue galaxies at if . For our adopted cosmology this corresponds to mag. If we assume that the host galaxy has a power-law spectrum with (as implied by the colour of the afterglow at days) then the rest-frame -band luminosity is where is the rest-frame -band luminosity of a typical blue galaxy at . Therefore the host of GRB 021211 (catalog ) appears to be subluminous. This is consistent with Hogg & Fruchter (1999) who found that GRB host galaxies tend to be subluminous. Our comparison of the total -band luminosity of the host to is somewhat uncertain since is highly correlated with the slope of the faint end of the galaxy luminosity function as well as with its normalization (Lilly et al., 1995).
At a redshift of a rest-frame wavelength of 2800 Å corresponds to the observer’s band. Therefore we are able to use Eq. 2 of (Madau et al., 1998) to estimate the integrated star formation rate in host galaxy from the rest-frame continuum flux at 2800 Å. We find a star-formation rate of . This calculation depends on the details of the initial mass function, and it assumes that there is no extinction in the host galaxy. We know from the observed SED of the OA (see Sect. 3.2) that there is negligible extinction in the host along the line of sight to the burst. However we do not know what level of extinction is present in the rest of the host. Therefore we estimate that the integrated star-formation rate in the host galaxy of GRB 021211 (catalog ) is .
The specific star-formation rate per unit blue luminosity of the host galaxy of GRB 021211 (catalog ), if we ignore extinction within the host, is , which is similar to that of other GRB host galaxies. Our imaging data do not have high enough resolution to determine morphological properties of the host. That will require HST imaging of the host after the OA has faded. However the early HST/ACS imaging of Fruchter et al. (2002) suggests that the host has a diameter of proper kpc. This implies a star-formation rate density of in the host. This is at the low end of the range of values (1–1000 ) that characterize a starburst galaxy (Kennicutt, 1998).
6 Conclusions
We present photometry of the OA of GRB021211 (catalog ) taken at the Magellan, MMT, and WIYN observatories. These data were taken between 0.7 and 50 days after the burst. The broad-band optical/infrared SED yields an intrinsic spectral slope of at 0.87 days after the burst and we find no evidence for colour evolution in the optical between 0.1 and 1.0 days. There is weak evidence for brightness fluctuations in the and bands approximately 0.7 days after the burst. We find no evidence for extragalactic extinction along the line of sight to the burst. The optical light is dominated by power law decay with an index of 1.97 until 5.46 minutes after the burst. After this time the decay is dominated by a power law with an index of 1.01. This is consistent with the early time flux being dominated by a reverse shock and a transition to domination by the forward shock 5.46 minutes after the burst.
There is evidence for rapid fluctuations in the flux about the smooth power-law decay similar to what has been seen in GRB 011211 (catalog ) (Holland et al., 2002), GRB 021004 (catalog ) (Bersier et al., 2003; Matheson et al., 2003), and GRB 030329 (catalog ) (Matheson et al., 2003). These fluctuations may also include colour variations, but there is insufficient data to determine this is a convincing way.
The spectral slope has been combined with the observed -band optical decay to determine that the shocked electrons are probably in the slow cooling regime with an electron index of , and that the burst probably occurred in a homogeneous ISM. There is weak evidence for a jet break between 0.89 and 1.87 days after the burst, and (Kumar & Panaitescu, 2003) suggest that the jet break may have occurred before ten days based on the radio flux at 8.5 GHz. If the jet break did occur before ten days then the half-opening angle of the jet is , which is one of the smallest opening angles of any GRB jet (Bloom et al., 2003). These angles imply that the total gamma-ray energy in the burst was erg erg, which is much less than the canonical value of Bloom et al. (2003) yet similar to that inferred from the first jet break in GRB 030329 (catalog ). This suggests that most of the energy in GRB 021211 (catalog ) may be not be in the OA, but in a different component such as a frozen in magnetic field (cf Kumar & Panaitescu 2003), kinetic energy in the supernova ejecta, or a second jet component.
The optical decay of GRB 021211 (catalog ) during the first day after the burst was very similar to that of GRB 90123 (catalog ), only the OA of GRB 021211 (catalog ) was instrinsically times fainter. Both OAs had an initial steep decline with a power law index of . This is consistent with the OA being dominated by emission from a reverse during the first few minutes after the burst. The OA of GRB 990123 (catalog ) made the transition from being dominated by the light from the reverse shock to being dominated by the light from the forward shock minutes after the burst (0.5 minutes in the rest frame of GRB 990123 (catalog )). The transition occurred at minutes for GRB 021211 (catalog ) (2.7 minutes in the rest frame). After the transition each OA is dominated by forward shock emission with decay indices of . The similarity in the decays of these two OAs suggests that the environments and physics of GRB 990123 (catalog ) and GRB 021211 (catalog ) were similar.
The rapid localization of GRB 021211 (catalog ) and the near-continuous monitoring of its OA during the first day after the burst occurred has allowed the early time evolution of this burst to be studied in detail. This detailed coverage of the optical decay has made it possible to recognize the similarity between GRB 021211 (catalog ) and GRB 990123 (catalog ). The OA of this burst faded very rapidly for the first several minutes, and had the initial afterglow searches been delayed by even one hour the OA would have been mag fainter. It is questionable whether or not the OA would have been discovered in that case. If the OA had not been detected rapidly this would have been classified as a dark burst. Further, without the prompt discovery of the OA the rapid early time decay would not have been identified. Unfortunately there is very little data for the period between one and 20 days after the burst, so it is not possible to determine when the jet break occurred. Daily monitoring of OAs during the first few weeks will be possible using the the Ultraviolet/Optical Telescope on the upcoming Swift mission. This will monitoring will make it much less likely that critical periods of the decay, such as the jet break, will be missed for bursts that occur during the Swift era.
References
- Achterberg et al. (2001) Achterberg, A., Gallant, Y. A., Kirk, J. G., & Guthmann, A. W. 2001, MNRAS, 328, 393
- Allen (2000) Allen, C. W. 2000, Astrophysical Quantities, 4th edition, 2000, ed. A. N. Cox.
- Andersen et al. (1999) Andersen, M. I., Castro-Tirado, A. J., Hjorth, J., Møller, P., Pedersen, H., Caon, N., Cairos, L. M., Korhonen, H., et al. 1999, Science, 283, 2075
- Bersier et al. (2003) Bersier, D., Stanek, K. .Z., Winn, J. N., Grav, T., Holman, M. J., Matheson, T., Mochejska, B., Steeghs, D., et al. 2003, ApJ, 584 L43
- Bloom et al. (2003) Bloom, J. S., Frail, D. A., & Kulkarni, S. R. 2003, ApJ, 594, 674
- Bloom et al. (2002) Bloom, J. S., Kulkarni, S. R., & Djorgovski, S. G. 2003, AJ, 123, 111
- Bloom et al. (2001) Bloom, J. S., Frail, D. A., & Sari, R. 2001, AJ, 121, 2879
- Chevalier & Li (1999) Chevalier, R. A., & Li, Z.-Y. 1999, ApJ, 520, L29
- Costa et al. (1997) Costa, E., Frontera, F., Heise, J., Feroci, M., in ’t Zand, J., Fiore, F., Cinti, M. N., dal Fiume, D., et al. 1997, Nature, 387, 783
- Crew et al. (2003) Crew, G., Lamb, D. Q., Ricker, G. R., Atteia, J.-L., Kawai, N., Vanderspek, R., Villasenor, R., Doty, J., et al. 2003, ApJ, 599, 387
- Crew et al. (2002) Crew, G., Villasenor, R., Vanderspek, R., Doty, J., Monnelly, G., Butler, N., Cline, T., Jerigan, J. G., et al. 2002, GCNC 1734
- Dai & Cheng (2001) Dai, Z. G., & Cheng, K. S. 2001, ApJ, 558, L109
- Della Valle et al. (2003) Della Valle, M., Malesani, D., Benetti, S., Testa, V., Hamuy, M., Antonelli, L. A., Chincarini, G., Cocozza, G., et al. 2003, A&A, 406, L33
- Della Valle et al. (2003) Della Valle, M., Benetti, S., Malesani, D., Mason, E., Antonelli, L. A., Cocozza, G., Covino, S., Fugazza, D., et al. 2003, GCNC 1809
- de Vaucouleurs et al. (1991) de Vaucouleurs, G., de Vaucouleurs, A., Corwin Jr., H. G., Buta, R. J., Paturel, G., & Fouqué, P. 1991, Third Reference Catalogue of Bright Galaxies
- Fox et al. (2003) Fox, D. W., Price, P. A., Soderberg, A. M., Berger, E., Kulkarni, S. R., Sari, R., Frail, D. A., Harrison, F. A., et al. 2003, ApJ, 586, L5
- Frail et al. (2001) Frail, D. A., Kulkarni, S. R., Sari, R., Djorgovski, S. G., Bloom, J. S., Galama, T. J., Reichart, D. E., Derger, E., et al. 2001, ApJ, 562, L55
- Fruchter et al. (2002) Fruchter, A., Levan, A., Vreeswijk, P., Holland, S. T., & Kouveliotou, C. 2002, GCNC 1781
- Fruchter et al. (1999) Fruchter, A. S., Thorsett, S. E., Metzger, M. R., Sahu, K. C., Petro, L., Livio, M., Ferguson, H., Pian, E., et al. (1999), ApJ, 519, L13
- Fukugita et al. (1995) Fukugita, M., Shimasaku, K., & Ichikawa, T. 1995, PASP, 107, 945
- Groot et al. (1997) Groot, P. J., Galama, T. J., van Paradijs, J., Strom, R., Telting, J., Rutten, R. G. M., Pettini, M., Tanvir, N., et al. 1997, IAUC, 6584
- Henden (2002) Henden, A. 2002, GCNC 1753
- Hjorth et al. (2003) Hjorth, J., Sollerman, J., Møller, P., Fynbo, J. P. U., Woosley, S. E., Kouveliotou, C., Tanvir, N. R., Greiner, J., et al. 2003, Nature, 423, 847
- Hogg & Fruchter (1999) Hogg, D. W., & Fruchter, A. S. 1999, ApJ, 520, 54
- Holland et al. (2002) Holland, S. T., Soszynski, I., Gladders, M. D., Barrientos, L. F., Berlind, P., Bersier, D., Garnavich, P. M., Jha, S., et al. 2002, AJ, 124, 639
- Holland et al. (2000) Holland, S. T., Björnsson, G., Hjorth, J., & Thomsen, B. 2000, A&A, 364, 467
- Jakobsson et al. (2004) Jakobsson, P., Hjorth, J., Ramirez-Ruiz, E, Kouveliotou, C., Pedersen, K., Fynbo, J. P. U., Gorosabel, J., Watson, D., et al. 2004, New Astronomy, 9, 435
- Kennicutt (1998) Kennicutt, R. C. 1998, ARA&A, 36, 189
- Kouveliotou et al. (1993) Kouveliotou, C., Meegan, C. A., Fishman, G. J., Bhat, N. P., Briggs, M. S., Koshut, T. M., Paciesas, W. S., & Pendleton, G. N. 1993, ApJ, 413, L101
- Kumar & Panaitescu (2003) Kumar, P., & Panaitescu, A. 2003, MNRAS, 346, 905
- Li et al. (2003) Li, W., Filippenko, A. V., Chornock, R., & Jha, S. 2003, ApJ, 586, L9
- Lilly et al. (1995) Lilly, S. J., Tress, L., Hammer, F., Crampton, D., & Le Fèvre, O. 1995, ApJ, 455, 108
- Madau et al. (1998) Madau, P., Pozzetti, L., & Dickinson, M. 1998, ApJ, 498, 106
- Matheson et al. (2003) Matheson, T., Garnavich, P. M., Foltz, C., West, S., Williams, G., Falco, E., Calkins,M. L., Castander, F. J., et al. 2003, ApJ, 582, L5
- Matheson et al. (2003) Matheson, T., Garnavich, P. M., Stanek, K. Z., Bersier, D., Holland, S. T., Krisciunas, K., Caldwell, N., Berlind, P., et al. 2003, ApJ, 599, 394
- Mészáros (2002) Mészáros, P. 2002 ARA&A, 40, 137
- Metzger et al. (1997) Metzger, M. R., Djorgovski, S. G., Kulkarni, S. R., Steidel, C. C., Adelberger, K. L., Frail, D. A., Costa, E., Frontera, F., et al. 1997, Nature, 387, 878
- Panaitescu & Kumar (2004) Panaitescu, A., & Kumar, P. 2004, MNRAS, in press, astro-ph/0406027
- Panaitescu & Kumar (2002) Panaitescu, A., & Kumar, P. 2002, ApJ, 571, 779
- Pandey et al. (2003) Pandey, S. B., Anupama, G. C., Sagar, R., Bhattacharya, D., Castro-Tirado, A. J., Sahu, D. K., Parihar, P., & Prabhu, T. P. 2003, A&A, 408, L21
- Panaitescu et al. (1998) Panaitescu, A., Mészáros, P., & Rees, M. J. 1998, ApJ, 503, 314
- Park et al. (2002) Park, H. S., Williams, G., & Barthelmy, S. 2002, GCNC 1736
- Pei (1992) Pei, Y. C. 1992, ApJ, 395, L30
- Persson et al. (1998) Persson, S. E., Murphy, D. C., Krzeminski, W., Roth, M., & Rieke, M. J. 1998, AJ, 116, 2475
- Rhoads (1999) Rhoads, J. E. 1999, ApJ, 525, 737
- Sari et al. (1998) Sari, R., Piran, T., & Narayan, R. 1998, ApJ, 497, L17
- Sari et al. (1999) Sari, R., Piran, T., & Halpern, J. P. 1999, ApJ, 519, L17
- Schlegel et al. (1998) Schlegel, D. J., Finkbeiner, D. P., & Davis, M. 1998, ApJ, 500, 525
- Stanek et al. (2003) Stanek, K. Z., Matheson, T., Garnavich, P. M., Martini, P., Berlind, P., Caldwell, N., Challis, P., Brown, W. R., et al. 2003, ApJ, 591, L17
- Stetson (1987) Stetson, P. B. 1987, PASP, 99, 191
- Stetson & Harris (1988) Stetson, P. B., & Harris, W. E. 1988, AJ, 96, 909
- van Paradijs et al. (2000) van Paradijs, J., Kouveliotou, C., & Wijers, R. A. M. J. 2000, ARA&A, 38, 379
- van Paradijs et al. (1997) van Paradijs, J., Groot, P. J., Galama, T., Kouveliotou, C., Strom, R. G., Telting, J., Rutten, R. G. M., Fishman, G. J., et al. 1997, Nature, 386, 686
- Wang & Loeb (2000) Wang, X., & Loeb, A. 2000, ApJ, 535, 788
- Wei (2003) Wei, D. M. 2003, A&A, 402, L9
- Wozniak et al. (2002) Wozniak, P., Vestrand, W. T., Starr, D., Wren, J., Borozdin, K., Brumby, S., Casperson, D., Galassi, M., et al. 2002, GCNC 1757