Observations of Water Vapor Outflow from NML Cygnus
Abstract
We report new observations of the far infrared and submillimeter water vapor emission of NML Cygnus based on data gathered with the Infrared Space Observatory and the Submillimeter Wave Astronomy Satellite. We compare the emission from NML Cyg to that previously published for VY CMa and W Hya in an attempt to establish the validity of recently proposed models for the outflow from evolved stars. The data obtained support the contention by Ivezić & Elitzur (1995, 1997) that the atmospheres of evolved stars obey a set of scaling laws in which the optical depth of the outflow is the single most significant scaling parameter, affecting both the radiative transfer and the dynamics of the outflow. Specifically, we provide observations comparing the water vapor emission from NML Cyg, VY CMa and W Hya, and find, to the extent permitted by the quality of our data, that the results are in reasonable agreement with a model developed by Zubko & Elitzur (2000). Using this model we derive a mass loss based on the dust opacities, spectral line fluxes, and outflow velocities of water vapor observed in the atmospheres of these oxygen-rich giants. For VY CMa and NML Cyg we also obtain an estimate of the stellar mass.
Subject headings:
circumstellar matter – infrared: stars – stars: mass loss – stars: winds, outflows – stars: individual (NML Cygnus, VY Canis Majoris, W Hydrae)1. Introduction
NML Cyg, also designated IRC+10448, has been studied extensively since its discovery four decades ago in the near infrared sky survey conducted by Neugebauer, Martz & Leighton (1965). Though the star is quite faint at visual wavelengths, it is enormously luminous in the infrared. Morris and Jura (1983) associated this star with the Cyg OB2 association, which placed the star at kpc and defined its luminosity as . These authors concluded that the star has a mass of and a minimum mass loss of yr-1, indicated by the dense dust shell surrounding the star. The star exhibits significant variability in the infrared. Monnier et al (1997) report flux variations of mag in the N band at 10.2 m with an irregular period around 940 days.
Using speckle interferometry in the near infrared in the K, L, and M bands, Ridgway et al. (1986) estimated the optical depth at 3.4m to be 2.4 and derived an inner radius of the dust shell of arcsec, where they estimated the dust temperature to be K. Through an extensive de-reddening analysis these authors also found consistency with the previously proposed spectral type M6 III (Wing, Spinrad & Kuhi, 1967) and concluded that the star’s effective temperature is K. More recently, Monnier et al. (1997) conducted long baseline interferometry at 11m and modeled the dust outflow in somewhat greater detail, obtaining better fits to all gathered data by assuming a stellar effective temperature of only K.
The star’s line of sight velocity relative to the local standard of rest is approximately known. Cohen, et al (1987) investigated the 1612 MHz OH-maser emission from NML Cyg. They found the distribution among the many individual maser features they were able to resolve at 0.06 km s-1 to be double peaked with peaks centered roughly at a velocity with respect to the local standard of rest km s-1, suggesting that the central star’s line of sight velocity is close to zero. These authors assumed the star to lie at a distance of 2 kpc, which placed the radius of the maser emitting shell around cm from the star. The star’s radius, based on its color temperature and luminosity at that distance, was then times smaller, cm. Diamond, Norris and Booth (1984), who extended these OH observations, confirmed a similar stellar velocity.
A similar study concentrating on the water vapor masers associated with outflow from NML Cyg by Richards et al. (1996) shows a rather different picture, exhibiting a strong component at km s-1, with no other emission besides a hint of a second feature at km s-1. This asymmetry is explained by the authors as due to a collimated outflow close to the star at an angular distance of mas. This outflow, they conjecture, gradually becomes less collimated at a larger distance of order a few arcseconds, where the OH 1612 MHz masers are observed. Observations carried out at several epochs indicate proper motion of order 20 km s-1, assuming a distance of 2 kpc. This would be consistent both with the radial velocity of the OH maser peaks and the approaching velocity of the H2O maser emission.
A paper by Danchi et al. (2001) reports on the dust distribution interferometrically measured at 11m in the infrared. They conclude that there are two distinct dust shells, both of which have moved away from the star by approximately the same distance over a period of yr. Their separation suggests that they were formed yr apart. If the transverse outflow is comparable to the radial velocities of the masers, these authors favor a distance to the star of pc, rather than 2 kpc, preferred by Richards et al. (1996).
The dust emission measured by Danchi et al. (2001) peaks at roughly mas from the star but is distributed rather broadly over distances from to mas. Determining a displacement of only mas of the diffuse dust outflow, measured over the span of only 6 yr, appears to us to be a more difficult observation than measuring the angular displacement of the more compact H2O masers over a period of yr, with quite small error bars. For purposes of our current paper, we therefore assume the distance of 2 kpc for NML Cyg, suggested by Richards et al. (1996).
Boboltz & Marvel (2000) have examined the SiO maser emission around the star with the Very Long Baseline Array. They find that the masers form a roughly elliptical ring around the star, with dimensions by cm. The maser velocity distribution together with the spatial distribution led these authors to conclude that the SiO maser shell rotates with a velocity km s-1, about a systemic velocity of km s-1. While it is difficult to see how such a high rotational velocity could be induced at such a large distance from the star, a comparable system velocity emerges from consideration only of the double-peaked distribution of maser velocities, with peaks at and km s-1, averaging out to km s-1.
The star’s velocity can also be derived from its thermal SiO emission. This has a roughly parabolic spectral form, suggesting spherically symmetric outflow. Lucas et al, (1992) found that the peak emission occurs at about -5 km s-1, and the mean emission velocity is about -1 km s-1. These authors also determined the radius at the half power point for SiO emission to lie at cm, well beyond the SiO maser emitting region but also well inside the shell of OH masers. They derived a mass loss of order for the star, somewhat higher, but not at significant variance with the estimates of Morris and Jura (1983).
Many of these properties of NML Cyg are summarized in Table 1, where comparative values for two other oxygen-rich stars, VY Canis Majoris and W Hydrae, can also be found.
| Table 1. Characteristics of VY CMa, W Hydrae & NML Cyg | |||
|---|---|---|---|
| Star | VY CMa a | W Hydraeb | NML Cyg |
| Star’s Distance (pc) | 1500 | 115 | 2000b |
| Star’s Luminosity () | 11,050 | ||
| Star’s Temperature (K) | 2800 | 2500 | 2500 d |
| Star’s Radius (cm) | |||
| Final Outflow Velocity (km s-1) | 20 | 10 | |
| Optical Depth | 0.83 at 5500Å | at mb | |
| Gas-to-dust ratio | 850 | ||
| Mass loss rate yr-1 | |||
| a Data from Neufeld et al. (1996) and Barlow et al. (1996) | |||
| b For sources of data see text | |||
| c NML Cyg data, this paper | |||
| d Model of Monnier et al. (1997) | |||
| e optical depth in the J band | |||
Since NML Cyg is one of the most luminous sources in the northern sky it was extensively used as a calibration source for the Short Wavelength Spectrometer (SWS) Fabry-Perot (F-P) mode, during the Infrared Space Observatory (ISO) mission. Some of the spectral data reported here were obtained as part of these calibration procedures. On ISO the star was also studied as part of several dedicated programs aimed at understanding the atmospheres of evolved oxygen-rich stars. One of these programs concentrated on detecting the water vapor emission from such stars with the aid of the Submillimeter Wave Astronomy Satellite (SWAS) as well as with SWS and the Long Wavelength Spectrometer (LWS) on ISO. ISO data were, respectively, obtained for W Hya by Barlow et al. (1996) and Neufeld et al. (1996), and for VY CMa by Neufeld et al. (1996, 1999), while SWAS data for these two stars were published by Harwit & Bergin (2002). Taken together, these data tended to support the theoretical models for the atmospheres and outflow from oxygen rich stars developed by Ivezić and Elitzur (1995, 1997) and Zubko & Elitzur (2000).
Section 2 of the present paper reports water vapor observations obtained with ISO. Section 3 reports similar observations obtained with SWAS. Section 4 briefly describes the theoretical models for stellar outflow devised by Zubko & Elitzur (2000). Section 5 makes use of their model to obtain a mass-loss rate for NML Cyg. Section 6 compares the observed water-vapor line strengths to those that the model predicts. Section 7 discusses some apparent discrepancies in the data and attempts to plausibly account for them. In section 8 we discuss the balance between gravitational attraction and repulsion by light pressure, which may account for some of the apparent anomalies in outflow velocities and mass-loss rates.
2. H2O Observations with ISO
Early water vapor observations of NML Cyg were obtained by Justtanont et al. (1996) who used the SWS in grating mode and, in addition to other spectral features, detected rovibrational transitions of H2O at 2.7 and 6.2 m and 9 pure rotational lines of the molecule between 36 to 45 m. The resolving power of the grating was of order 680 at 30m — insufficient to clearly determine line shapes. From continuum observations and an assumed outflow velocity of 27.7 km s-1 these authors estimated a dust mass loss of yr-1, which translates into an overall mass loss of yr-1 for a dust-to-gas mass ratio of 100.
The ISO observations cited in the present paper were carried out with the telescope pointed at 20h46m25.46s, +40∘ 6’ 59.6” (J 2000). With the SWS/F-P, water vapor features were obtained at a spectral resolving power of . Most of these mid-infrared lines emanate from high-lying energy levels of H2O and consistently exhibit P Cygni profiles, clearly seen at the higher spectral resolution of the Fabry-Perot instrument. The line shapes are consistent with the assumption that the lines are emitted close to the star where the stellar outflow is still at a high temperature, and that cooler H2O, moving at considerably higher outflow velocities at greater distances from the star, absorbs much of the emitted light. Figure 1 shows several of the spectral lines registered with the SWS/F-P, and shows the line fits that we adopted.
At a resolving power of 30,000 the SWS/F-P emission lines are well resolved. In order to recover the emission line strength before self-absorption by cool water vapor in the outer parts of the outflow, we assumed that the source spectrum consists of a continuum flux plus a parabolic emission feature for the range , where is the line of sight velocity of the star and is the expansion velocity in the emitting region. This velocity is expected to be different for different emission lines, and provides information on the expansion velocity in different temperature regimes.
We then fitted the parabola convolved with the instrument profile to most closely replicate the portion of the emission feature on the long-wavelength side of the peak. Since this portion of the emission line should be least affected by self-absorption in an accelerating outflow, this procedure permitted us to restore the emitted flux on the short wavelength side of the emission peak and estimate the total emitted flux. These steps tended to increase the line flux by 20 to 30% relative to the directly measured emission component in the P Cygni profiles. To fully simulate the P Cygni profile, we further postulated a constant fractional absorption over some velocity range to applied to the continuum plus fully restored parabolic emission. All three parameters, , and were allowed to be free. For a given value of we selected to give the best fit to the short-wavelength side of the absorption feature and chose to give the best fit to the short-wavelength side of the emission feature and the long-wavelength side of the absorption feature. Between these three parameters we generally obtained a good fit. The peaks of the emission lines tend to fall around . We find to be of order km s-1 for most of our fits, while the star’s line of sight velocity with respect to the local standard of rest is taken to be km s-1. Such a high value for is somewhat surprising, as discussed in Section 7, below.
The P Cygni profiles in the mid-infrared water vapor features of NML Cyg are consistent with similar profiles observed in VY CMa (Neufeld et al., 1999), while the same lines observed by Neufeld et al. (1996) in W Hya show no self-absorption, indicating a significantly lower column depth in the star’s cool outer layers.
The spectral lines observed by the LWS/F-P were obtained at a spectral resolving power of . These lines involve lower-lying energy states emitted by cooler gas at greater distances from the star, and exhibit no noticeable self absorption. Presumably this is due to their emission in the more tenuous outer regions of the outflow where self-absorption is less likely. Figure 2, shows four emission lines obtained with the LWS/F-P. The data were reduced with the ISO LWS/F-P interactive data reduction program. At 95 m the resolving power of the instrument is and gradually declines to about at 125 m.
To obtain these data we repeatedly stepped the LWS Fabry-Perot instrument through a wavelength range that spanned roughly 7 to 8 steps on either side of the line which generally encompassed another 4 to 6 steps. These roughly 20 to 22 steps were equally spaced. Each step was displaced approximately half a spectral resolution element or km s-1 from the previous step. The entire spectral range was stepped through repeatedly in what was designated as the “rapid-scanning mode” of operation. In reducing the data, a sloping spectral base line was subtracted. The reduced spectra are shown in Figure 2. The best-fit spectral peak is displaced to shorter wavelengths relative to the laboratory values, with a consistent velocity displacement of km s-1, in good agreement with the SWS/F-P values. Full widths at half maximum range from to km s-1. Because the spectral resolving power in this wavelength range, km s-1, is comparable to the observed line widths, and significantly broader than the spectral velocity resolution of the SWS spectra or the SWAS spectra reported in Section 3, we fitted the observed emission features with a single Gaussian shape plus a baseline, a choice primarily determined by the Fabry-Perot transmission function. This line fit exhibits broader wings than a parabolic fit might suggest, but appears more appropriate under the circumstances and, in any case, does not significantly affect the results we report.
3. H2O Observations with SWAS
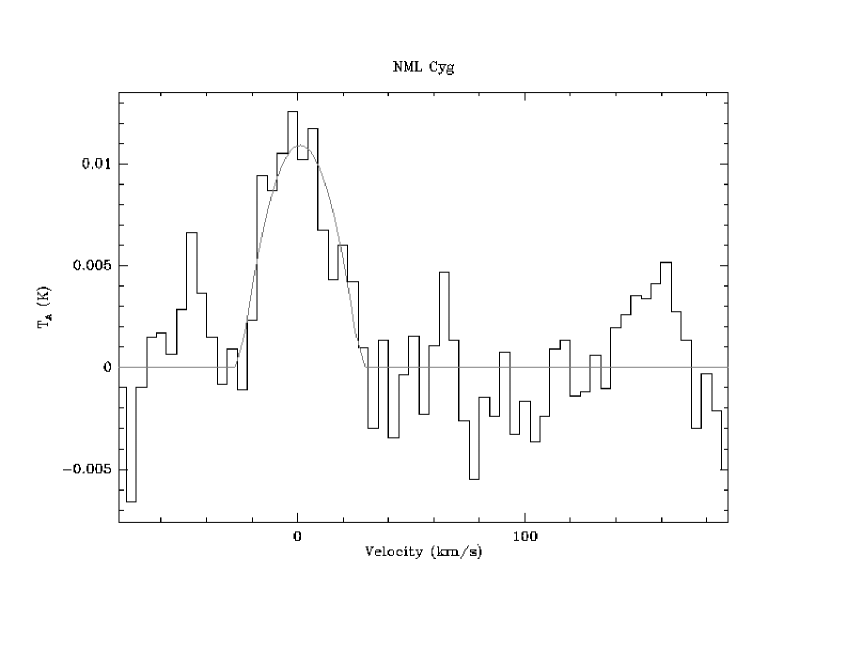
NML Cyg was observed in the 557 GHz (m) ground state ortho transition with SWAS. The spectral resolution with this instrument is of order , i.e. about 1 km s-1. The observed line is considerably weaker than the infrared lines, but nevertheless was detectable. The data were gathered in observations covering 165 hours during two different observing sessions. The first covered 106 hours spreading over the period from November 8, 2002 to December 20, 2002. The second observing session covered 59 hours and took place between April 26 and May 15, 2003. The emission line together with a parabolic fit is shown in Figure 3. The spectral resolving power in this spectral range is more than an order of magnitude higher than in the SWS and LWS ranges, and the observed line shape is dominated entirely by the actual outflow. The parabolic fit we have chosen reflects the expectation that the outflow may, to first order, be isotropic in the star’s rest frame. The flux integrated over the line is W cm-2, the peak flux is 184 Jy and the peak of the emission line lies at km . The one sigma uncertainty of the fitted integrated flux is W cm-2.
The emission observed in this spectral range is due to cold water vapor. The upper level of this transition lies only K above the ground ortho-H2O state, so that it is readily excited in collisions with cool gas in the outer regions of the star’s outflow.
4. Theoretical Models of the Outflow from Evolved Stars
Until the past few years, models of the outflow from evolved stars generally treated the radiative transfer through the outflowing atmosphere separately from the dynamics of the flow. This tended to lead to conflicting notions: On the radiative transfer side, the outflow was considered to proceed at some constant terminal velocity. From the dynamic perspective, dust grains were pictured as absorbing starlight which they quickly re-emitted in the infrared while also transferring absorbed momentum to the gas, thus accelerating the outflow. But if the infrared radiation is so closely tied to momentum transfer, it cannot simultaneously be made consistent with a constant outflow velocity — leading to the cited conflict.
This difficulty was first overcome in a series of papers by Ivezić & Elitzur (1995, 1997) and Zubko & Elitzur (2000), who produced a self-consistent outflow model combining both dust radiative transfer and hydrodynamics. In oxygen-rich evolved stars, water vapor is a dominant coolant in the outflow. The model exhibits scaling laws that define the radial variations in the velocity and the radiation fields in terms of a radial distance measured in units equal to the inner diameter of the dust absorption shell. The gas in the outflow is largely heated through collisions with the grains that also transfer linear momentum to the gas, thereby accelerating it. Over a significant portion of the outflow the balance between the heating and cooling is largely dominated by water vapor. The H2O is mainly heated by absorption of radiation emanating from dust in the immediate vicinity of the star, though some heating also is due to collisions with hydrogen molecules that have been collisionally heated by dust grains. H2 cannot rapidly cool through radiative transitions since it is restricted to quadrupole emission at the temperatures found in outflows. Most of the heating and cooling takes place through pure rotational H2O transitions throughout the bulk of the outflow, the cooling being almost directly proportional to the heating throughout the flow (Zubko & Elitzur, private communication, 2001). As discussed by Harwit & Bergin (2002) this nearly constant proportionality has the effect of simulating a radiative transfer and temperature profile of a gray body, scaling the temperature to radial distance from the star through the constancy of the product .
5. Derived Mass Loss from NML Cyg and VY CMa
Figure 4 shows representative points from the infrared continuum spectrum of NML Cyg obtained through ground-based photometry (Strecker & Ney 1974), with additional data from IRAS. These points are fitted with a synthetic spectrum modeled on the procedure of Zubko & Elitzur (2000), who assumed a silicate-rich dust envelope in the outflow from oxygen-rich stars and used the DUSTY code of Ivezić, Nenkova, & Elitzur (1999). Figure 5 provides matching data for VY CMa. The observational data are obtained from Harwit et al. (2001). Input parameters for the computations that produce the fitted spectra of Figures 4 and 5 are shown for the respective stars in Table 2.
The spectral fits to the observed dust continuum spectra shown in Figures 4 and 5, while not ideal, seem satisfactory, particularly given the high variability of each star. The temperature and outflow velocity profile derived with the model of Zubko & Elitzur is shown for NML Cyg and VY CMa in Figure 6. Again, it is worth noting the roughly constant value of , already mentioned in Section 4.
| Table 2. Input, Fitting, and Derived Parameters for NML Cyg and VY CMa | ||
|---|---|---|
| NML Cyg | VY CMa | |
| Input Parameters: | ||
| Stellar BB temperature | 2500 K | 2800 K |
| Luminosity | ||
| Distance | 2000 pc | 1500 pc |
| Terminal outflow velocitya,b | 25 km s-1 | 20 km s-1 |
| Fitting Parameters: | ||
| Optical depth at 0.55m | 75 | 75 |
| Dust temperature at | 1400 K | 1400 K |
| 1000 | 1000 | |
| H2O abundance at | ||
| Ortho-H2O : para-H2O | 1 | 1 |
| Derived Parameters: | ||
| Mass loss rate | ||
| Gas-to-dust mass ratio | 350 | 510 |
| Stellar radius | cm | cm |
| Shell inner radius | cm | cm |
| a Silicate dust optical data from Laor & Draine (1993) | ||
| b Dust size distribution from Mathis, Rumple & Nordsieck (1977) | ||
The outflow models constructed here for NML Cyg and VY CMa are essentially different from the one established by Zubko & Elitzur (2000) for W Hydrae, in that the wind is optically thick for both NML Cyg and VY CMa, with to 80, whereas for W Hydrae, . This means that the dust envelope defines the total flux in most of the spectrum, as indicated in Figures 4 and 5 by the merger, beyond m, of the dotted line representing dust emission and the solid line fitted to the total observed flux.
Table 2 underlines the similarities between NML Cyg and VY CMa. One major difference, however, is the ten times higher H2O abundance in VY CMa, required by the star’s large observed H2O line fluxes.
To check the stability of our results for NML Cyg, we varied the temperature of the central star over the range K, the terminal outflow velocity over the range km s-1, and the optical depth over values of , constrained largely by the near infrared portion of the spectrum in the 1 - 8 m region. Combining these variations, with dust temperatures K at the inner edge of the outflow, well within the realm constrained by the far infrared spectrum in the 20 to 100 m region, and a ratio of outer to inner edge of the outflow , we derived a range of outflow rates of yr-1 and a gas-to-dust ratio . Our estimates of and final velocity, however, are subject to an additional uncertainty of , and the gas-to-dust ratio to an additional uncertainty of , due to the way that the DUSTY model takes gravity into account. This is further discussed in section 8. Given the quality of available data, these results appear to be satisfactorily robust. The uncertainties in the fitting and derived parameters for VY CMa are approximately the same.
Values cited in the “Model” columns of Table 3 provide our best predictions of integrated line fluxes, especially for spectral lines not yet observed. Future observations thus will be able to pass judgement on the general validity of the model.
| Table 3. Relative H2O Flux Levels from W Hydrae, VY CMa and NML Cyg | |||||||||
| Wavelength | Transition | W Hydrae | VY CMa | NML Cyg | |||||
| (m) | (K) | (K) | W cm-2 | W cm-2 | W cm-2 | ||||
| Observeda | Modelb | Observedc | Modeld | Observed | Modeld | ||||
| 538.289 | o: | 61.0 | 34.2 | 0.45 | 0.76 | 0.34 | 0.57 | 1.3 | 1.2 |
| 179.527 | o: | 114 | 34.2 | 8.66 | 12.5 | 8.7 | 5.7 | 16.5 | |
| 174.624 | o: | 196 | 114 | 9.21 | 8.3 | 8.8 | 3.8 | 10.7 | |
| 125.356 | p: | 319 | 204 | 16.6 | 12.4 | 5.2 | 14.6 | 14.1 | |
| 113.538 | o: | 323 | 196 | 17.4 | 11.3 | 5.6 | 10.1 | 14.7 | |
| 108.073 | o: | 194 | 61.0 | 13.0 | 15.5 | 13.2 | 8.5 | 17.5(??) | 19.1 |
| 100.983 | p: | 196 | 53.4 | 22.7 | 10.6 | 32.9 | 21.8 | ||
| 99.493 | o: | 468 | 323 | 12.6 | 5.6 | 40.0 | 15.3 | ||
| 95.627 | p: | 469 | 319 | 12.2 | 5.2 | 14.3 | 15.1 | ||
| 89.989 | p: | 297 | 137 | 27.3 | 18.1 | 8.8 | 24.5(??) | 20.1 | |
| 78.742 | o: | 432 | 249 | 28.0 | 14.1 | 7.4 | 37.8(??) | 17.7 | |
| 66.438 | o: | 411 | 194 | 22.9 | 18.5 | 17.2(??) | 10.3 | 21.6 | |
| 58.699 | o: | 550 | 305 | 19.5 | 15.4 | 8.9 | 52.5(??) | 18.8 | |
| 40.760 | p: | 952 | 599 | 22.4 | 11.7(??) | 11.3 | 53 | 24.9 | |
| e40.691 | o: | 550 | 196 | 23.0 | 36.1 | 36.9(??) | 20.2 | 43.6 | |
| 37.566 | p: | 1335 | 952 | 13.7 | 8.3 | 37 | 15.8 | ||
| 36.212 | p: | 867 | 469 | 33.7 | 5.6(??) | 17.2 | 48 | 36.7 | |
| 35.938 | o: | 1279 | 878 | 13.9 | 12.1(??) | 9.0 | 47 | 18.3 | |
| e31.772 | o: | 702 | 249 | 63.0 | 40.0 | 24.1 | 24.6 | 47.5 | |
| 29.837 | o: | 1126 | 643 | 32.0 | 30.7 | 23.5 | 19.8 | 39.6 | |
| a ISO from Neufeld et al. (1996), Barlow et al. (1996); SWAS data, this paper and Harwit & Bergin (2002) | |||||||||
| b W Hydrae model from Zubko & Elitzur (private communication, 2001) | |||||||||
| c For sources of data see text | |||||||||
| d This paper | |||||||||
| e Blending may need to be taken into account | |||||||||
| (??) Question marks indicate less reliably established line fluxes | |||||||||
6. Comparison of Theory and Observations
Once a best-fit outflow model was in hand, we again used the Zubko & Elitzur (2000) model to derive the expected line strengths for all the water vapor lines, based on a best fit to the relatively few actually observed water vapor features, respectively, in NML Cyg, VY CMa and W Hydrae.
Because the model does not take into account the self absorption of emitted radiation in the stellar outflow, the SWS emission lines exhibiting P Cygni profiles have to be adjusted, as described in Section 2, to recover the originally emitted flux level. In Table 3 we present the water vapor emission line data for NML Cyg, W Hya, and VY CMa obtained with ISO and SWAS, along with the model reductions that Zubko & Elitzur developed for W Hya (Harwit & Bergin, 2002) and similar new calculations for NML Cyg and VY CMa. The model assumes that scaling laws apply, and we do find rough self-consistency in that respect. Table 3 shows that the water vapor spectra of the three stars, despite their considerable differences in luminosity and distance appear to approximately scale relative to each other, VY CMa providing line fluxes that are roughly ten times higher than W Hya and about four times higher than NML Cyg.
7. Some Apparent Anomalies
Somewhat surprising in the data on NML Cyg is the rather large displacement of the absorption trough seen in the P Cygni profiles of mid-infrared lines originating in regions of high temperature surrounding the star. As Figure 1 shows, some of the inferred outflow velocities in the absorbing gas reach values of the order of 40 km s-1, though with a mean value more nearly 30 km s-1. These velocities are higher than the displacement of the far-infrared lines observed in the LWS Fabry-Perot mode which uniformly are centered on roughly -15 km s-1 and have full widths at half maximum ranging from to 70 km s-1 for different, somewhat noisy line shapes. The SWAS data at 557 GHz also suggest lower outflow velocities; the observed line, though weak, appears centered on with a full width at half maximum around 40 km s-1. Comparable velocity profiles were observed by Lucas et al. (1992) for the pure rotational thermal SiO emission at 86.85 GHz. A somewhat similar, though less marked discrepancy in line velocities also appears for VY CMa, as judged from the data presented by Neufeld et al. (1999) and Harwit & Bergin (2002).
For NML Cyg, the prime discrepancy in the outflow velocities lies between ISO data, which concentrated on lines emitted in higher temperature regions, and the data on lower temperature regions gathered by SWAS and in observations of SiO thermal emission. These apparent discrepancies could be resolved if some of the hot absorbing gas near the star were streaming out at a substantially higher velocity than cooler gas at larger distances. Diamond, Norris and Booth (1984) found similarly puzzling results in their observations of 1612 MHz OH maser emission from NML Cyg. They suggested the existence of an inner component with an expansion velocity of 34 km s-1 with an extent of 1.5 arcsec and an outer component with an expansion velocity of 20 km s-1 at an angular radius of 2.5 arcsec. Even the inner of these two regions, however, would lie at a distance of cm from the star and, if in local thermal equilibrium, would be far too cool to excite the levels responsible for the P Cygni absorption. Nevertheless, it is possible that different expansion components, even in the inner regions surrounding the star, are flowing out at different velocities. This could also explain the substantial differences in line widths found for the various LWS emission lines. The larger widths could be an artifact of the line-fitting procedure, since the data are quite noisy. However, they might also be real, reflecting velocity differences at different radial distances from the star. In future searches, it would be useful to see whether substantial velocity differences exist at different radial distances in the outflow from NML Cyg.
Our mass loss rate for NML Cyg and VY CMa is also substantially higher than that cited by other observers. While Morris and Jura (1983) only give a minimum mass loss of yr-1 for NML Cyg, this is an order of magnitude lower than the value we give in Table 2. Their calculation is based on the idea of an inverse Strömgren sphere, i.e. the ionization of the outer edge of the outflow from NML Cyg by ultraviolet radiation from Cyg OB2 star 5. The authors assume this ionizing star to be at the same distance from Earth as NML Cyg, i.e. at the minimum possible distance from NML Cyg, pc, given the two stars’ angular separation of . The radial distance of the ionization front from NML Cyg is then assumed to lie on a circumstellar surface at which the ionization rate just balances the outflow rate. The mass loss rate computed in this fashion can only be a minimum, and scales as the square of the actual distance between the stars.
Knapp et al. (1982) used observations of the J = 1 – 0 line of CO, by Zuckerman et al. (1977), to determined a mass loss of yr-1 for an outflow velocity of 21 km s-1, if their assumed stellar distance is changed from 200 pc to 2 kpc. Their mass loss rate is based on the assumption that the observed CO flux is produced at a surface where heating by collisions with ambient gas keeps the CO in thermal equilibrium with that gas. Beyond this radial distance and the angular disk that it subtends on the sky, the flux is assumed to drop to zero. The calculated mass loss rate then becomes independent of the [CO]/[H2] ratio.
A third estimate of the mass loss for NML Cyg, due to Netzer & Knapp (1987), is yr-1, when adjusted to a distance of 2 kpc. It is based on the production of OH in the photodissociation of H2O by the interstellar radiation field at the outer surface of the outflow from the star. The observed OH maser shell radii together with the wind outflow velocity then provide a mass loss rate, on the assumption that the abundance of water vapor in the outflow is [H2O]/H2] . The calculated mass loss also depends on the assumed interstellar radiation field. The estimated error bars the authors place on their mass loss rates are plus or minus a factor of 2. However, the assumption of a typical interstellar radiation field, appears to be in conflict with the ionizing radiation field assumed by Morris & Jura (1983). It is not clear which of the two assumptions, if either, is correct.
8. Discussion
The mass loss of the three stars considered here is generally assumed to be largely driven by the starlight absorbed by dust grains. The approach we have taken in this paper is to calculate the mass loss rate derived from the coupled dynamic and radiative transfer equations, based largely on dust opacity (Ivezić, Nenkova, & Elitzur, 1999). The assumptions we make are thus quite different from those of Moris & Jura (1983), Knapp et al. (1982), or Netzer & Knapp (1987). The luminosity L of a star, when totally absorbed by dust, can lead to an absorption of outward directed momentum amounting to L/c per second. If the outflow accelerates from a negligibly low initial velocity to high final velocity, v, as indicated in our Figure 6, then the amount of mass that can be accelerated to a velocity v in each second is . Taking the assumed luminosity erg/sec and a final velocity of 25 km/sec, leads to g s-1 or yr-1. This is of the order the mass loss indicated by the computer model we used.
Our model assumes a spherical outflow and that all of the star’s light is absorbed by the dust. That the outflow is spherical seems to be in accord with the parabolic line shape that Harwit & Bergin (2002) found for the 557 GHz outflow from VY CMa, and the generally parabolic line fits for stars with massive outflows observed for many other stars, e.g. in the CO J = 2 – 1 line (Knapp et al., 1982). About the nearly total absorption of star light, there also can be little doubt, judging from the optical depths observed for NML Cyg and VY CMa. Two factors, however, do enter consideration. The first is the initial outflow velocity of gas just before dust condensation and the onset of radiation driven outflow. The second is the gravitational attraction of the star.
The peak outflow velocity of the gas beyond the inner radius where dust is formed is not currently known, but it appears to be high. The spectral lines emitted and absorbed in the hottest portions of the outflow, i.e. nearest to the star have considerably higher velocities than the flow at larger distances. This can be explained if gravitational attraction plays a decisive role once a packet of gas has been accelerated to peak velocity and then is shielded from further radiative acceleration by a new dust layer arising between it and the star.
While the DUSTY computer model of Ivezić, Nenkova, & Elitzur (1999) appears to be the most advanced program available at the moment, an inherent limitation is that it takes the force of gravitational attraction into account as a reduction in the radiative repulsive force through a parameter . is then taken to be constant at all distances. This is a valid approximation for optically thin outflows. But when the optical depth of an outflow is high, the radiation pressure at large distances from the star drops drastically as dust at large distances from the star no longer is able to absorb the far-infrared flux reradiated near the inner radius of the outflow. In this case the gravitational attraction of the star can become dominant beyond the inner edge of the dusty outflow where the radiation pressure drops. We, therefore, may expect a reduction in outflow velocities at large distances from the star, a property not reflected in our computer generated outflow velocity in Figure 6.
If we take the short wavelength outflow velocities to be equal to , where is the outflow velocity at , the inner edge of the dust cloud where the dust forms, then the final outflow velocity , at large distances from the star, determined by the half-width of the 557 GHz line, will be determined by
| (1) |
For NML Cyg, we can set km s-1, and km s-1. This tells us that km s-1. Choosing cm then yields the mass of the star as . Cooling of the gas will not change this outcome significantly, since the internal energy of gas at K, characteristic of the temperature at , is only of order erg g-1. We can also solve for the mass loss, as
| (2) |
For NML Cyg, we then have yr-1, on the assumption that must be greater than or equal to zero if the gas is to recede sufficiently far from the star to permit dust to form.
Corresponding velocities for VY CMa are km s-1 and km s-1. As in Table 2 we also take cm. These parameters lead to and yr-1.
For both stars we expect to be significantly lower than , implying that is dominated by radiative acceleration. This is supported by the findings of Richards et al. (1996) who noted significant acceleration in the H2O maser outflows of NML Cyg, suggesting a low value of . If so, the lower limit to the mass outflow is close to the actual value.
It, therefore, appears that both the total mass loss and the diminishing velocities as a function of distance from the star can be roughly accounted for. Within factors of , the mass loss rates we derive appear consistent with those of other workers, who derived their values from widely differing assumptions. Our mass estimate for VY CMa seems low, unless this star has already lost a substantial fraction of its initial mass. Unfortunately, we still are some way from narrowing these differences and reaching a satisfactory understanding of massive outflows.
Acknowledgments
This work was supported by NASA contract NAS5-30702. We would also like to acknowledge our indebtedness to the referee for the careful reading of our manuscript and incisive comments.
References
Barlow, M. J., et al. 1996, A&A 315, L241
Boboltz, D. A., & Marvel, K. B. 2000, ApJ, 545, L149
Cohen, r. J., et al., 1987, MNRAS, 225, 491
Danchi, W. C., et al. 2001, ApJ 555, 405
Diamond, P. J., Norris, R. P., & Booth, R. S. 1984, MNRAS, 207, 611
Harwit, M., et al. 2001, ApJ, 557, 844
Harwit, M., & Bergin, E. A. 2002, ApJ, 565, L105
Ivezić, Ž., & Elitzur, M. 1995, ApJ, 445, 415
Ivezić, Ž., & Elitzur, M. 1997, MNRAS, 287, 799
Ivezić, Ž., Nenkova, M., & Elitzur, M. 1999, User Manual for DUSTY, Univ. Kentucky Internal Report (Accessible at http://www.pa.uky.edu/ moshe/dusty)
Justtanont, K., et al. 1996, A&A, 315, L217
Knapp, G. R., et al. 1982, ApJ 252, 616
Laor, A. & Draine, B. T. 1993, ApJ 402, 441
Lucas, R., et al. 1992, A&A, 262, 491
Mathis, J. S., Rumple, W., & Nordsieck, K. H. 1977, ApJ, 217, 425
Monnier, J. D., et al. 1997, ApJ, 481, 420
Morris, M., & Jura, M. 1983, ApJ, 267, 179
Netzer, N. & Knapp, G. R. 1987, ApJ 323, 179
Neufeld, D. A., et al. 1996, A&A, 315, L237
Neufeld, D. A., Feuchtgruber, H. Harwit, M., & Melnick, G. J. 1999, ApJ, 517 L147
Neugebauer, G., Martz, D.E., & Leighton, R.B. 1965, ApJ, 142, 399
Richards, A. M. S, Yates, J. A., & Cohen, R. J. 1996, MNRAS 282, 665
Ridgway, S. T., et al. 1986, ApJ 302, 662
Strecker, D. W., & Ney, E. P. 1974, AJ, 79, 1410
Wing, R. F., Spinrad, H., & Kuhi, L.V. 1967, ApJ, 147, 117
Zubko, V., & Elitzur, M., 2000, ApJ, 544, L137
Zuckerman, B., et al. 1977, ApJ 211, L97