The Structure, Kinematics and Physical Properties of the Molecular Gas in the Starburst Nucleus of NGC 253
Abstract
We present resolution interferometry of CO emission from the starburst galaxy NGC 253. The high spatial resolution of these new data, in combination with recent high resolution maps of 13CO, HCN and near-infrared emission, allow us for the first time to link unambiguously the gas properties in the central starburst of NGC 253 with its bar dynamics. We confirm that the star formation results from bar-driven gas flows as seen in “twin peaks” galaxies. Two distinct kinematic features are evident from the CO map and position-velocity diagram: a group of clouds rotating as a solid body about the kinematic center of the galaxy, and a more extended gas component associated with the near-infrared bar. We model the line intensities of CO, HCN and 13CO to infer the physical conditions of the gas in the nucleus of NGC 253. The results indicate increased volume densities around the radio nucleus in a twin-peaks morphology. Compared with the CO kinematics, the gas densities appear highest near the radius of a likely inner Linblad resonance, and slightly lead the bar minor axis. This result is similar to observations of the face-on, twin-peaks galaxy NGC 6951, and is consistent with models of starburst generation due to gas inflow along a bar.
1 Introduction
Bar-driven gas flows have been proposed to explain the high star formation rates in the nuclei of some starburst galaxies (Kenney et al., 1992; Knapen et al., 1995; Kohno, Kawabe & Vila-Vilaró, 1999; Sheth et al., 2002). Star formation is predicted to be enhanced in regions with little shear and/or weak or no shocks, i.e., where the velocity gradients are small. These regions are predicted to be found, and in some cases are observed, at the bar ends, along the leading edges of the bar, and at locations within a nuclear ring or spiral. Molecular gas concentrations often appear in these areas, in particular at so-called “twin peaks” near the contact points between the dust lanes of the bar and the nuclear ring (Kenney et al., 1992).
High resolution images of the molecular gas in the archetypal starburst galaxy NGC 253 suggest that a similar ring of clouds may exist around its nucleus. Specifically, the position-velocity diagram (PVD) shows a hole near the center (Carlstrom et al., 1989; Peng et al., 1996; Garcia-Burillo et al., 2000), though this feature does not unambiguously indicate the presence of a ring (Sakamoto et al., 1999). From CS observations, Peng et al. (1996) suggest that much of the dense, star-forming gas in the nucleus of NGC 253 lies in a ring associated with so-called orbits, which are small, elongated orbits perpendicular to the bar (Binney & Tremaine, 1987). Similarly, Garcia-Burillo et al. (2000) conclude from the PVDs of H13CO+ and SiO emission in NGC 253 that the dense gas also follows these orbits. The ratio of HCN and CO intensities, an indicator of density, is also elevated 5– on either side of the nucleus along the major axis (Paglione, Tosaki & Jackson, 1995). Indeed, dense gas in the face-on galaxy NGC 6951 appears to follow the orbits closely (Kohno et al., 1999), but the low declination and high inclination of NGC 253 (, Pence, 1980) have hindered similar analysis.
Previous high resolution maps of gas emission from NGC 253 either did not trace the bulk of the molecular gas, i. e., they were most sensitive to dense, shocked or ionized gas (Paglione et al., 1995; Anantharamaiah & Goss, 1996; Peng et al., 1996; Garcia-Burillo et al., 2000), or they lacked the spatial resolution to isolate individual cloud complexes and their kinematics (Canzian, Mundy & Scoville, 1988; Mauersberger et al., 1996). Further, since the first CO interferometer map of NGC 253 by Canzian et al. (1988), new images have been made of the stellar and dust distributions (Jarrett et al., 2003) and optically thin gas traced by 13CO (Matsushita, 2000). Das et al. (2001) have also analyzed the CO velocity field at high resolution, and with the Submillimeter Array now operational, interferometric maps of dense and warm gas traced by CO and other lines are certainly imminent. Given these new and anticipated data, it is appropriate to reexamine the properties of the molecular gas in NGC 253 but on the spatial scales of individual giant molecular clouds ( pc). To this end, we imaged the CO emission from NGC 253 with the Nobeyama Millemeter Array. To place any new work in the proper context will require this relied-upon tracer of the bulk of the star-forming gas in galaxies. We compare these data to high resolution HCN and 13CO maps (Paglione et al., 1995; Matsushita, 2000) to infer the properties of the molecular clouds and compare them to the kinematics and dust distribution to test how the bar in NGC 253 may drive the central starburst.
2 Observations
The CO data were obtained 1996 January and February from the 6-element Nobeyama Millimeter Array at the Nobeyama Radio Observatory (NRO)111The NRO is a branch of the National Astronomical Observatory, operated by the Ministry of Education, Culture, Sports, Science and Technology, Japan. using the AB and C antenna configurations. The channels were averaged to achieve a velocity resolution of roughly 10 km s-1. The data were gridded with natural weighting, mapped, and CLEANed with the NRAO AIPS package. The FWHM of the synthesized beam is , with a position angle (PA) of . The total integrated CO flux smoothed to 43′′ is 3670 Jy beam-1 km s-1, roughly 50% of the single-dish integrated intensity (Wall et al., 1991; Young et al., 1995; Sorai et al., 2000; Paglione et al., 2001).
We recovered a 2.6 mm continuum map by averaging the line-free channels in the data cube. We also created a continuum image from a linear baseline subtraction within the datacube. Both methods produced nearly identical continuum maps. The emission appears unresolved, but may be marginally resolved only along the major axis of the galaxy. The peak flux is mJy, which is consistent with similar measurements (Peng et al., 1996; Garcia-Burillo et al., 2000).
The CO map originally appeared to have a registration offset from previous work. The large angular distance of (mostly north) to the phase calibrator 0050-094 may be the cause, though no strong phase variations were found during the observations. To properly compare this map to previous work, we aligned the 2.6 mm continuum source with the nuclear radio source of Ulvestad & Antonucci (1997). A total shift (mostly north) of roughly was required. A subsequent minor adjustment in declination was made to align the major axis and velocity centroid () of the CO emission with those of the high resolution HCN map. This adjustment was a small fraction of the beam width in declination. In summary, the central velocity field, which is roughly perpendicular to the major axis, constrains the R.A. offset, and the declination offset is mostly constrained by the cloud distribution along the major axis. Judging from the alignment of the continuum sources, major axes and velocity fields, we estimate that the CO map is aligned to within half a beam width in R.A. and Decl. ( and , respectively; the beam is oriented nearly north-south) with the radio continuum, HCN and 13CO maps.
3 Results
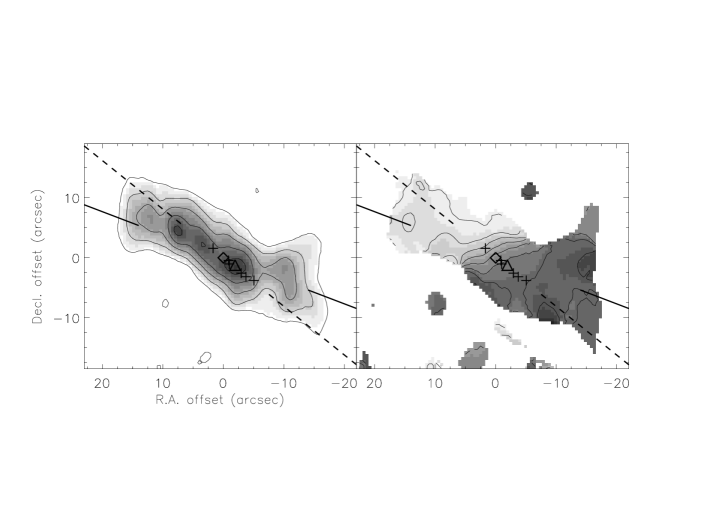
Maps of the integrated CO intensity and velocity field are shown in Figure 1. Figure 2 shows the CO channel maps. The general morphology and velocity field are consistent with other high resolution maps (Canzian et al., 1988; Paglione et al., 1995; Mauersberger et al., 1996; Peng et al., 1996; Garcia-Burillo et al., 2000; Das et al., 2001). There is an extended ridge of emission aligned with the infrared bar at a PA of , and a central group of bright clouds aligned with the major axis of the galaxy (PA = , Pence (1980)) orbiting the radio nucleus in a possible ring. The kinematics of these features are discussed below.
The CO emission is somewhat more extended than the maps of dense gas tracers such as HCN and H13CO+, with intense emission at the radio nucleus and the mid-infrared peak (Keto et al., 1999). The CO peak appears to lie between the thermal radio sources, unlike the HCN emission which at the same resolution is strongly coincident with the thermal sources. The CO spectra agree well with the resolution data of Sorai et al. (2000) and the resolution CO data (Mauersberger et al., 1996). We even recover many double-peaked spectra as seen at resolution. The line widths of the new data are slightly narrower than, and the peak line temperatures higher than previous work, indicating that we are better resolving the star-forming clouds. The overall CO and distributions and PVDs at similar resolution are comparable, though the new map resolves the emission for the first time into small-scale complexes. Also for the first time at these spatial scales, the ratio of the CO and integrated intensities is found to be over much of the map, implying optically thick gas. The gas properties are discussed below.
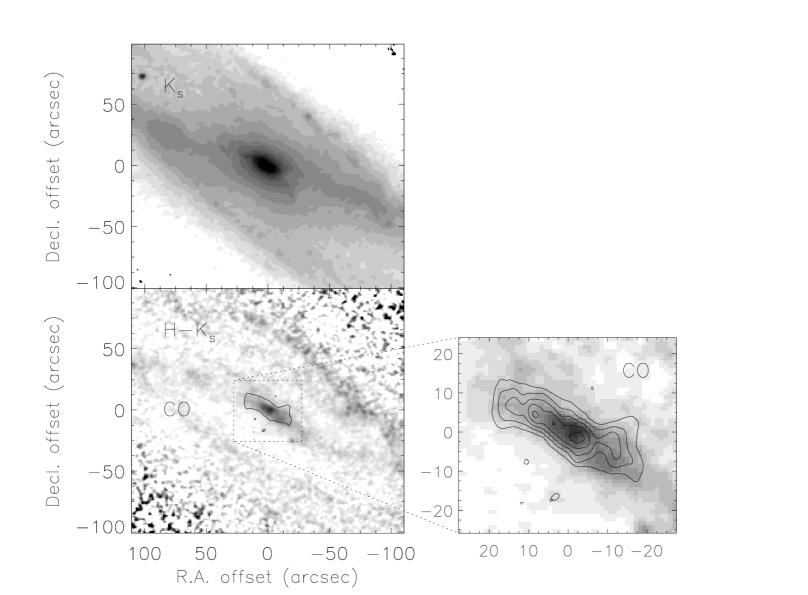
The CO emission is compared to the 2MASS and maps (Jarrett et al., 2003) in Figure 3. The map clearly shows the bar and some of the ring structure around the nucleus. The wide-field, resolution map of Sorai et al. (2000) indicates that the CO closely traces the infrared bar distribution. The new CO map shows that the small-scale CO distribution in the central arcminute matches up with the dust in the bar. The bar appears to have leading dust ridges that meet up with the nuclear CO emission. This morphology is typical for twin-peaks galaxies.
The extended ridge of emission and central cloud distribution have distinct velocity structures according to the CO velocity field. The central clouds move around the radio nucleus as a solid body with a PA of (Figure 1), similar to the distribution of the thermal radio sources, central HCN clouds and central near-infrared emission (Paglione et al., 1995; Ulvestad & Antonucci, 1997; Jarrett et al., 2003). However, unlike what is expected for solid-body rotation, the velocity field of these clouds is not exactly perpendicular to the cloud distribution. This result was seen by Das et al. (2001) as well, and may result from unresolved, complex gas motions at the nucleus. The gas kinematics are discussed more extensively in Section 5.
The peak CO flux is quite high, mJy beam-1, corresponding to a line brightness temperature of K. Given a likely beam filling factor below unity implies hot clouds ( K) in the nucleus of NGC 253, consistent with single-dish studies of higher frequency CO transitions (Harrison, Henkel & Russel, 1999; Bradford et al., 2003).
4 Gas Properties
To estimate the physical properties of the clouds in NGC 253, we compare the CO data with maps of HCN and 13CO at similar resolution (Paglione et al., 1995; Matsushita, 2000), and model the emission. The model assumes the emission originates in unresolved, homogeneous, spherical clouds. A photon escape probability function is included to account for the radiative excitation of optically thick lines (Stutzki & Winnewisser, 1985). We model the emission from the first 11 levels of CO and first 8 levels of HCN. The collision rate coefficients are from the literature (CO: Flower & Launay 1985; HCN: Green & Thaddeus 1974). We vary the [CO]/[13CO] abundance ratio from 30, appropriate for Galactic center clouds (Langer & Penzias, 1990), to 50, which was derived from a lower limit to the CN/13CN intensity ratio in NGC 253 (Henkel et al., 1993).
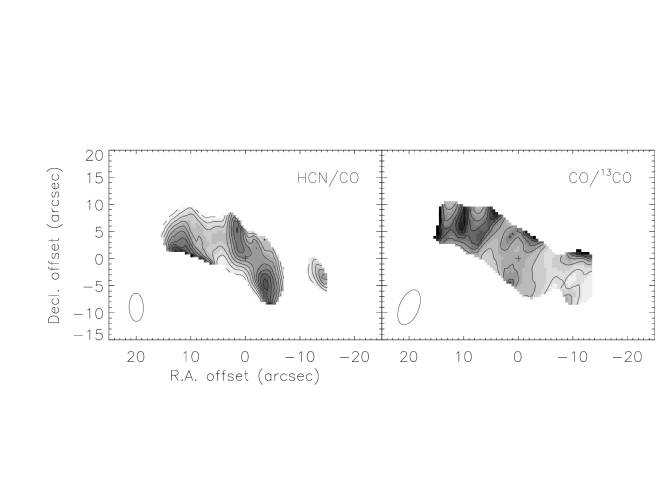
To take advantage of the highest resolution data, we begin by modeling only the ratio of integrated intensities of HCN and CO, which we refer to as simply HCN/CO. To this analysis we then include the somewhat lower resolution 13CO data to further constrain the results (Figure 4). With each new modeled species, we assume relative abundances and degrade the resolution on the map, but the relative cloud properties, i.e., gradients over 40–100 pc scales, are well constrained in the end. All maps were aligned by the emission distributions on the major axis, available continuum positions, and velocity fields as described above.
The HCN/CO ratio is sensitive to the volume density, but the kinetic temperature, and CO column density are not well constrained. We estimate iteratively as in Paglione et al. (1998) using the CO line brightness temperature, such that K. The factor accounts for non-thermal excitation, beam dilution and opacity. The emission is initially assumed to be thermalized and optically thick (, the area beam filling factor). The column density is initially estimated by assuming a constant conversion factor between the CO integrated intensity and the molecular gas column density, cm-2(K km s-1)-1 (Sorai et al., 2000; Paglione et al., 2001), and a CO abundance. This beam-averaged column density is converted to a cloud column density with the beam filling factor. The final beam filling factor is found by comparing the observed CO temperature with the value predicted by the model. Obviously the choice of affects the resultant columns and temperatures. The relative HCN and CO abundances are varied for different model runs, but remain within the range of predicted and observed values for dense Galactic clouds (Bergin, Langer & Goldsmith, 1995; Bergin et al., 1997). We also adjust the relative HCN and CO beam filling factors to account for the likely smaller sizes of the HCN clouds. This adjustment generally only affects the resultant density.
By including the CO/13CO integrated intensity ratio at resolution (Matsushita, 2000), we better constrain the column density. Valid solutions are found from the minimum (for ) with , and K. The parameter is no longer a necessary input. Given these criteria, we choose the best solution at the lowest with . Given that temperature, the solution for CO column density per velocity interval and H2 volume density are found from the minimum . Minimizing tends to assign slightly higher densities, lower column densities, higher beam filling factors and of course cooler temperatures to the clouds. Typically a wide range of valid temperature solutions results, though relative cloud properties (gradients) are well represented with this procedure.
We do not vary the relative 13CO and CO beam filling factors, that is, we assume they are the same based on the clumpy nature of clouds. Even in massive star formation regions, where isotope-selective photodissociation (ISPD) may reduce the abundance of the less well-shielded molecular species, these lines appear to originate from essentially the same volume of gas over 100 pc scales (e. g., Simon et al., 2001), Further, ISPD does not seem to be important over large spatial scales in the centers of NGC 253 or other CO-bright galaxies (Paglione et al., 2001).
4.1 Maps of Cloud Properties
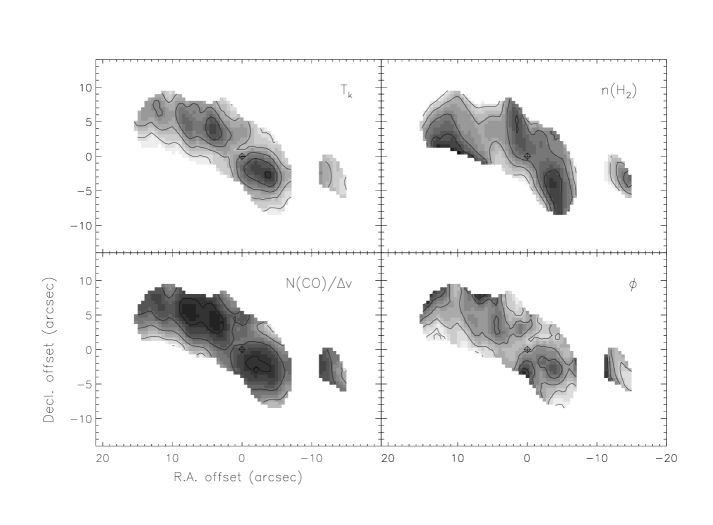
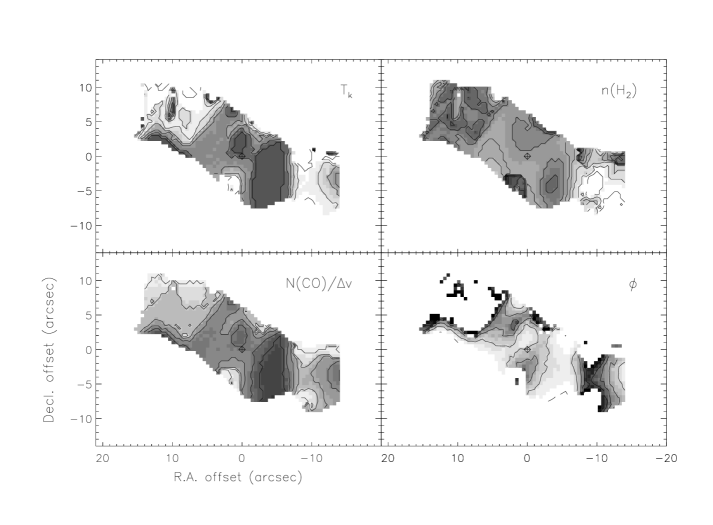
Table 1 lists the model inputs and resultant average cloud properties. Models A1–A5 consider only the HCN/CO ratio and initial beam filling factor, . Models B1–B5 consider the HCN/CO and CO/13CO ratios, and solve for the cloud conditions from the minimum and assuming the minimum valid . Maps of , CO column and H2 volume density ( and ), and beam filling factor are displayed for model solutions A1 and B2 in Figures 5 and 6. Figure 7 shows the distributions of cloud properties for model B2.
Varying the model inputs does not greatly affect the morphology seen in the maps, though the contour values change, as mentioned before (Paglione et al., 1998). Therefore we restrict our discussion to the relative gas properties and how they vary with position. However it is worth mentioning how the model inputs affect the results. As expected, a high fractional HCN abundance or high ratio results in lower H2 density solutions. Similarly, a high fractional 13CO abundance (low [CO]/13CO]) results in lower column density solutions. The solution from model B2 (Figures 6 and 7) illustrates the effect of using the minimum temperature. The northeastern region of NGC 253 is predicted to have relatively low temperatures ( K), but the beam filling factor there approaches unity () and the column densities are also relatively low ( cm-2 kms), both of which are expected consequences of underestimating the temperature. Note however, that these presumably “low” temperature limits average a warm 50 K. Indeed, kinetic temperatures in this general region of NGC 253 derived from NH3 observations are predicted to exceed 140 K (Mauersberger et al., 2003). Our derived temperature of over 200 K in the southwest is twice the estimate from NH3, but considering the difference in resolution between these datasets, and that both studies yield limits to , the agreement is reasonable. Given that the southwestern cloud is also the mid-IR peak and coincident with a bright cluster of massive stars (Keto et al., 1999), such high temperatures are not wholly unexpected.
Using the resultant gas properties and the radiative transfer model, we derive expected CO ()/() intensity ratios varying from 1.0 to 1.7 across the central area of the map. Though difficult to compare with our map, the observations of Mauersberger et al. (1996) appear to be consistent with the results. We expect ratios of 1–1.5 in the central region of the map, and only model B1, with the Galactic center 13CO abundance, disagrees in that it predicts CO ()/() over most of the map.
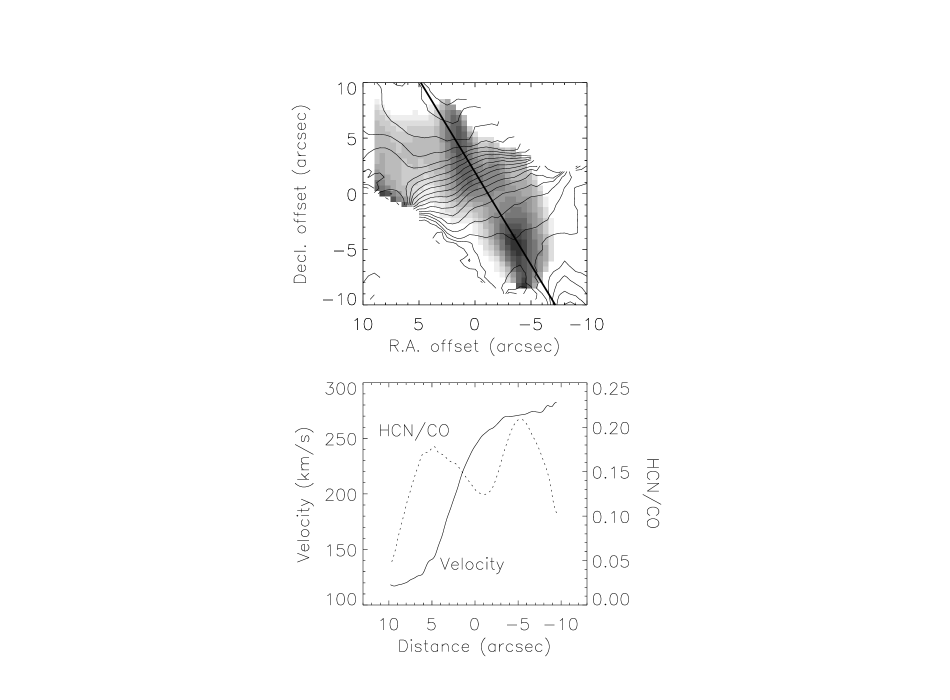
The central peaks in temperature, volume and column density are more or less symmetrically distributed around the kinematic center of NGC 253. They also flank the area of solid body rotation at the nucleus and lie perpendicular to the rotation axis of the region (Figure 8). These warm and dense clouds could therefore very well be part of a nuclear ring as seen in twin-peaks galaxies. (Note that the very high temperatures derived in models B1–B5 are still lower limits based on the modeling procedure.) Figure 8 shows the variation in the orbital velocity and HCN/CO ratio along the major axis of this supposed ring. The density peaks appear at the ends of the central region of solid body rotation where velocity gradients are lower, and star formation may occur more readily.
5 Cloud Kinematics
We examine the cloud kinematics to estimate the effect of the bar on driving star formation at the locations of the dense nuclear clouds in NGC 253. We primarily search for inner Lindblad resonances (ILRs) and regions of overlapping orbits and/or low velocity gradients by analyzing the CO rotation curve and by modeling the bar potential.
5.1 Rotation Curve
Because NGC 253 is nearly edge-on, we use a terminal velocity method, similar to the iteration method of Sofue et al. (2003), to determine the rotation curve from the PVD (Figure 9). The PVD is created by first rotating the CO data cube by , the PA of the major axis (Pence, 1980). To increase the signal-to-noise ratio, we average the CO spectra within of the major axis, which roughly matches the beam extent. The rotation curve is estimated at each point along the major axis from the maximum velocity, corrected for inclination, at which emission was detected above the level in at least two contiguous channels. From this velocity we subtract (in quadrature) the half-width values of the line broadening due to beam smearing, the 10 km s-1 channel width and the turbulence of the interstellar medium (assumed to be 10 km s-1). The beam smearing is estimated from the gradient in the rotation curve around each position. We then use the CO emission distribution and the derived rotation curve to recreate the PVD. The differences between the observed and modeled PVDs are used to correct the rotation curve, and a new model PVD is created. This procedure is repeated and monitored until convergence.
The high inclination of NGC 253 allows us to derive the radial gas distribution, , from the observed axial CO distribution, , unlike the more general technique of Sofue et al. (2003). They assume that the radial distribution is proportional to the observed, axial distribution. However, for highly inclined galaxies, foreground gas contributes significantly to the emission seen towards the central positions. Assuming a semi-circular (treating the eastern and western halves separately), axisymmetric disk geometry,
| (1) |
where is the section of an annulus between radii and , and major axis positions and , and is half the pixel separation along the major axis. The radial distribution is then derived from the outermost observed point,
| (2) |
and back-substitution using
| (3) |
The resulting rotation curve is displayed with the PVD in Figure 9. The r.m.s. difference between the observed and reconstructed PVD contours (at , and 20%, 30%, … 90% of the peak) is 25 km s-1. The r.m.s. difference between the level of the PVD, corrected for inclination, and the rotation curve is 11 km s-1. Except near the nucleus, the observed and modeled spectra agree reasonably well, particularly the line widths and central velocities; even some double-peaked spectra are reproduced. Both sides reach the same “turnover” velocity of km s-1 at the same circumnucler distance of (50 pc for Mpc). The rotation curve is somewhat asymmetric in that the western side drops more quickly and has a lower final velocity than the eastern side. A simple offset in the velocity centroid position and/or systemic velocity cannot account for this asymmetry. For example, no offset in the adopted central position along the major axis results in a symmetric radial gas distribution, . A similar asymmetry is seen in other tracers such as CO , H and H2 at comparable resolution (Arnaboldi et al., 1995; Mauersberger et al., 1996; Engelbracht et al., 1998), but the large-scale H I and CO velocities are more symmetric and confirm the adopted systemic velocity (Puche, Carignan & van Gorkom, 1991; Sorai et al., 2000). Near the nucleus, the line widths of the modeled spectra underestimate the observed line widths, and are relatively featureless in comparison. Apparently the linear gradient assumed near the nucleus is an oversimplification of the true gas dynamics (see Anantharamaiah & Goss, 1996). It is also likely that the intrinsic linewidths due to turbulence are higher near the nucleus.
5.2 Resonances
Star formation in nuclear rings is predicted to occur because of cloud collisions or gravitational instability near ILRs (e. g., Kenney et al., 1992, and references therein). We search for expected resonances in NGC 253 using the derived rotation curve. The bar pattern speed is estimated from the orbital velocity observed at a radius 20% beyond the ends of the bar and associated stellar ring (Sorai et al., 2000). The stellar bar and ring in NGC 253 are very well defined from recent mid- and near-infrared measurements by 2MASS and the MSX satellite (Jarrett et al., 2003; Kraemer et al., 2002), and from H imaging (Thilker et al., 2002). The bar is symmetric about the adopted dynamical center of the galaxy and terminates at the ring at a projected radius of (Figure 3). We adopt km s-1kpc-1, the pattern speed derived from CO and H spectra (Arnaboldi et al., 1995; Sorai et al., 2000).
From the gas angular velocity derived from the rotation curve, , we calculate the epicyclic frequency,
| (4) |
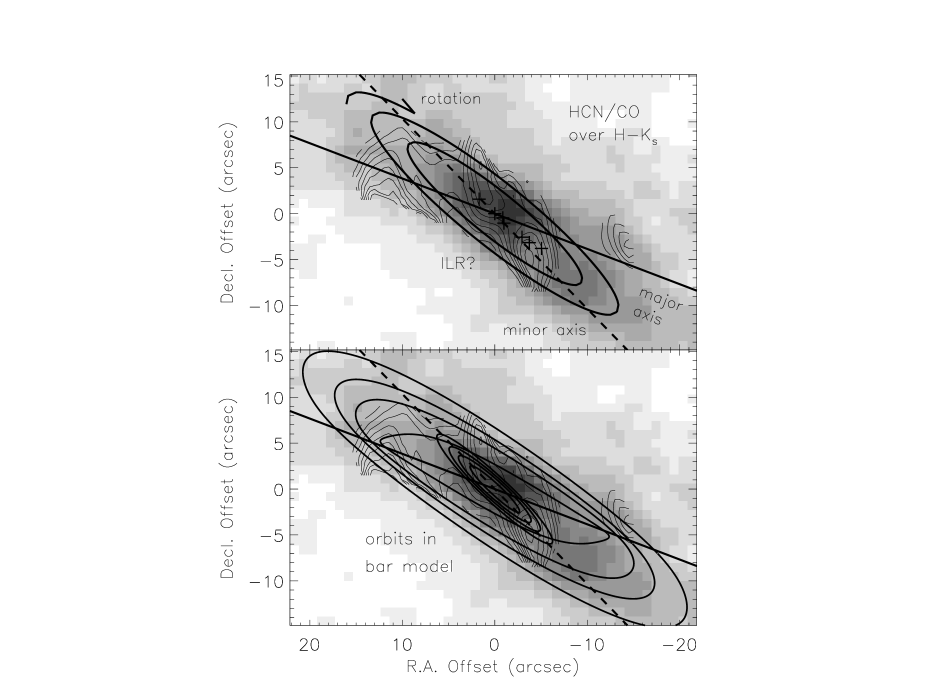
ILRs are predicted at radii where . Figure 10 shows the angular speed evaluated using each side of the rotation curve separately, and the weighted average of the eastern and western rotation curves. Though no clear ILR is apparent, approaches the pattern speed near radii of – and . We will only dicuss the possible inner ILR since our observations do not effectively probe the outer ILR at . The density peaks from the HCN/CO analysis occur only from the nucleus, implying that they either lie inside this possible ILR, or are seen in projection. Figure 11 compares the HCN/CO and 2MASS maps. The leading dust lanes end at the central near-infrared features, which are coincident with the millimeter continuum peak and are aligned with the distribution of molecular gas density. The projected PA of the bar minor axis is , which is close to that of the dense clouds. In fact, the dense clouds may lead the minor axis of the bar as seen in the twin-peaks galaxy NGC 6951 (Kohno et al., 1999). In NGC 253, the coincidence and alignment of the density peaks, bar axes and possible ILR imply that NGC 253 is likely a twin-peaks galaxy, and the bar drives star formation around its nucleus.
5.3 Bar Models
The observed gas distribution and rotation curve are difficult to reconcile with the typical model describing symmetric stellar orbits in a bar potential. It is likely that gas is not uniformly distributed along the predicted stellar orbits as is seen even in the center of most face-on, twin-peaks galaxies (Kenney et al., 1992; Knapen et al., 1995; Sheth et al., 2002). Nevertheless, in an attempt to explain the observed gas motions and density variations as an effect of the bar, we examine the expected orbits in the center of NGC 253 as in the literature (Peng et al., 1996; Sakamoto et al., 1999; Das et al., 2001). With likely ILRs in NGC 253, we may adopt the bar potential (Binney & Tremaine, 1987)
| (5) |
where , and are the limiting velocity, bar asymmetry parameter and core radius, respectively. Adjusting these parameters to fit the PVD, we can estimate the gas orbits in this potential (Figure 11). The dense gas near the center of NGC 253 seems to lie near, or slightly lead, the inner orbits, just as in NGC 6951. The regions where the and orbits overlap also coincide with the possible inner ILR. Fully hydrodynamic models of gas motions in a bar potential also support this picture that most star formation occurs near the intersection regions of these different orbit families where gas collisions cause shocks (e. g., Knapen et al., 1995).
6 Conclusions
We present the CO distribution and kinematics in the starburst nucleus of NGC 253. The molecular gas is concentrated in several complexes which are associated with both the near-infrared bar and likely “twin peaks” around the radio nucleus. The gas densities, temperatures and column densities are highest in these presumed twin peaks. The CO kinematics indicate that the density peaks may also coincide with an inner ILR just beyond the region of solid body rotation around the nucleus. Even without an ILR, the velocity gradient decreases near the peaks as well, which could also explain the star formation there.
Analysis of the rotation curve and expected gas motions in a bar potential, compared with the locations of enhanced gas density, lead us to conclude that the stellar bar drives the star formation in the starburst nucleus of NGC 253. This conclusion is supported by the likely presence of at least one ILR, gas motions consistent with and orbits, leading dust ridges along the infrared bar, and an apparent twin peaks morphology.
References
- Anantharamaiah & Goss (1996) Anantharamaiah, K. R., Goss, W. M. 1996, ApJ, 466, L13
- Arnaboldi et al. (1995) Arnaboldi, M., Capaccioli, M., Cappellaro, E., Held, E. V., Koribalski, B. 1995, AJ, 110, 199
- Bergin et al. (1995) Bergin, E. A., Langer, W. D., Goldsmith, P. F. 1995, ApJ, 441, 222
- Bergin et al. (1997) Bergin, E. A., Goldsmith, P. F., Snell, R. L., Langer, W. D. 1997, ApJ, 482, 285
- Binney & Tremaine (1987) Binney, J., Tremaine, S. 1987, Galactic Dynamics, Princeton Univ. Press
- Bradford et al. (2003) Bradford, C. M., Nikola, T., Stacey, G. J., Bolatto, A. D., Jackson, J. M., Savage, M. L., Davidson, J. A., Higdon, S. J. 2003, ApJ, 586, 891
- Canzian et al. (1988) Canzian, B., Mundy, L. G., Scoville, N. Z. 1988, ApJ, 333, 157
- Carlstrom et al. (1989) Carlstrom, J. E., Jackson, J., Ho, P. T. P., Turner, J. L., 1989, The Interstellar Medium in External Galaxies (Wash., DC: NASA), 337
- Das et al. (2001) Das, M., Anantharamaiah, K. R., Yun, M. S. 2001, ApJ, 549, 896
- Engelbracht et al. (1998) Engelbracht, C. W., Rieke, M. J., Rieke, G. H., Kelly, D. M., Achtermann, J. M. 1998, ApJ, 506, 639
- Flower & Launay (1985) Flower, D. R., Launay, J. M. 1985, MNRAS, 214, 271
- Garcia-Burillo et al. (2000) Garcia-Burillo, S., Martín-Pintado, J., Fuente, A., Neri, R. 2000, A&A, 355, 499
- Green & Chapman (1978) Green, S., & Chapman, S. 1978, ApJS, 37, 169
- Green & Thaddeus (1974) Green, S., & Thaddeus, P. 1974, ApJ, 191, 653
- Harrison et al. (1999) Harrison, A., Henkel, C., Russel, A. 1999, MNRAS, 303, 157
- Henkel et al. (1993) Henkel, C., Mauersberger, R., Wiklind, T., Hüttemeister, S., Lemme, C., Millar, T. J. 1993, A&A, 268, L17
- Jarrett et al. (2003) Jarrett, T. H., Chester, T., Cutri, R., Schneider, S. E., Huchra, J. P. 2003, AJ, 125, 525
- Kenney et al. (1992) Kenney, J. D. P., Wilson, C. D., Scoville, N. Z., Devereux, N. D., Young, J. S. 1992, ApJ, 395, L79
- Keto et al. (1999) Keto, E., Hora, J. L., Fazio, G. G., Hoffmann, W., Deutsch, L. 1999, ApJ, 518, 183
- Knapen et al. (1995) Knapen, J. H., Beckman, J. E., Heller, C. H., Shlosman, I., de Jong, R. S. 1995, ApJ, 454, 623
- Kohno et al. (1999) Kohno, K., Kawabe, R., Vila-Vilaró, B. 1999, ApJ, 511, 157
- Kraemer et al. (2002) Kraemer, K. E., Price, S. D., Mizuno, D. R., Carey, S. J. 2002, AJ, 124, 2990
- Langer & Penzias (1990) Langer, W. D. & Penzias, A. A. 1990, ApJ, 357, 477
- Matsushita (2000) Matsushita, S. 2000, Ph.D. Thesis, The Graduate University for Advanced Studies, Japan
- Mauersberger et al. (1996) Mauersberger, R., Henkel, C., Wielebinski, R., Wiklind, T., Reuter, H.-P. 1996, A&A, 305, 421
- Mauersberger et al. (2003) Mauersberger, R., Henkel, C., Weiss, A., Peck, A. B., Hagiwara, Y. 2003, A&A, 403, 561
- Paglione et al. (1998) Paglione, T. A. D., Jackson, J. M., Bolatto, A. D., & Heyer, M. H. 1998, ApJ, 493, 680
- Paglione et al. (1995) Paglione, T. A. D., Tosaki, T., & Jackson, J. M. 1995, ApJ, 454, L117
- Paglione et al. (2001) Paglione, T. A. D. et al. 2001, ApJS, 135, 183
- Pence (1980) Pence, W. D. 1980, ApJ, 239, 54
- Peng et al. (1996) Peng, R., Zhou, S., Whiteoak, J. B., Lo, K. Y., & Sutton, E. C. 1996, ApJ, 470, 821
- Puche et al. (1991) Puche, D., Carignan, C., van Gorkom, J. H. 1991, AJ, 101, 456
- Sakamoto et al. (1999) Sakamoto, K., Okumura, S. K., Ishizuki, S., Scoville, N. Z. 1999, ApJS, 124, 403
- Sheth et al. (2002) Sheth, K., Voegl, S. N., Regan, M. W., Teuben, P. J., Harris, A. I., Thornley, M. D. 2002, AJ, 124, 2581
- Simon et al. (2001) Simon, R., Jackson, J. M., Clemens, D. P., Bania, T. M. 2001, ApJ, 551, 747
- Sofue et al. (2003) Sofue, Y., Koda, J., Nakanishi, H., Onodera, S. 2003, PASJ, 55, 59
- Sorai et al. (2000) Sorai, K., Nakai, N., Kuno, N., Nishiyama, K., Hasegawa, T. 2000, PASJ, 52, 785
- Stutzki & Winnewisser (1985) Stutzki, J., & Winnewisser, G. 1985, A&A, 144, 13
- Thilker et al. (2002) Thilker, D. A., Walterbos, R. A. M., Braun, R., Hoopes, C. G. 2002, AJ, 124, 3118
- Ulvestad & Antonucci (1997) Ulvestad, J. S. & Antonucci, R. R. 1997, ApJ, 488, 621
- Wall et al. (1991) Wall W. F., Jaffe, D. T., Israel, F. P., & Bash, F. N. 1991, ApJ, 380, 384
- Young et al. (1995) Young, J. S. et al. 1995, ApJS, 98, 219

![[Uncaptioned image]](/html/astro-ph/0405031/assets/x3.png)


| Model | [HCN] | |||||||||||
|---|---|---|---|---|---|---|---|---|---|---|---|---|
| (K) | (cm-2 kms) | (cm-3) | ||||||||||
| A1 | 0.1 | 1.0 | 2 | 130 | 40 | 17.8 | 0.2 | 3.8 | 0.5 | 0.16 | 0.02 | |
| A2 | 0.1 | 0.5 | 2 | 130 | 40 | 17.8 | 0.2 | 4.7 | 0.6 | 0.16 | 0.02 | |
| A3 | 0.2 | 1.0 | 2 | 70 | 20 | 17.5 | 0.2 | 3.9 | 0.4 | 0.27 | 0.02 | |
| A4 | 0.2 | 0.5 | 2 | 70 | 20 | 17.4 | 0.2 | 4.7 | 0.5 | 0.26 | 0.02 | |
| A5 | 0.05 | 1.0 | 2 | 240 | 60 | 18.1 | 0.1 | 3.8 | 0.5 | 0.10 | 0.02 | |
| B1 | 1.0 | 2 | 30 | 90 | 60 | 16.7 | 0.5 | 4.2 | 0.3 | 0.57 | 0.28 | |
| B2 | 1.0 | 2 | 50 | 120 | 70 | 17.0 | 0.6 | 4.0 | 0.4 | 0.41 | 0.31 | |
| B3 | 0.2 | 2 | 50 | 190 | 50 | 17.9 | 0.7 | 6.0 | 1.1 | 0.17 | 0.24 | |
| B4 | 1.0 | 0.7 | 50 | 130 | 90 | 17.3 | 0.8 | 5.2 | 1.3 | 0.40 | 0.37 | |
| B5 | 1.0 | 6 | 50 | 70 | 40 | 16.6 | 0.4 | 3.6 | 0.5 | 0.58 | 0.28 | |