Chandra and XMM-Newton Observations of the Double Cluster Abell 1758
Abstract
Abell 1758 was classified as a single rich cluster of galaxies by Abell, but a ROSAT observation showed that this system consists of two distinct clusters (A1758N and A1758S) separated by approximately (a projected separation of 2 Mpc in the rest frame of the clusters). Only a few galaxy redshifts have been published for these two clusters, but the redshift of the Fe lines in the Chandra and XMM-Newton spectra shows that the recessional velocities of A1758N and A1758S are within 2,100 km s-1. Thus, these two clusters most likely form a gravitationally bound system, but our imaging and spectroscopic analyses of the X-ray data do not reveal any sign of interaction between the two clusters. The Chandra and XMM-Newton observations show that A1758N and A1758S are both undergoing major mergers.
A1758N is in the late stages of a large impact parameter merger between two 7 keV clusters. The two remnant cores have a projected separation of 800 kpc. Based on the measured pressure jumps preceding the two cores, they are receding from one another at less than 1,600 km s-1. The two cores are surrounded by hotter gas (–12 keV) that was probably shock heated during the early stages of the merger. The gas entropy in the two remnant cores is comparable with the central entropy observed in dynamically relaxed clusters, indicating that the merger-induced shocks stalled as they tried to penetrate the high pressure cores of the two merging systems. Each core also has a wake of low entropy gas indicating that this gas was ram pressure stripped without being strongly shocked.
A1758S is undergoing a more symmetric (lower impact parameter) merger between two 5 keV clusters. The two remnant cores are nearly coincident as seen in projection on the sky. The two cores are surrounded by hotter gas (9–11 keV) which was probably shock heated during the merger. Based on the pressure jumps preceding the two cores, they must have a relative velocity of less than 1,400 km s-1. Unlike A1758N, there is no evidence for wakes of low entropy gas.
Subject headings:
galaxies: clusters: general — galaxies: clusters: individual (Abell 1758 (catalog ))1. Introduction
Chandra observations over the past few years have shown that clusters of galaxies are dynamically complex systems. These observations have shown that the hot gas in clusters is frequently perturbed by cluster mergers and nuclear outbursts and motion of the central dominant galaxy. Cluster mergers generate hydrodynamic shocks, cold fronts (contact discontinuities), and filaments (Markevitch et al. 2000; Vikhlinin, Markevitch, & Murray 2001a; Markevitch et al. 2002; Mazzotta et al. 2002; Mazzotta, Fusco-Femiano, & Vikhlinin 2002; Kempner, Sarazin, & Ricker 2002). Residual motion or “sloshing” of the central dominant galaxy in clusters can also produce cold fronts and possibly wakes of stripped or cooled gas (Fabian et al. 2001; Markevitch, Vikhlinin, & Mazzotta 2001). These discoveries have helped illuminate the roles of magnetohydrodynamics and transport processes during cluster mergers. The observed sharpness of cold fronts shows that thermal conduction is highly suppressed in these regions (Ettori & Fabian 2000; Vikhlinin, Markevitch, & Murray 2001a). The robustness of merging cores demonstrates that the growth of hydrodynamic instabilities is also suppressed, possibly by the compression of ambient magnetic fields along cold fronts and the subsequent increase in magnetic surface tension (Vikhlinin, Markevitch, & Murray 2001b). A full understanding of recent Chandra observations of clusters provides a significant challenge for future numerical simulations, which must resolve structure on scales of a few kpc and include the effects of magnetic fields.
While Abell 1758 was classified as a single cluster by Abell (1958), Rosat images show that there are two distinct clusters (A1758N and A1758S) separated by approximately (Rizza et al. 1998). Abell 1758N is a hot ( 9–10 keV; Mushotzky & Scharf 1997) and X-ray luminous cluster ( ergs s-1; David, Jones, & Forman 1999). No temperature information is available for A1758S in the literature, but it is only slightly less luminous than A1758N ( ergs s-1; David, Jones, & Forman 1999). The Rosat HRI image shows that both A1758N and A1758S are highly disturbed systems (Rizza et al. 1998). A1758N has two X-ray peaks separated by approximately , while the centroid of A1758S is offset from the centroid of the large scale emission by approximately . A1758N hosts one of the most powerful NAT radio sources known (O’Dea & Owen 1985, Rizza et al. 1998). Head-tail and NAT radio galaxies are most common in clusters with perturbed X-ray morphologies and are probably produced as radio galaxies move through cluster atmospheres at high velocities (Burns et al. 1994). One of the X-ray peaks in A1758N is centered on a diffuse radio halo (Kempner & Sarazin 2001), which is further evidence for a recent major merger.
In this paper, we present Chandra and XMM-Newton observations of A1758. By utilizing Chandra’s high spatial resolution and XMM-Newton’s large throughput, we can search for signs of interaction between A1758N and A1758S and investigate the present status of the mergers in the two systems. This paper is organized in the following manner. In we discuss the details of our Chandra and XMM-Newton data analysis. Section 3 contains a discussion about the large scale X-ray properties of A1758 and a search for any interaction between A1758N and A1758S. We discuss the dynamic states of A1758N and A1758S separately in sections 4 and 5. Our proposed merger scenarios for the two clusters are summarized in . We assume km s-1 Mpc-1, , and throughout the paper. At a redshift of 0.279, the luminosity distance to A1758 is 1,430 Mpc, and kpc.
2. Data Reduction
2.1. Chandra Data
Abell 1758N was observed with Chandra on August 28, 2001 for 58,314s with ACIS-S in VF mode. The cluster was positioned on the center of the back illuminated S3 chip to provide better spatial coverage. We applied the same screening criteria on the level 1 data products as those used to generate the publically available blank field background files 1, including the additional screening for charged particles that is possible in VF mode. All calibration products used in our analyses are from CALDB 2.23. Since A1758N essentially covers the entire S3 chip, we used the data acquired on the back illuminated S1 chip to remove periods when the background rate exceeded the average rate by more than 20%, which left 42,521s of data. However, even after the short period charged particle flares are removed, the average 0.3–10 keV background rate in the S1 chip is still 18% higher than the nominal rate and is constant during the entire observation. The count rates in the front illuminated I2 and I3 chips are consistent with the nominal background rates. This observation (OBSID 2213) was mentioned in Markevitch et al. (2003) as an example of a long period soft flare of charged particles, i.e., a flare that is only detected in the back illuminated chips. Markevitch et al. found that such flares can be modeled as a power-law with an index of 0.15 and an exponential cut-off at 5.6 keV in PHA space. Due to the exponential cut-off in the spectra of soft flares, they do not affect the count rate at high energies which can still be used to normalize the quiescent background rate. The count rate between pha channels 2500 and 3000 in the screened S3 data is 9.5% higher than that in the background file. We therefore adjusted the exposure time in the background file to give consistent rates at high energies.
To determine the normalization of the soft flare component, we extracted spectra from the corner of the S3 chip and the same region on the blank sky observation. The difference between these two spectra was then fit with a cut-off power-law model in PHA space (i.e., CUTOFFPL/b in XSPEC). The power-law index and cut-off energy in the CUTOFFPL model were fixed to the values found by Markevitch et al. Only the normalization was allowed to vary. All spectral analysis of ACIS-S3 data presented below includes a CUTOFFPL/b model with the normalization determined from the area of the source extraction region. Separate photon-weighted response and effective area files are generated for each spectrum. The effective area files are corrected for the effects of contamination on ACIS using the corrarf task. All ACIS images presented in this paper only include photons with energies between 0.3–6.0 keV. By excluding higher energy photons, we eliminate approximately 50% of the S3 background at the expense of only 3% of the emission from a 9 keV thermal source. In addition to the nominal background rate, the soft flare is also removed from all imaging analysis using the best fit normalization of the CUTOFFPL model derived above.
2.2. XMM-Newton Data
Abell 1758 was observed by XMM-Newton on Nov. 11–12, 2002. All XMM-Newton analysis was done with SAS v5.4.1. The data from all three EPIC cameras were first reprocessed using the tasks emchain and epchain. The data were then screened using the standard patterns and flags specified in “An Introduction to XMM-Newton Data Analysis”. To screen out periods of enhanced background, we generated light curves for each detector in the 10–15 keV band. We then performed a successive clipping of the data which yielded 49435s, 49185s, and 43471s of screened data for the MOS1, MOS2, and PN cameras, respectively. We only included events with FLAG=0 in our spectral analysis. The large field of view of the EPIC cameras allowed us to extract background spectra from the same data sets. The background spectrum from all 3 cameras was extracted from within a radius circle located due north of A1758N. Separate response and effective area files were generated for each EPIC spectra using the SAS tasks rmfgen and arfgen. A detector map was used to weight each effective area file.

3. Large Scale Properties of the Double Cluster A1758
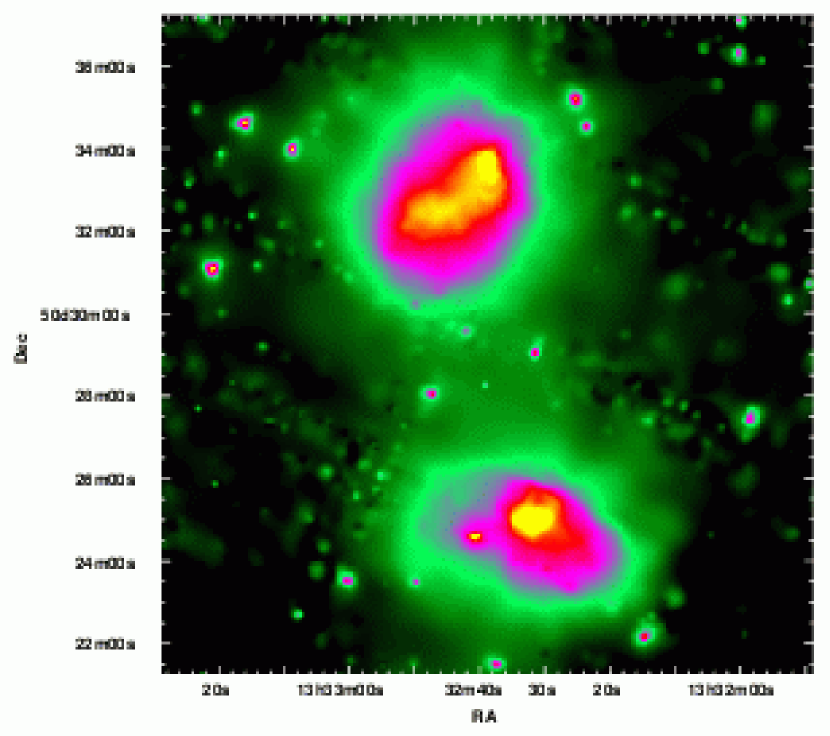
An adaptively smoothed, exposure corrected mosaic of the 3 XMM-Newton EPIC images is shown in Fig. 1. A1758N and A1758S are clearly visible in this figure with a projected separation of approximately 2.0 Mpc at the redshifts of the clusters. For comparison, the virial radii of the two clusters estimated below are 2.6 Mpc and 2.2 Mpc for A1758N and A1758S, respectively. Fig. 1 clearly shows the presence of X-ray emission between the two clusters. This emission is analyzed in detail below to search for any signs of interaction between the two systems. Both A1758N and A1758S contain significant substructure. A1758N contains two subclusters separated along a line running from SE to NW. A1758S has a large subcluster off-set towards the NE from the main component of the cluster. The source to the east of A1758S has a spatial extent consistent with that of a point source. Contours of the adaptively smoothed XMM-Newton mosaic are overlayed on the DSS image in Fig. 2. This figure shows that the large scale contours of A1758S are roughly centered on the brightest galaxy in the cluster, while the subcluster toward the NE in A1758S is centered on a group of fainter galaxies. The subcluster in A1758N off-set toward the NW is located near the center of a line of bright galaxies, while the SE subcluster in A1758N is off-set toward the NW from a fainter group of galaxies. The X-ray morphologies of A1758N and A1758S are discussed in more detail below.
| kT | Z | F | L | |||
|---|---|---|---|---|---|---|
| Cluster | Detectors | (keV) | () | (ergs cm-2 s-1) | (ergs s-1) | /DOF |
| A1758N | ACIS-S3 | 9.0 (8.4–9.9) | 0.30 (0.23–0.36) | 307/306 | ||
| A1758N | MOS1+MOS2+PN | 8.2 (8.0–8.6) | 0.28 (0.24–0.33) | 1891/1815 | ||
| A1758S | MOS1+MOS2+PN | 6.4 (6.0–6.7) | 0.22 (0.15–0.28) | 1738/1477 |
Note. — Results of fitting the XMM-Newton and Chandra spectra extracted within 1 Mpc radius apertures centered on A1758N and A1758S. All spectra were binned to a minimum of 20 counts per bin and fit to an absorbed MEKAL model with the absorption fixed to the galactic value of cm-2. This table gives the best-fit gas temperature (kT), abundance relative to the solar value (Anders & Grevesse 1989), unabsorbed 0.5-10.0 keV flux and luminosity, minimum and degrees of freedom (DOF). All errors are given at the 90% confidence limit.
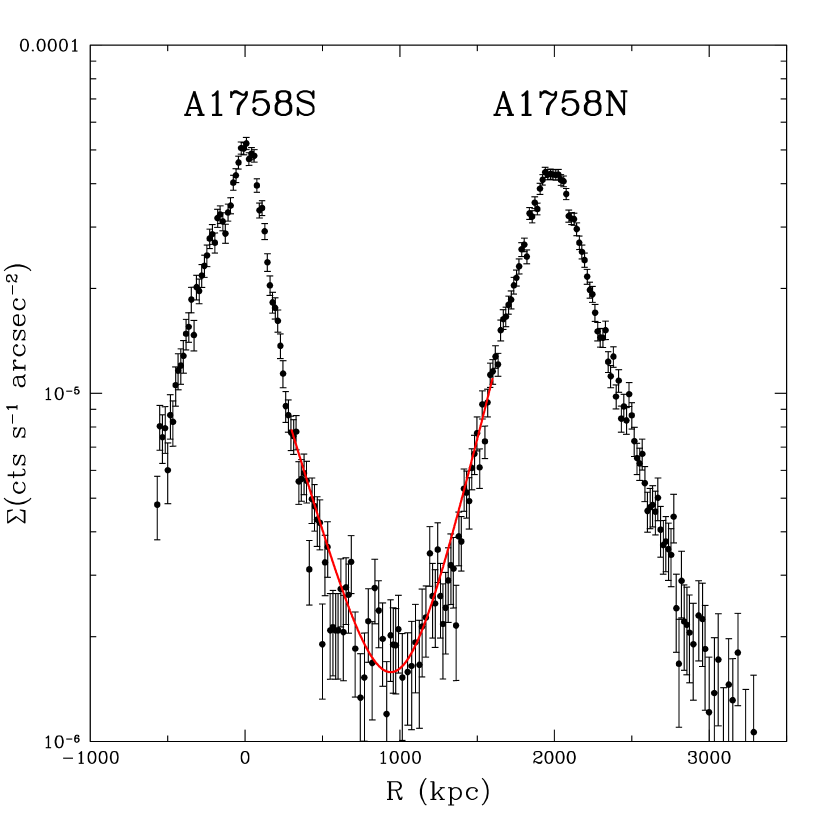
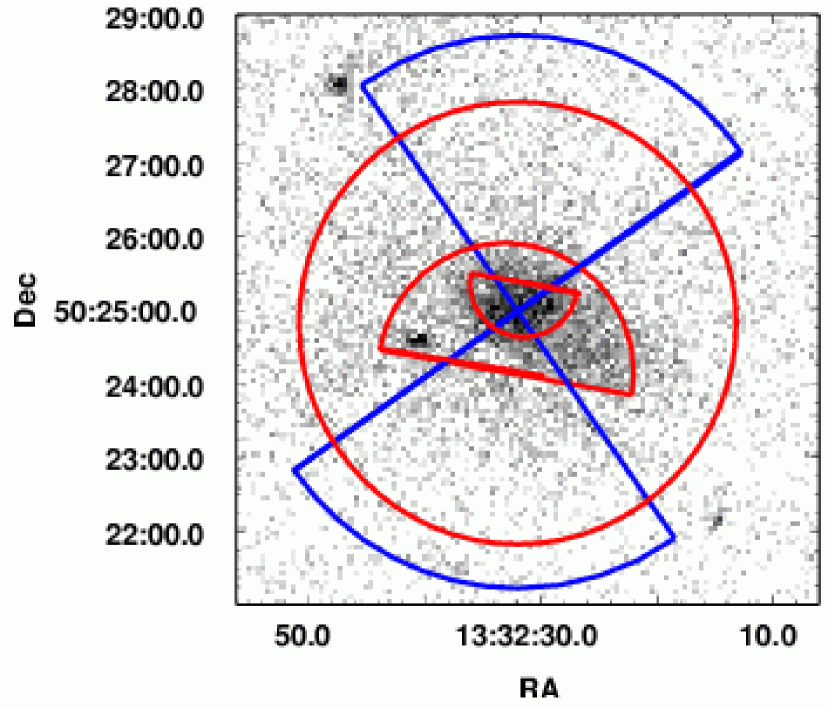
To search for signs of interaction between A1758N and A1758S, we extracted the counts from the PN image within the rectangular region shown in Fig. 2. Only the PN image is used in this analysis due to its lower background compared to the MOS detectors. A projected surface brightness profile was then computed by projecting the background-subtracted and exposure-corrected counts between 0.3 and 7.0 keV onto the longer side of the rectangle (see Fig. 3). The emission from all point sources between the two clusters was removed from the analysis. If the two clusters are interacting, then the gas at the outskirts of the clusters should be compressed and produce an excess of emission above the projected emission from the two systems. Since the emission from the clusters is not spherically symmetric, we fit the surface brightness in the regions from 300 kpc to 600 kpc in A1758S and from 1300 kpc to 1700 kpc in A1758N to simple power-laws, where zero is centered on A1758S. These radii correspond to those shown in Fig. 3. The sum of the two best fit power-laws is shown as the red line in Fig. 3. Our analysis indicates that there is no statistically significant excess emission between the two clusters above that expected from a simple projection of the two systems. We also generated a hardness ratio profile using the PN data to search for signs of compressional heating, but the resulting hardness ratio does not vary significantly between the two clusters.
The global X-ray properties of the two clusters were determined by extracting spectra within 1 Mpc radius apertures. We extracted spectra from all 3 EPIC cameras for both clusters and the ACIS-S3 spectra for A1758N. This is the largest extraction region that can be used without any overlap between the two clusters and also fit within the ACIS-S3 field-of-view. These spectra were then fit to an absorbed single temperature MEKAL model. The three EPIC spectra were fit simultaneously in the 0.5–10.0 keV energy band and the ACIS-S3 spectrum was fit separately in the 0.7–10.0 keV energy band. Table 1 shows that there is good agreement between the XMM-Newton and Chandra spectral analyses of A1758N. Our temperature measurements for A1758N also are in good agreement with a previous analysis of ASCA data by Mushotzky & Scharf (1997) who found – keV (90% errors). Even though these clusters are undergoing major mergers at the present time, the scaling between their temperatures and luminosities is consistent with the self-similar solution, . Simulations of cluster merging by Randall, Sarazin, & Ricker (2002) and Rowley, Thomas, & Kay (2003) find that even though the temperature and luminosity of a cluster varies significant during a merger, it still follows a relation. Using the cluster scaling relations in Bryan & Norman (1998), our temperature estimates, and our adopted cosmology (see the end of ), we estimate virial masses of M⊙ and M⊙ for A1758S and A1758N, respectively. These calculations are only used as rough guides since the on-going mergers likely produce emission-weighted temperatures that differ from the virial temperatures of the clusters, (see the simulations of Randall, Sarazin, & Ricker 2002), but the masses are probably accurate to within a factor of two.
Since there are so few published galaxy redshifts for A1758N and A1758S, we allowed the redshift to vary in our spectral analysis of the EPIC data. We obtained best-fit redshifts of z=0.2756 (0.2742–0.2806) for A1758N and z=0.2750 (0.2666–0.2808) for A1758S ( errors). This gives a velocity difference less than 2,100 km s-1 between the two clusters at confidence. The latest calibration summary document released by the XMM-Newton team (available at http://xmm.vilspa.esa.es) states that the gain uncertainties in the EPIC cameras using SAS 5.4.1 are approximately 10 eV at all energies. At the Fe-K line, this corresponds to a velocity uncertainty of only km s-1. Using the above estimates on the virial mass and radius of A1758N, the infall velocity at the virial radius of 2.6 Mpc in A1758N is 2,300 km s-1, which is consistent with the observed velocity difference. Thus, even through there are no direct signs of interaction in the X-ray data between the two clusters, their proximity to one another and small velocity difference are consistent with being a gravitationally bound system.
4. Dynamic State of the A1758N Cluster
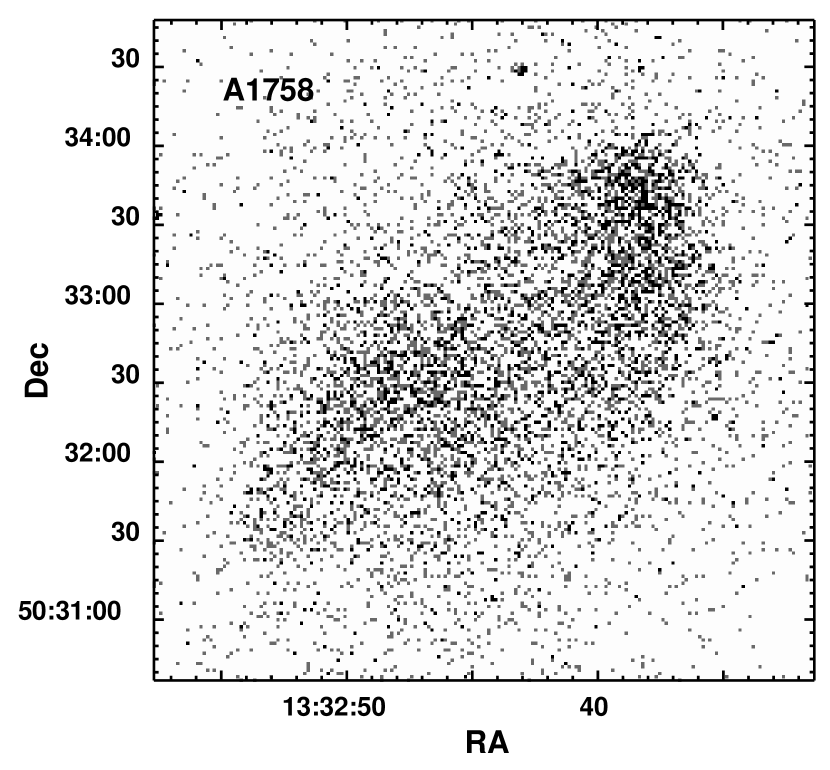
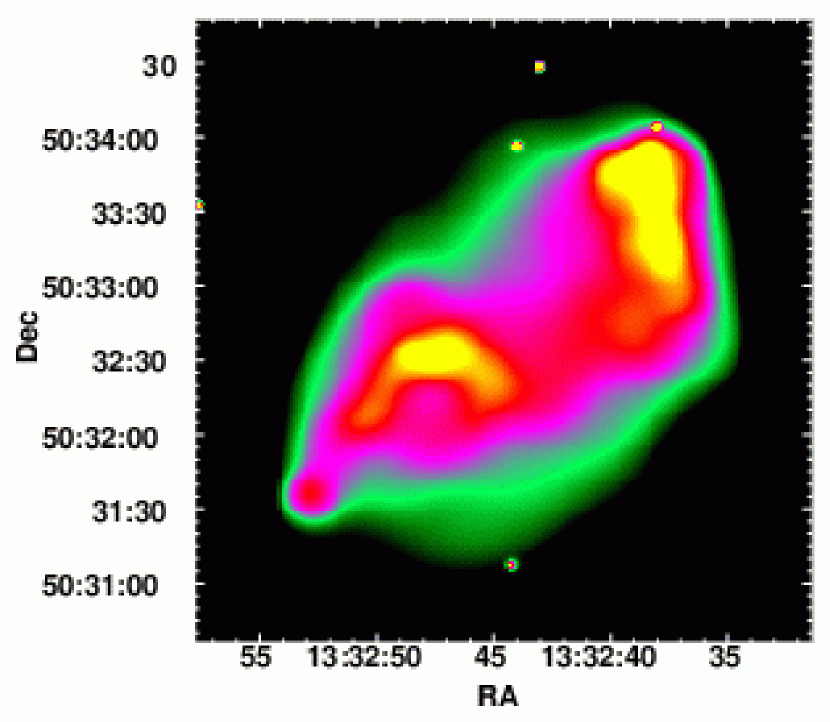
A1758N has a very complex X-ray morphology with several sharp features surrounding two merging subclusters (see the raw Chandra image in Fig. 4). The ACIS-S3 image shows that A1758N has a sharp front along the western edge of the cluster and two angular shaped edges bounding the NW and SE subclusters. There is also a depression in the surface brightness between the two subclusters. The adaptively smoothed ACIS-S3 image in Fig. 5 shows the cores of the two merging systems more clearly with a separation of approximately 800 kpc. With Chandra’s higher spatial resolution, we can identify the center of the SE subcluster with the group of galaxies visible in Fig. 2.
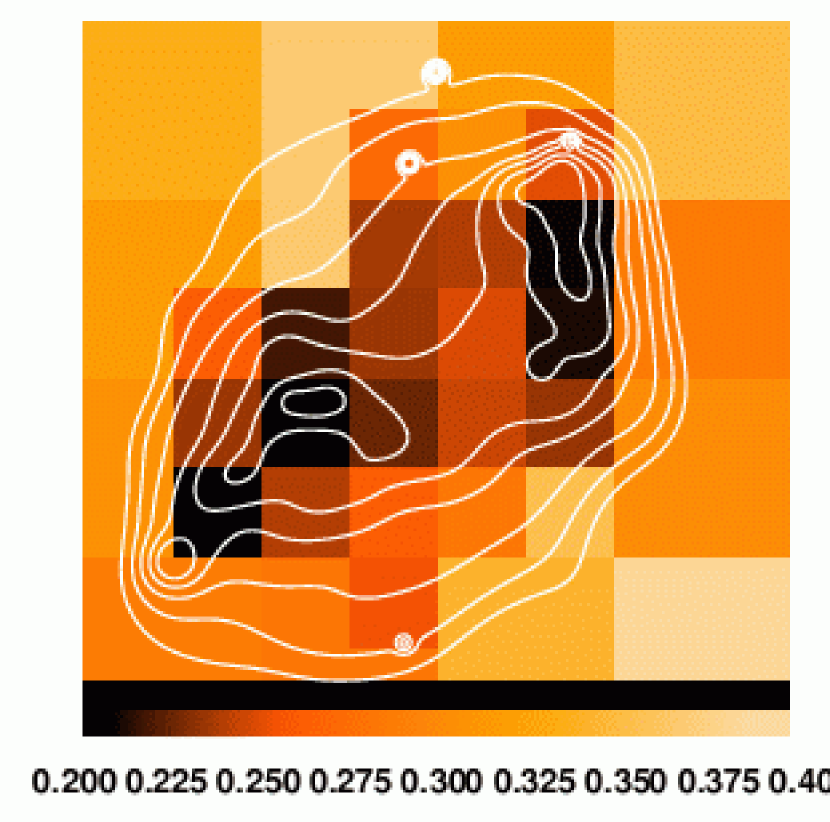
We generated an adaptively binned hardness ratio map using the technique in Sanders & Fabian (2001) with energy bands of 0.3–2.0 keV and 2.0–6.0 keV. An energy cut of 2.0 keV gives a reasonable compromise between temperature sensitivity (which requires a high energy cut) and photon statistics (which requires a low energy cut). Fig. 6 displays the X-ray contours from the adaptively smoothed ACIS-S3 image overlayed on the adaptively binned hardness ratio map. The data is binned so that the maximum relative errors in the hardness ratios are 10brightest regions have the softest emission, and hence must contain the lowest entropy gas. The hardness ratios of the gas in the darkest regions adjacent to the two subclusters are approximately less than the hardness ratio of the gas in the remainder of the cluster core. As a subcluster moves through another cluster, the pressure and density gradients around the subcluster should be steepest in the direction of motion. Examining the X-ray contours of A1758N suggests that the NW system is presently moving toward the north while the SE subcluster is presently moving toward the SE. The diffuse radio halo in A1758N (Kempner & Sarazin 2001) is centered on the NW subcluster and is also elongated in a north-south direction. The low entropy gas trailing these two systems is thus most likely gas that has been stripped into the wakes of the two merging subclusters.
Using the X-ray morphology and hardness ratio map of A1758N as guides, we extracted ACIS-S3 and EPIC spectra from the 4 regions shown in red in Fig. 7. We then fit the spectra to absorbed single temperature MEKAL models and the results of our spectral analysis are given in Table 2. The “halo” referred to in Table 2 corresponds to the region beyond the largest ellipse but within the large circle in Fig. 7. The “core” covers the region within the largest ellipse but excludes emission from the NW and SE wakes (the two smaller ellipses). Based on the spectral analysis presented in Table 2, the halo gas is significantly hotter than the gas in the wakes. A1758N is undoubtedly undergoing a major merger and the high gas temperature in the halo suggests that any shocks generated during the merger have already propagated throughout most of the cluster.
| ACIS-S3 | MOS1+MOS2+PN | |||||
|---|---|---|---|---|---|---|
| kT | Z | kT | Z | |||
| Region | (keV) | () | /DOF | (keV) | () | /DOF |
| A1758N (NW Wake) | 7.0 (5.9–8.9) | 0.32 (0.10–0.57) | 119/122 | 7.2 (6.7–7.6) | 0.35 ( 0.25–0.45) | 651/592 |
| A1758N (SE Wake) | 6.7 (5.8–8.3) | 0.27 (0.02–0.54) | 73/85 | 6.6 (6.0–7.1) | 0.45 (0.31–0.60) | 317/370 |
| A1758N (Core) | 8.7 (8.1–9.4) | 0.36 (0.22–0.50) | 330/336 | 7.2 (6.9–7.4) | 0.26 (0.21–0.30) | 1536/1378 |
| A1758N (Halo) | 10.5 (9.3–12.1) | 0.11 (0.33) | 472/490 | 9.8 (9.1–10.6) | 0.25 (0.16–0.36) | 1411/1387 |
Note. — Spectral fitting results for the four regions in A1758N illustrated in Fig. 7. See the notes to Table 1 for further details.
| kT | Z | ||
|---|---|---|---|
| Region | (keV) | () | /DOF |
| NW Spheroid | 7.2 (6.4–8.1)(5.9–8.8) | 0.64 (0.33–1.0)(0.15–1.2) | 87/94 |
| NW Inner Power-Law | 8.0 (7.0–8.8)(6.7–9.4) | 0.11 (0.28)(0.38) | 184/147 |
| NW Outer Power-Law | 10.8 (9.5–12.0)(9.0–13.1) | 0.17 (0.02–0.32)(0.43) | 351/285 |
Note. — Gas temperatures and abundances within the pie slice centered on the NW subcluster in A1758N (see Fig. 7). The regions refer to the 3 model components fit to the surface brightness profile (see Fig. 8). Both and 90% errors are given. See the notes to Table 1 for further details on the spectral analysis.


To investigate the dynamic state of the gas in A1758N further, we extracted surface brightness profiles from the ACIS-S3 data across the leading edges of the NW and SE subclusters (see the blue pie slices in Fig. 7). The resulting background-subtracted and exposure-corrected surface brightness profiles are shown in Fig. 8. We first fit the profiles with a truncated spheroid given by , where is the radius of curvature of the cold front and is the distance into the cold gas from the cold front (eq. A5 in Vikhlinin, Markevitch, & Murray 2001a), plus a power-law model, but as can be seen in Fig. 8, the outer regions are not well represented by a single power-law. We then tried a truncated spheroid plus a broken power-law model which produced satisfactory fits. The best-fit radii for the truncated spheroids are 80 kpc and 115 kpc for the NW and SE subclusters, respectively. The best-fit power laws correspond to values of and in the NW system and and ( errors) in the SE system. The outer slopes in the two clusters are typical of hot relaxed clusters, while the inner slopes are considerably flatter. Deprojecting the surface brightness profiles give central electron number densities of cm-3 and cm-3 in the NW and SW subclusters, which again, are typical densities for rich clusters. The density jumps preceding the NW and SE subclusters (i.e., at the edge of the truncated spheroidal component) are and ( errors).
Based on the success of the 3 component model in fitting the surface brightness profiles across the NW and SE edges, we extracted ACIS-S3 and EPIC spectra within the three regions covered by the different components of the model. The photon statistics of the ACIS-S3 data within these regions were not sufficient to place strong constraints on the gas temperature distribution. We also found that the spectral analysis of the EPIC data across the SE edge provided little information on the temperature distribution, so we only present the results for the EPIC data across the NW edge in Table 3. This table shows that the gas temperatures within the truncated spheroid and inner power-law regions are comparable, while the gas in the outer power-law region is significantly hotter. There is also some evidence for a higher abundance within the spheroidal component. The three components in the model surface brightness are suggestive of an inner core bounded by a cold front or contact discontinuity, a region of shocked gas bounded by a stand-off bow shock, and pre-shocked gas. However, in such a situation, the core and pre-shocked gas should be the coldest and the shocked gas the hottest, which is contrary to the observations. Since the gas remains hot to large distances in front of the NE subcluster, the shock must have already propagated throughout most of the cluster. This will be discussed in more detail below.
4.1. Proposed Merger History for A1795N
Based on past theoretical studies of merging clusters and the disruption of cooling cores during merging (e.g., Fabian & Daines 1991; Pearce, Thomas, & Couchman 1994; Ricker & Sarazin 2001; Gomez et al. 2002, Randall, Sarazin, & Ricker 2002), the merging process can be broken down into several stages: 1) the initial encounter phase during which shocks develop in the cluster outskirts, 2) the shocks stall as they try to penetrate the high pressure low entropy cores, generating the largest entropy jump in the outer gas, which had the highest initial entropy, 3) as the low entropy cores approach one another through shocked gas, they are continuously stripped as long as the ram pressure exceeds the thermal pressure within the cores, 4) stripping continues until all the gas beyond the core radius of the dark matter distribution has been stripped and then the remainder of the gas is stripped in bulk due to the nearly constant binding energy per unit mass of the core gas, 5) for off-axis mergers, the cores can survive beyond the point of closest approach, after which ram pressure stripping becomes less efficient and the surviving cores expands adiabatically, 6) the chaotic entropy distribution of the merged cluster drives large scale convection and some of the the shock energy that was deposited in the cluster outskirts is transported into the core gas, 7) eventually the two dark matter halos merge, and the lowest entropy gas settles into the minimum of the gravitational potential.
The X-ray contours, hardness ratio map, and surface brightness profiles of A1758N are consistent with a scenario in which the NW subcluster is presently moving toward the north and the SE subcluster is presently moving toward the SE (i.e., stage 5 above). The NW subcluster has been stripped down to its inner 80 kpc and the SE subcluster to its central 115 kpc. The survival of the two cores indicates that the core radii of the dark matter distributions in the merging systems are less than about 100 kpc. This is consistent with estimates deduced from Chandra observations of relaxed clusters (David et al. 2001, Arabadjis, Bautz, & Garmire 2002, Allen, Schmidt, & Fabian 2002). Based on the central densities and temperatures derived above, the central gas entropies are 120 and 110 keV cm2 for the SE and NW subclusters. These values are consistent with the central regions of relaxed clusters (e.g., Lloyd-Davies, Ponman, & Cannon 2000) and show that this gas was not strongly shocked during the merger. The hardness ratio map shows that the emission from the gas in the wakes is also soft, indicating that this gas was stripped without being strongly shocked. The detached nature of the wake in the SE subcluster, as evident in Fig. 5, indicates that ram pressure stripping is lessening, as it should after the point of closest approach.
4.2. Merger Kinematics for A1758N
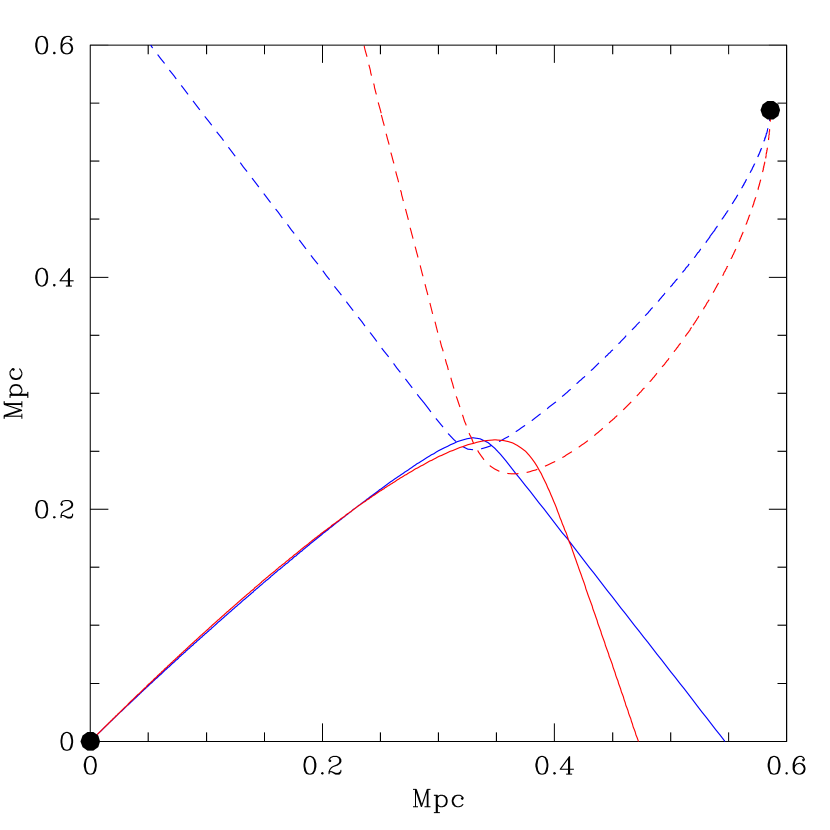
Combining the derived density and temperature jumps across the NW edge gives a pressure jump of ( error). The pressure in the core should be greater than that in the ambient medium due to ram pressure; however, the error on the pressure jump limits the relative velocity between the two subclusters to be less than approximately 1600 km s-1. The curved shape of the wakes in A1758N shows that the collision of the two systems was not head-on. The SE subcluster appears to have been deflected from a NE trajectory towards the SE, while the NE cluster appears to have been deflected from a western trajectory towards the north. While we cannot determine the detailed merger kinematics without a high resolution temperature map, which would require significantly better photon statistics, we can check the validity of our proposed scheme by simply integrating the equations of motion backward for the two systems from their present positions. To do this we assume: 1) the SE subcluster is presently moving toward the SE and the NW subcluster is presently moving north, 2) the two subclusters can be represented by point masses with masses equal to the virial mass of a 7 keV cluster (using the scaling relations in Bryan & Norman 1998), and 3) the orbits are in the plane of the sky. Figure 9 shows the resulting trajectories assuming present velocities for the NW and SE subclusters of 500 or 1000 km s-1 in the plane of the sky. While this is a highly idealized calculation, both sets of trajectories have similar curvatures as the wakes in Fig. 5. Of course, the extended mass distribution in the clusters would soften the deflection angle near pericenter. Fig. 5 shows that the wake of the SE subcluster is brightest where the curvature is the greatest which occurs at pericenter where ram pressure stripping is the strongest.
Several simulations of merging clusters have recently been presented in the literature that have similar characteristics with A1758N. Figure 3 in Bialek, Evrard, & Mohr (2002) illustrates the trajectory of two subclusters that undergo a deflection of about during their encounter. The smaller cluster in their simulation has a steep X-ray surface brightness profile at its leading edge (i.e., a cold front), and is trailed by denser cooler gas that was displaced by ram pressure. A series of off-axis cluster mergers with different mass ratios was recently published by Ricker & Sarazin (2001). In their simulations with impact parameters of 2 and 5 (where is the scale radius in the NFW dark matter density profile), the clusters experience a significant deflection during their encounter. Their Figure 4 shows that both subclusters are preceded with shocks as they begin separating. The present state of the gas in A1795N is probably best reproduced by the simulations presented in Onura, Kay, & Thomas (2002). Clusters 2 and 8 in their Figure 1 are bimodal with the two subclusters, identified by clumps of low entropy gas, presently separating and preceded by cold fronts and shock heated gas.
4.3. Evolution of the Merger Shocks in A1758N
There is no evidence for a shock front within 400 kpc of either subcluster in A1758N. The average gas temperature within this region has a significantly higher temperature than the gas in the two merging cores, indicating that any merger shocks induced during the encounter have already passed through most of the cluster. As demonstrated by Vikhlinin, Markevitch, & Murray (2001a), the strength of a shock can be derived from the ratio of the stand-off distance between the cold front and the shock, , to the radius of curvature of the cold front, . For weak shocks, this relation can be approximated by . For the NW and SE subclusters, is greater than 4.0 and 2.5, respectively. These large stand-off distances imply shock strengths in both systems. This corresponds to a relative velocity between the two systems of less than 1,500 km s-1, which is consistent with the observed thermal pressure jump across the cold fronts. Correcting for projection effects can only increase the true stand-off distances to the shocks and hence lower the upper limits on the present shock strengths. The expression for used above is only valid in steady-state. Once the stripped remains of the low entropy cores pass the point of closest approach, they will decelerate due to gravity and drag. In the steady-state solution, the shock stand-off distance approaches infinity as the shock decelerates to the sound speed. Obviously, since the stripped cores become subsonic in a finite time, the shock front must begin trailing behind that predicted by the steady-state solution. Correcting for this effect would further lower the limits on the shock strengths.

We have shown that the merger in A1758N is in the late stages of an off-axis encounter between two massive ( keV) systems. Any merger shocks induced during this encounter have already propagated throughout most of the merged system. Randall, Sarazin, & Ricker (2002) showed that the final gas temperature after the merger of two equal mass clusters is approximately 1.4 times their initial temperature. In A1758N, this would predict a final temperature of about 10 keV which agrees with the temperature of the gas beyond the two cores. Fig. 8 shows that the surface brightness of the gas preceding the two cold fronts has a broken power-law profile, but the spectral analysis of the NW subcluster showed that the break was inconsistent with a shock front. During an off-axis encounter, the shock strength, which is determined by the ratio of post-shocked to pre-shocked thermal pressure, will vary greatly as the two systems propagate through gas with a broad range of ambient pressures. Spectral analysis of the gas preceding the NW subcluster indicates that the gas closer to the cold front is cooler than the gas farther from the cold front. Such a situation could arise if the gas that is presently closest to the cold front had a higher initial gas pressure, and hence was shocked more weakly, than the gas presently at larger radii. If the two clusters are indeed moving away from one another at the present time, they should be moving into lower pressure gas which would produce the observed temperature distribution of the gas in front of the NW subcluster.
5. Dynamic State of the A1758S Cluster
The southern cluster in A1758 is also far from dynamical equilibrium as can be seen in the raw PN image (see Fig. 10). With its lower background, the PN data best illustrates the sharp features in A1758S. There are two curved edges visible in Fig. 10. The smaller edge toward the south is concave up and the larger edge toward the north is concave down. These edges have a similar morphology as those observed in A2142 (Markevitch et al. 2000). The orientation of the edges in A1758S suggest that the merger is occurring along an axis running from NNW to SSE and has a smaller impact parameter than the merger in A1758N. An adaptively binned hardness ratio map of A1758S is shown in Fig. 11 along with contours derived from the EPIC mosaic (Fig. 1). As in A1758N, the gas within the two edges is not only the brightest, it is also the coolest, and hence contains the lowest entropy gas. Thus, the two edges in A1758S are most likely cold fronts separating the stripped low entropy cores of two merging subclusters from higher entropy shock heated gas.
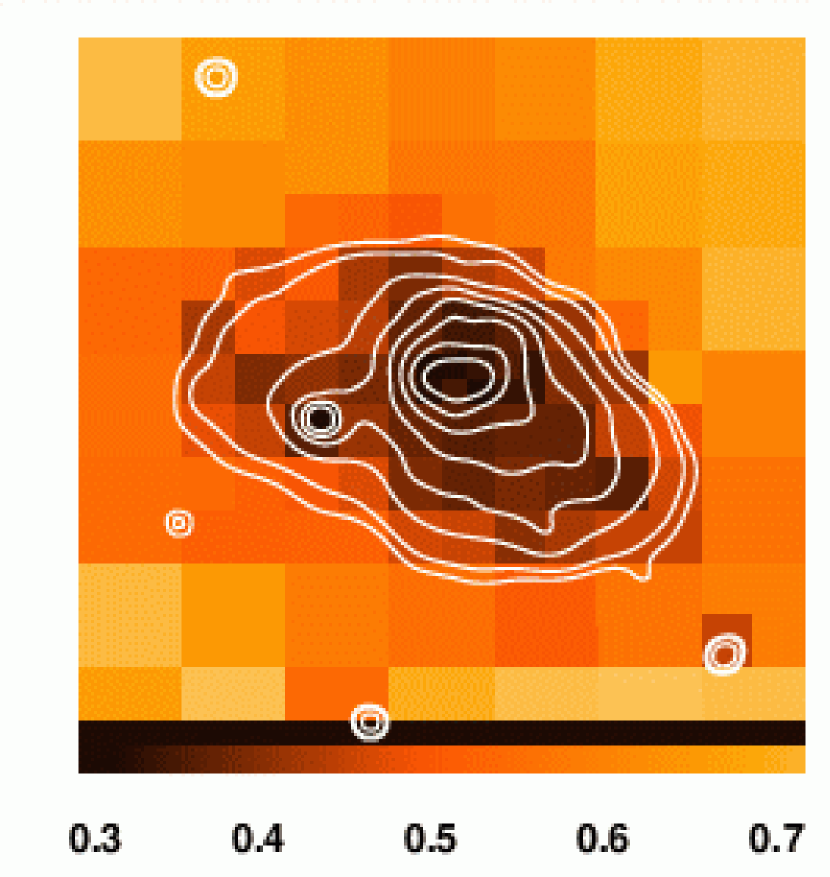
As we did for A1758N, we used the observed morphology and hardness ratio map of A1758S as guides and extracted spectra from all 3 EPIC cameras within the regions shown in Fig. 12 after excising the emission from all point sources. The results of our spectral analysis are presented in Table 4. The small and large cores in Table 4 refer to the two semi-circles in Fig. 12. The emission from the small core is excised from the emission within the large core. The halo in Table 4 refers to the region within the circle but outside the largest semi-circle. As suggested by the hardness ratio map, the halo gas is approximately twice as hot as the gas in the two cores. We also obtained a deprojected gas temperature for the gas within the small core by subtracting the emission from the surrounding larger core and obtained essentially the same best fit temperature.
| kT | Z | ||
|---|---|---|---|
| Region | (keV) | () | /DOF |
| Small Core | 4.6 (4.3-4.9) | 0.26 (0.17-0.35) | 574/414 |
| Large Core | 5.6 (5.1-6.0) | 0.06 ( 0.14) | 396/418 |
| Halo | 10.0 (8.6-11.5) | 0.28 (0.09-0.47) | 1019/923 |
Note. — EPIC spectral fitting results for the three regions in A1758S illustrated in Fig. 12. See the notes to Table 1 for further details of the spectral analysis.
To determine the density jump across the two edges, we extracted surface brightness profiles within pie slices (see Fig. 12). The background-subtracted and exposure-corrected surface brightness profiles are shown in Fig. 13. We then fit the profile across the northern edge with a truncated spheroid plus beta model and obtained a best-fit radius for the spheroidal component of 325 kpc, , and a core radius of 170 kpc. Fitting the same model to the surface brightness profile across the southern edge we obtained a best-fit radius for the spheroidal component of 200 kpc, , and a core radius of 350 kpc. The best fit values are typical of 5 keV clusters. The deprojected density jumps across the two edges are and (1 errors) for the northern and southern edges, respectively. Using the temperatures in Table 4, the pressure jumps are and across the northern and southern edges, respectively. This shows that the pressures within and just beyond the truncated shperiodal components are comparable and these features are consistent with being cold fronts. Given the upper limits on the pressure jumps, the motion of these systems relative to one another other must be less than about 1,400 km s-1.

As mentioned above, the present state of the merger in A1758S is very similar to that found in A2142 (Markevitch et al. 2000). Contrary to A1758N, the X-ray morphology of A1758S is much more symmetric suggesting that A1758S is undergoing a nearly head-on merger. The morphology of A1758S is quite similar to that seen in the simulation of head-on merger simulations by Ricker & Sarazin (2001). At least as seen in projection, the merger in A1758S appears to be near the point of closest approach.
6. Summary
The optically rich cluster Abell 1758 is located in a dynamically active region that contains two hot and X-ray luminous clusters (A1758N and A1758S) with recessional velocities within 2,100 km s-1 and within a projected separation of 2 Mpc. These two systems are most likely gravitationally bound, but there is no evidence for any interaction between the two gaseous atmospheres in the X-ray data. The X-ray morphologies of A1758N and A1758S are very complex indicating that both systems are undergoing major mergers. A1758N is in the later stages of a large impact parameter merger between two 7 keV clusters, while A1758S is in the earlier stages of a merger between two 5 keV clusters. A1758N contains two low entropy cores that were not strongly shocked during the merger. The robustness of the two cores in A1758N indicates that the core of the dark matter distribution in the two clusters is smaller than approximately 100 kpc. Each of these cores has a preceding cold front (separating the low entropy cores and shock heated gas) and a wake of low entropy gas. The surface brightness profiles of the gas preceding the two cold fronts in A1758N are well represented by broken power-laws. The slope of the outer power-law is consistent with the slope typically found in the outskirts of rich clusters. The gas temperature preceding the NW subcluster in A1758N increases with increasing distance from the cold front. A different trend would be observed if the break in the surface brightness was produced by a shock. Based on the X-ray morphology of A1758N, we propose that both systems have undergone significant deflections during their merger. Thus, these systems would have propagated through a broad range of ambient gas pressures producing a broad range of shock strengths. The lower temperature gas located directly in front of the NW subcluster may have been shocked as the two cores passed close to one another while the gas pressure was high. As the two systems receded from one another into lower pressure gas, the shock strength would increase producing higher post-shocked temperatures. The chaotic entropy distribution of the gas in A1758N will drive a significant redistribution of the energy deposited by the merger shock via convection.
A1758S is undergoing a major merger between two 5 keV clusters. The X-ray morphology of A1758S is very similar to that seen in A2142 (Markevitch et al. 2000). The cores of the two subclusters are nearly coincident on the plane of the sky. The X-ray morphology of A1758S is more symmetric than the morphology in A1758N, suggesting that the merger in A1758S is more nearly head-on. Both subclusters in A1758S are preceded by cold fronts, which in turn are surrounding by hotter gas that was probably shock heated during the merger. The upper limits on the pressure jump across the two cold fronts indicate that the relative velocity between the two subclusters must be less than 1,400 km s-1. The two cores in A1758S have radii of 200 kpc and 350 kpc, compared to 80 and 115 kpc in A1758N, indicating that these cores have not experienced as much ram pressure stripping. This is consistent with A1758S being in the earlier stages of a merger, especially if the merger in A1758S is nearly head-on. There is also no evidence in the XMM-Newton data for low entropy wakes in A1758S, which probably indicates that all of the gas that has been stripped from the two cores was shocked while it was being stripped. This is also reasonable since ram pressure stripping should be the most violent during the early stages of a merger while the outer, lower pressure gas is being stripped.
Abell 1758 is a remarkable system with 4 subclusters hotter than 5 keV within a region of 2 Mpc. Using the simulations of Randall, Sarazin, & Ricker (2002) as a guide, the final virialized temperature of A1758 should be about 12 keV. We are thus witnessing the formation of a cluster which will rank among the hottest and most massive clusters found in the local universe.
References
- (1)
- (2) Abell, G. O. 1958, ApJS, 70, 1.
- (3) Allen, S., Schmidt, R. & Fabian, A. 2002, MNRAS, 335, 256.
- (4) Anders, E. & Grevesse, N. 1989, GeCoA, 53, 197.
- (5) Arabadjis, J., Bautz, M. & Garmire, G. 2002, ApJ, 572, 66.
- (6) Bialek, J., Evrard, A. & Mohr, J. 2002, ApJ, 578, 9.
- (7) Blanton, E., Sarazin, C., McNamara, B. & Wise, M. 2001, ApJ, 558, L15.
- (8) Bryan, G. & Norman, M. 1998, ApJ, 495, 80.
- (9) Burns, J., Rhee, G., Owen, F. & Pinkney, J. 1994, ApJ, 423, 94.
- (10) Butcher, H. & Oemler, A. 1984, ApJ, 285, 426.
- (11) David, L., Jones, C. & Forman, W. 1999, ApJ, 519, 533.
- (12) David, L., Nulsen, P., McNamara, B., Forman, W., Jones, C., Ponman, T., Robertson, B. & Wise, M. 2001, ApJ, 557, 546.
- (13) Ettori, S. & Fabian, A. 2000, MNRAS, 317, L57.
- (14) Fabian, A. & Daines, S. 1991, MNRAS, 252, 17p.
- (15) Fabian, A., Sanders, J., Ettori, S., Taylor, G., Allen, S., Crawford, C., Iwasawa, K. & Johnstone, R. 2001, MNRAS, 321, L33.
- (16) Gomez, P.L., Loken, C., Roettiger, K. & Burns, J.O. 2002, ApJ, 569, 122.
- (17) Kempner, J. & Sarazin, C. 2001, ApJ, 548, 639.
- (18) Kempner, J., Sarazin, C. & Ricker, P. 2002, ApJ, 579, 236.
- (19) Lloyd-Davies, E., Ponman, T. & Cannon, D. 2000, MNRAS, 315, 689.
- (20) Markevitch, M. et al. 2000 ApJ, 541, 542.
- (21) Markevitch, M., Vikhlinin, A. & Mazzotta, P. 2001, ApJ, 562, L153.
- (22) Markevitch, M., Gonzalez, A., David, L., Vikhlinin, A., Murray, S., Forman, W., Jones, C. & Tucker, W. 2002, ApJ, 567 L27.
- (23) Markevitch, M. et al. 2003, ApJ, 583, 70.
- (24) Mushotzky, R. & Scharf, C. 1997, ApJ, 482, L13.
- (25) Mazzotta, P., Kaastra, J., Paerels, F., Ferrigno, C., Colafrancesco, S., Mewe, R. & Forman, W. 2002, ApJ, 567, 37.
- (26) Mazzotta, P., Fusco-Femiano, R. & Vikhlinin, A. 2002, ApJ, 569, L31.
- (27) O’Dea, C., Owen, F. 1985, AJ, 90, 954.
- (28) Onura, L., Kay, S. & Thomas, P. 2002 (astro-ph/0209582).
- (29) Pearce, F.R., Thomas, P.A. & Couchman, M.P. 1994, MNRAS, 268, 953.
- (30) Randall, S., Sarazin, C. & Ricker, P. 2002, ApJ, 577, 579.
- (31) Ricker, P.M. & Sarazin, C.L. 2001, ApJ, 561, 621.
- (32) Rizza, E., Burns, J., Ledlow, M., Owen, F., Voges, W. & Bliton, M. 1998, MNRAS, 301, 328.
- (33) Rowley, D., Thomas, P. & Kay, S. 2003, (astro-ph 0310493).
- (34) Sanders, J.S. & Fabian, A.C. 2001, MNRAS, 325, 178.
- (35) Sarazin, C., 2002, in Merging Processes in Galaxy Clusters, ed. L. Feretti, I.M. Gioia & G. Giovannini (Dordrecht:Kluwer),1.
- (36) Vikhlinin, A., Markevitch, M. & Murray, S. 2001a, ApJ, 551, 160.
- (37) Vikhlinin, A., Markevitch, M. & Murray, S. 2001b, ApJ, 549, L47.
- (38)