From BeppoSAX to INTEGRAL: PDS observations of hard X-ray sources detected in the IBIS survey
Abstract
The first IBIS galactic plane survey has provided a list of high energy emitting objects above 20 keV; these sources have been detected mostly in the crowded region of the Galactic Centre and partly along the Galactic Plane. In order to validate the detection procedure, to help in the identification process and to study the nature of these IBIS sources, this list has been cross correlated with the data archive of the PDS instrument on BeppoSAX, which operated in a similar energy band and with a similar sensitivity. We discover a number of associations whose detailed analysis will be particularly useful for the survey work. Also, thanks to the imaging capability of IBIS/ISGRI, objects which could not be studied by the PDS due to contamination from nearby sources can now be associated with a definite source or sources.
keywords:
hard X-ray sources; compact objects1 Introduction
The IBIS/ISGRI Survey (Bird et al. 2004) contains 123 high energy emitting objects detected with the unprecedented sensitivity of 1 mCrab in the energy range 20-100 keV discovered by mosaicing all core program observations performed in the first year of the mission; this first catalogue contains 23 high mass and 53 low mass binary systems, 5 AGN, a few SNR/X-ray pulsar systems, a few isolated pulsars and a handful of other objects. Around 30 remain at the moment unidentified and are the main targets of follow up observations. Observations of these and other sources in the IBIS survey at X-ray wavelengths are useful in order to assess their nature and overall characteristics; in this sense the BeppoSAX/PDS archive is a powerful tool as it can provide information on any spectral and/or flux variation provided that the PDS observation was not contaminated by nearby sources. To this end, we have started a program to analyse all PDS observations which contain in the field of view a source detected by IBIS: the systematic search of the archive has provided a set of 68 objects which were targets of BeppoSAX observations and so have both MECS/PDS (2-100 keV band) data. In this case it is possible to reconsider the PDS data in the light of the IBIS images in order to exclude or evaluate any contamination present. The PDS field of view is 1.3∘ (FWHM), hexagonal in shape and with no imaging capability (Frontera et al. 1997). The response matrix of this instrument is triangular in both directions, with a flat top of 3’ and a reduction in sensitivity of a factor of 2 at 38’ from the centre up to zero response at 78’ distance . The MECS has instead a field of view of 30’ radius and so covers only about 10% of the PDS view. Therefore it is also possible that a source is not seen by the MECS but serendipitously observed by the PDS. In fact, from our search, 21 IBIS survey sources were measured by the PDS in this mode. For the remaining sources there is no BeppoSAX pointing. Herein we present a few interesting cases where IBIS/PDS data can be used together in order to define the high energy characteristics of some of these objects which were serendipitously detected by Beppo/SAX.
2 Data Analysis
The dataset used in this work consists of all Core Program
observations (GPS and GCDE) performed from revolution 20 to revolution
145. ISGRI images were generated for each selected pointing in the
sky in the 20-100 keV band by combining in mosaics all
available science windows (scw) with the ISDC offline scientific analysis software (OSA)
version 3 (Goldwurm et al. 2003). Source ghosts in the images have been
cleaned using an appropriate catalogue available at the ISDC. More
details on the data analysis can be found in Bird et al. (2004).
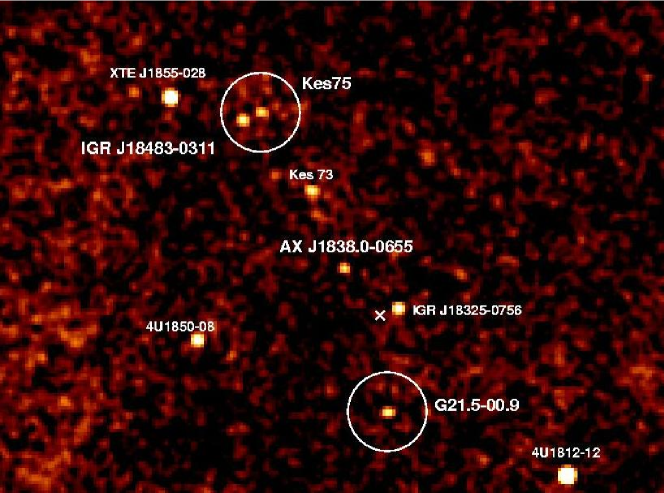
Figure 1 shows the first field studied in this work: it represents a
mosaic in the 20-100 keV band of the Scutum region consisting of 400 science windows
(fixed pointings that last about 37 minutes each).
In this region we find three PDS pointings: the two SNRs,
Kes75 and SNR 021.5-00.9 (case A and B) and the serendipitous PDS
detection of a new unidentified X- ray source AX J1838-0655
(case C). The two circles in figure 1 represent the PDS field of view
pointed at the two SNRs, while the case of the new source is discussed
further in a separate section. Finally, in the last section, we
discuss the case of another new ISGRI source IGR J16207-5129 and
present its PDS spectrum. It is important to note that none of the
BeppoSAX data presented in this paper have been reported in the
literature yet.
In the following, ISGRI fluxes are based on the count rates quoted in the survey
(Bird et al. 2004) and scaled with the Crab results.

2.1 Case A: SNR 021.5-00.9
BeppoSAX pointed at the SNR 021.5-00.9 three times and high energy emission (20-100 keV) has been detected by the PDS instrument. This looks as the simplest case of figure 1 where the only high energy emitter in the PDS field of view is SNR 021.5-00.9. Since the PDS detection looks uncontaminated we have analysed the data: a fit with a simple power law (=2.4) gives a 20-100 keV average flux of 1.2 10-11 erg cm-2 s-1. This flux is lower than that seen by ISGRI (Bird et al. 2004) indicating a possible variability of the source or a contamination in the PDS offset pointings. Since variability in unlikely in G021.5-00.9, we have checked if the offset field measurements provide indication for the presence of a high energy emitting source. Indeed a 9 source was discovered in one of the two offset pointings: cross-checking this PDS offset pointing with the ISGRI image we found that the contaminating source was IGR J18325-0756 (see X point in figure 1). The corrected spectrum of SNR 021.5-00.9 is shown in figure 2. A fit to this spectrum provides a of about 2.6 and a 20-100 keV flux of 4-5 10-11 erg cm-2 s-1 more in line with the ISGRI detection ( 6 10-11 erg cm-2 s-1 ). Furthermore, the PDS spectrum of IGR J18325-075 (see figure 3), is well fitted with a power law with 2.5 and a 20-100 keV flux of 7 10-11 erg cm-2 s-1 again consistent with the ISGRI detection ( 8 10-11 erg cm-2 s-1).

2.2 Case B: Kes 75 (SNR 029.7-00.2)
As clearly shown in figure 1, in the PDS field of view of the BeppoSAX pointing of Kes 75 (also AXJ1846.4-0258, a SNR with an X-ray pulsar) there is another high energy emitter which was detected for the first time by ISGRI (Bird et al. 2004) and named IGR J18483-0311. This new ISGRI source is 31’ away from Kes 75, and so it is not in the MECS field of view but is likely to have been serendipitously detected by the PDS, unless it is a transient object not active at the time of the BeppoSAX measurement. Analysis of the BeppoSAX of Kes 75 indicates contamination by this nearby source and in fact the MECS/PDS cross-calibration constant is 3.5 i.e. outside the nominal range of 0.75-0.95 generally observed. In figure 4 the PDS spectrum from the pointing containing both Kes 75 and IGR J18482-0311 is reported. The solid line is the extrapolation of the MECS spectrum of Kes 75 and provides 20-100 keV flux of 3 10-11 erg cm-2 s-1. The difference between this and the data points is reported in figure 5 which should be taken with caution but can be use as a reference spectrum for this ISGRI source. The estimated flux is 6 10-11 erg cm-2 s-1 consistent with the ISGRI detection ( 6 10-11 erg cm-2 s-1).


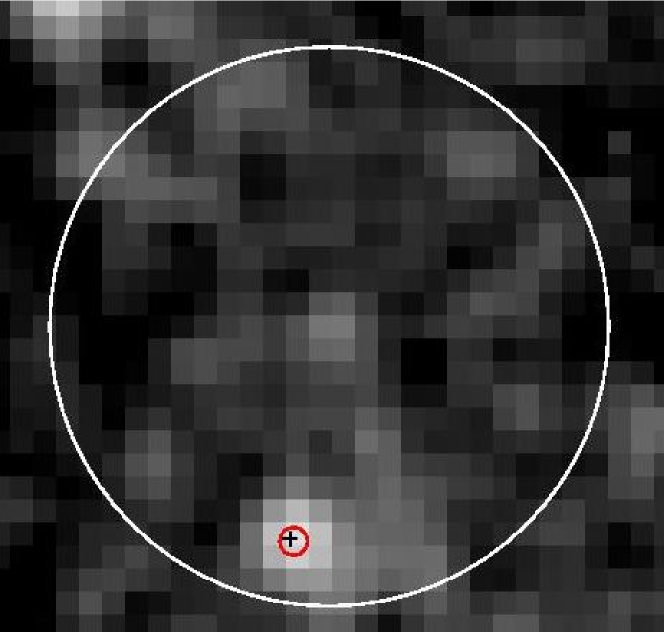

2.3 Case C: AX J1838.0-0655
In figure 6 a close-up of the area around the IBIS survey source AX J1838.0-0655 (see also figure 1) is shown. AX J1838.0-0655 was first detected by the IPC instrument on the Einstein satellite (1E1835.3-0658, Hertz & Grindlay 1988) with an associated 90% error radius of 49”. The source was also detected by ASCA in the 0.7-10 keV range during the galactic plane survey (Sugizaki et al. 2001 and Bamba et al. 2003) with an associated uncertainty of 1’ radius. Finally, AX J1838.0-0655 was serendipitously detected twice by the PDS instrument during the BeppoSAX pointings devoted to the study of the GEV source 1837-0610. In figure 6 the cross represents the Einsten position, the small circle the ASCA error box while the large circle is the PDS field of view. It is clear from the IBIS image that AX J1838-0655 is the only hard X-ray emitter in the PDS field of view. It is detected by ISGRI at 13 in the 20-100 keV range in the cumulative exposure with an average flux of about 2-3 mCrab. The source, still unidentified, is a bright (1.1 10-11 erg cm-2 s-1, flat (=0.5) and variable ASCA source (Sugizaki et al. 2001). The PDS data show a steep spectrum (=2.5, see figure 7) and a 20-100 keV flux of around 2 mCrab in agreement with the ISGRI flux. A detailed discussion on the possible nature of AX J1838.0-0655 is reported in Malizia et al. (2004).
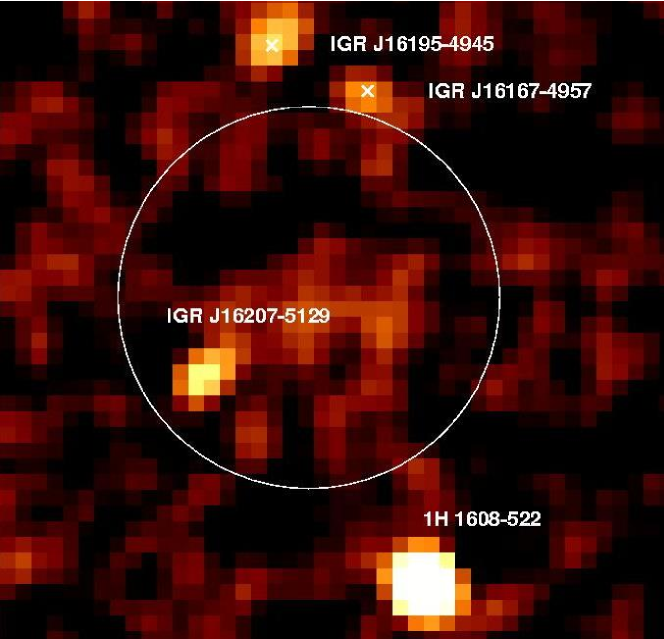
3 IGR J16207-5129
In figure 8 the ISGRI image (20-100 keV) of the field containing another new IBIS Survey source IGR J16207-5129 (Atel #229, Walter et al. 2004) is shown. The image is a zoom of a mosaic of the Norma region obtained by summing 470 science windows. Again the circle represents the PDS field of view. In this last case, BeppoSAX was targeted on the SNR 1E161348-5055 which is located at the centre of the circle and which obviously has not been detected by ISGRI. BeppoSAX pointed at 1E161348-5055 three times in 1998/99 and a source was detected in the first and third pointings only, demonstrating variability over a period of 6 months. The high energy emission definitely does not come from the SNR since the MECS/PDS cross-calibration factor is higher than 100. In both the first and the last observations, the 20-100 keV data are well fitted with a simple power law of photon index 2.5 with a flux of 6 10-11 erg cm-2 s-1, much in agreement with the ISGRI data ( 7 10-11 erg cm-2 s-1). In figure 9 the PDS 20-100 keV spectrum of the first pointing is shown. The ISGRI data demonstrates that the source of the high energy emission is not the BeppoSAX target, but is the new ISGRI source IGR J16207-5129.

4 Conclusions
In this paper we have demonstrated that the combination of BeppoSAX/PDS and ISGRI data can produce a clearer understanding of the nature of high energy emitters. Work is continuing on this correlation analysis and will improve as the IBIS survey dataset increases.
Acknowledgments
We acknowledge financial support by ASI (Italian Space Agency) via contract I/R/041/02.
References
- (1) Bamba, A., et al. 2003, ApJ, 589, 253
- Bird (2004) Bird, A. J., et al. 2004, ApJ Letters, in press
- Frontera (1997) Frontera, F., Costa, E., Dal Fiume, D. et al. 1997, A&AS, 122
- Goldwurm (2003) Goldwurm, A., et al. 2003, A&A 411, L223
- (5) Hertz, P. & Grindlay, J. 1988, AJ, 96
- (6) Malizia, A., et al. 2004, in preparation
- (7) Suguzaki, M., et al. 2001, ApJS, 134, 77
- (8) Walter R. et al. 2004, Atel #229